Avoid artifacts. Examine the pressure tracings to make sure that the pressures are not damped or distorted by incorrect catheter position (e.g., when a pigtail catheter has a side hole above the aortic valve during recording of left ventricular pressures). Some common artifacts are shown in Figure 28.1.
Note whether intracardiac pressures are elevated. Elevation in diastolic pressures is a sensitive indicator that pathology is present. Conversely, “normal” diastolic pressures may mask characteristic hemodynamic findings (e.g., in restrictive cardiomyopathy or constrictive pericarditis) and should elicit a fluid bolus if there is a high degree of clinical suspicion.
Examine pressure waveforms from each cardiac chamber, the aorta, and the pulmonary artery. Examine A and V waves and X and Y descents in atrial tracings and determine whether characteristic waveforms (e.g., W or M configuration) are present. Similarly, in ventricular tracings, pay special attention to whether a “dip and plateau” configuration is present and to the slope of the rise in pressure during diastole. The aortic pressure tracing can provide helpful clues to many diseases, as discussed in Chapter 4.
Take note of the effect of respiration. In the normal heart, the decrease in intrathoracic pressure with inspiration is transmitted to the heart with characteristic results. If right atrial pressure does not decrease with inspiration (i.e., Kussmaul’s sign), this suggests constrictive pericarditis, but can also be found in other diseases.
Characterize diastolic filling. Examination of the atrial and ventricular pressure tracings can give an indication of diastolic filling patterns. An exaggerated Y descent implies that significant ventricular filling occurs in early diastole, whereas an exaggerated X descent signifies late diastolic filling. For each patient determine whether diastolic filling occurs primarily in early diastole (e.g., constrictive pericarditis or aortic regurgitation), throughout diastole, or in late diastole (e.g., cardiac tamponade).
Interpret cardiac output based on filling pressures. Cardiac output is a function of left ventricular filling pressure. A low cardiac output in the setting of an elevated left ventricular end diastolic pressure (LVEDP) is an ominous finding, whereas low cardiac output with low LVEDP is an expected consequence of dehydration. An elevated cardiac output can be a clue to anemia, arteriovenous shunt (e.g., dialysis graft), high‐output heart failure, anxiety, and so on. Note also that pulmonary artery pressure and pressure gradients across stenotic valves increase in proportion to cardiac output. For example, exercise during right heart catheterization can be a useful technique to unmask symptomatic mitral stenosis.
Compare pressures measured simultaneously from two sites within the heart or major vessels. There are numerous benefits to measuring pressures at two sites simultaneously. Comparison of pressures measured proximal and distal to a diseased valve provides information useful in determining the degree of stenosis or regurgitation. Simultaneous measurement of left ventricular and left atrial pressures (or PCWP) is useful in determining diastolic filling characteristics as well as mitral valve pathology. Also, simultaneous measurement of left ventricular/right ventricular pressures or left ventricular/right atrial pressures gives an indication of whether these chambers are independent or interdependent (e.g., in constrictive pericarditis).
Perform any necessary calculations. Calculate valve area, intracardiac shunt fraction, systemic vascular resistance, and so on as needed. Treatment decisions are often based on the severity of the condition as reflected in these calculations.
Synthesize hemodynamic information with clinical presentation, ECG, past medical history, echocardiographic data, and so on to arrive at a working diagnosis.
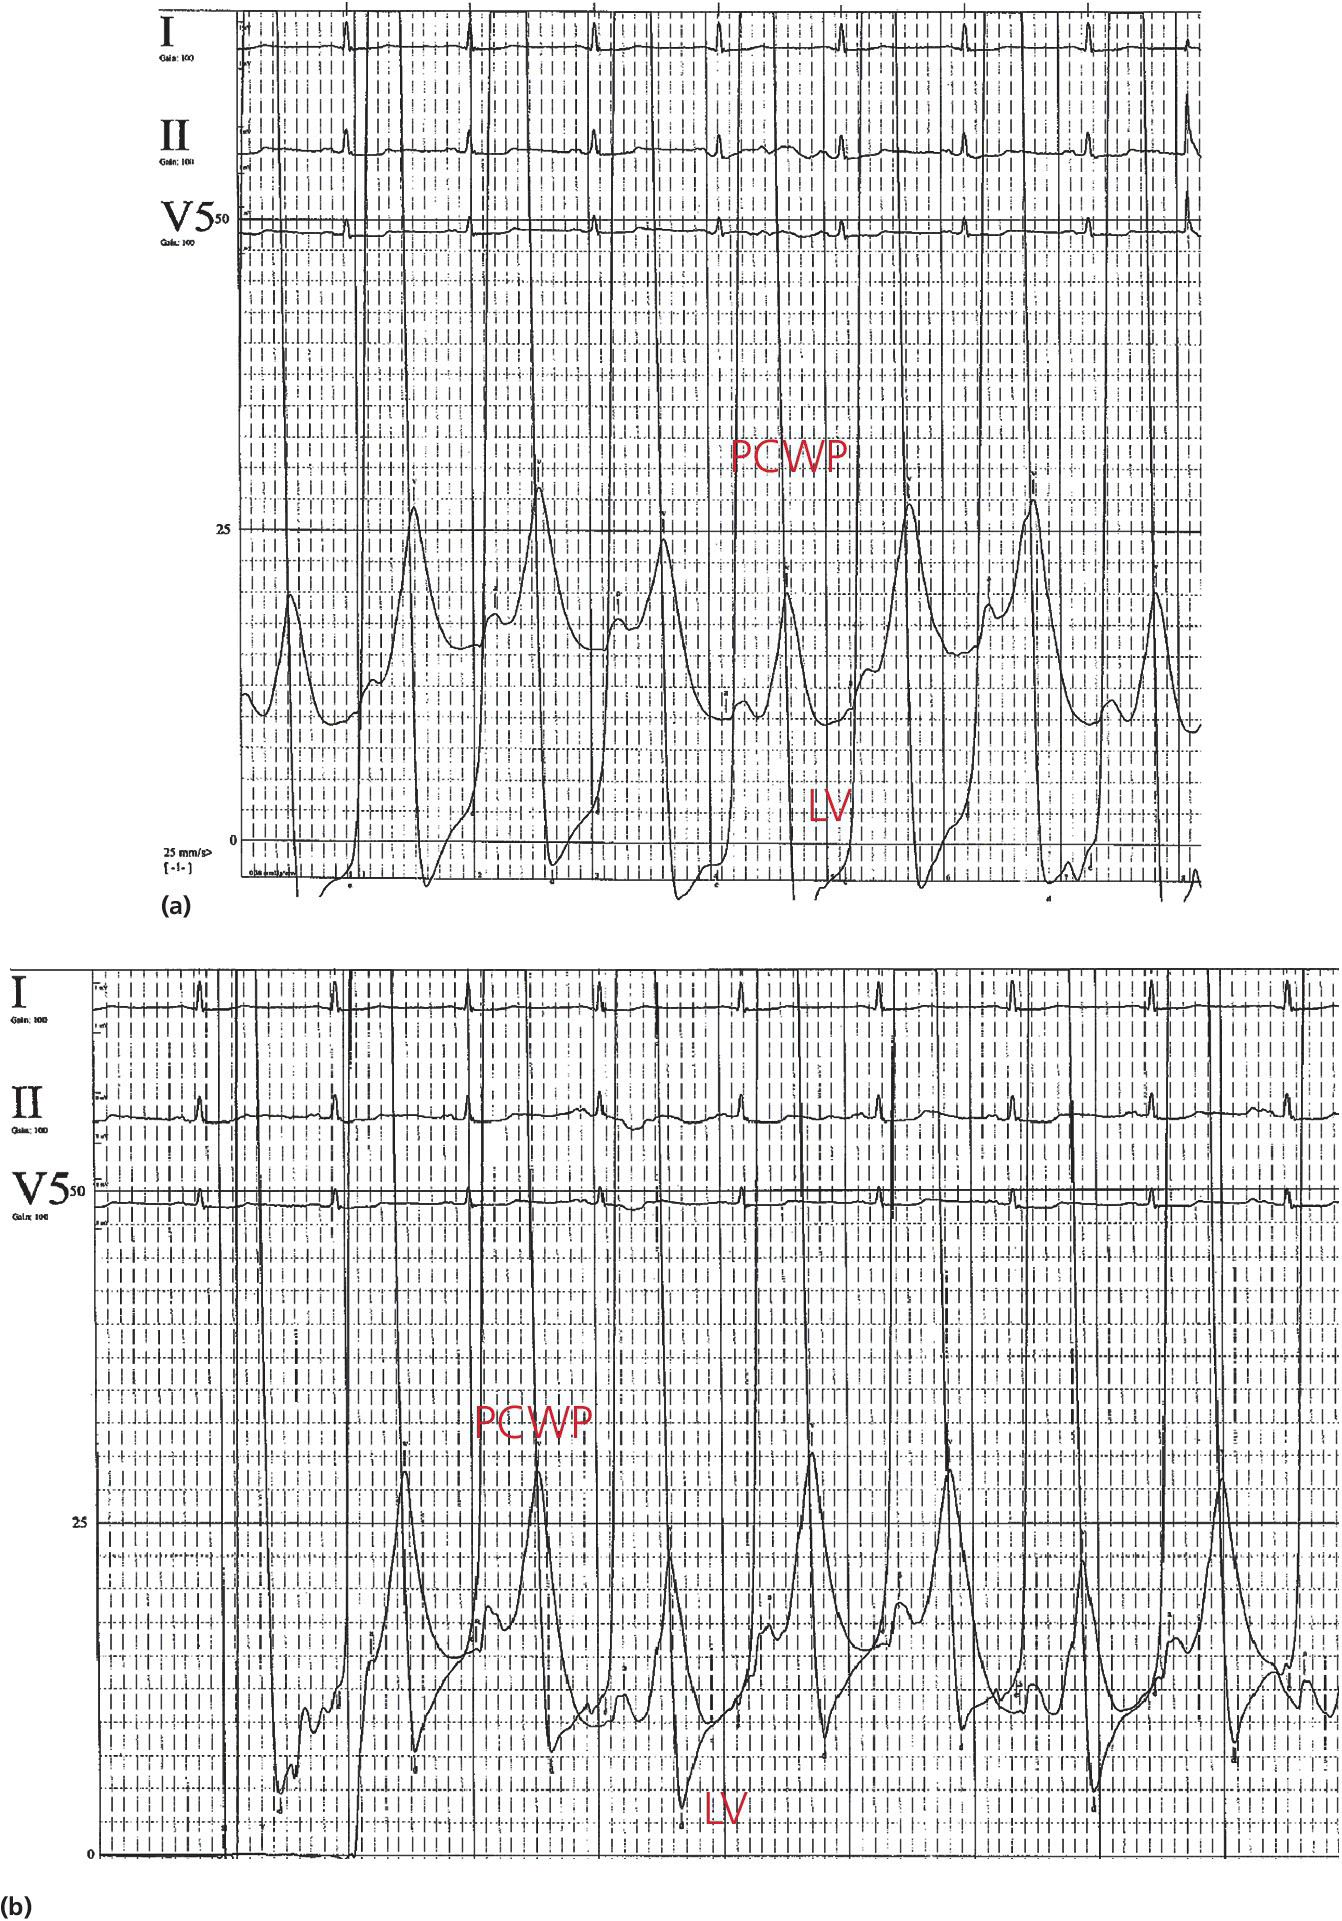
Figure 28.1 These tracings are taken from a 40‐year‐old female who presented with exertional dyspnea. The tracing on the left (a) is consistent with mitral stenosis, with a persistent gradient between pulmonary capillary wedge pressure and left ventricular pressure during diastole. This difference was artifactual and due to incorrect zeroing of the LV pressure transducer. Accurate tracings are shown on the right (b).
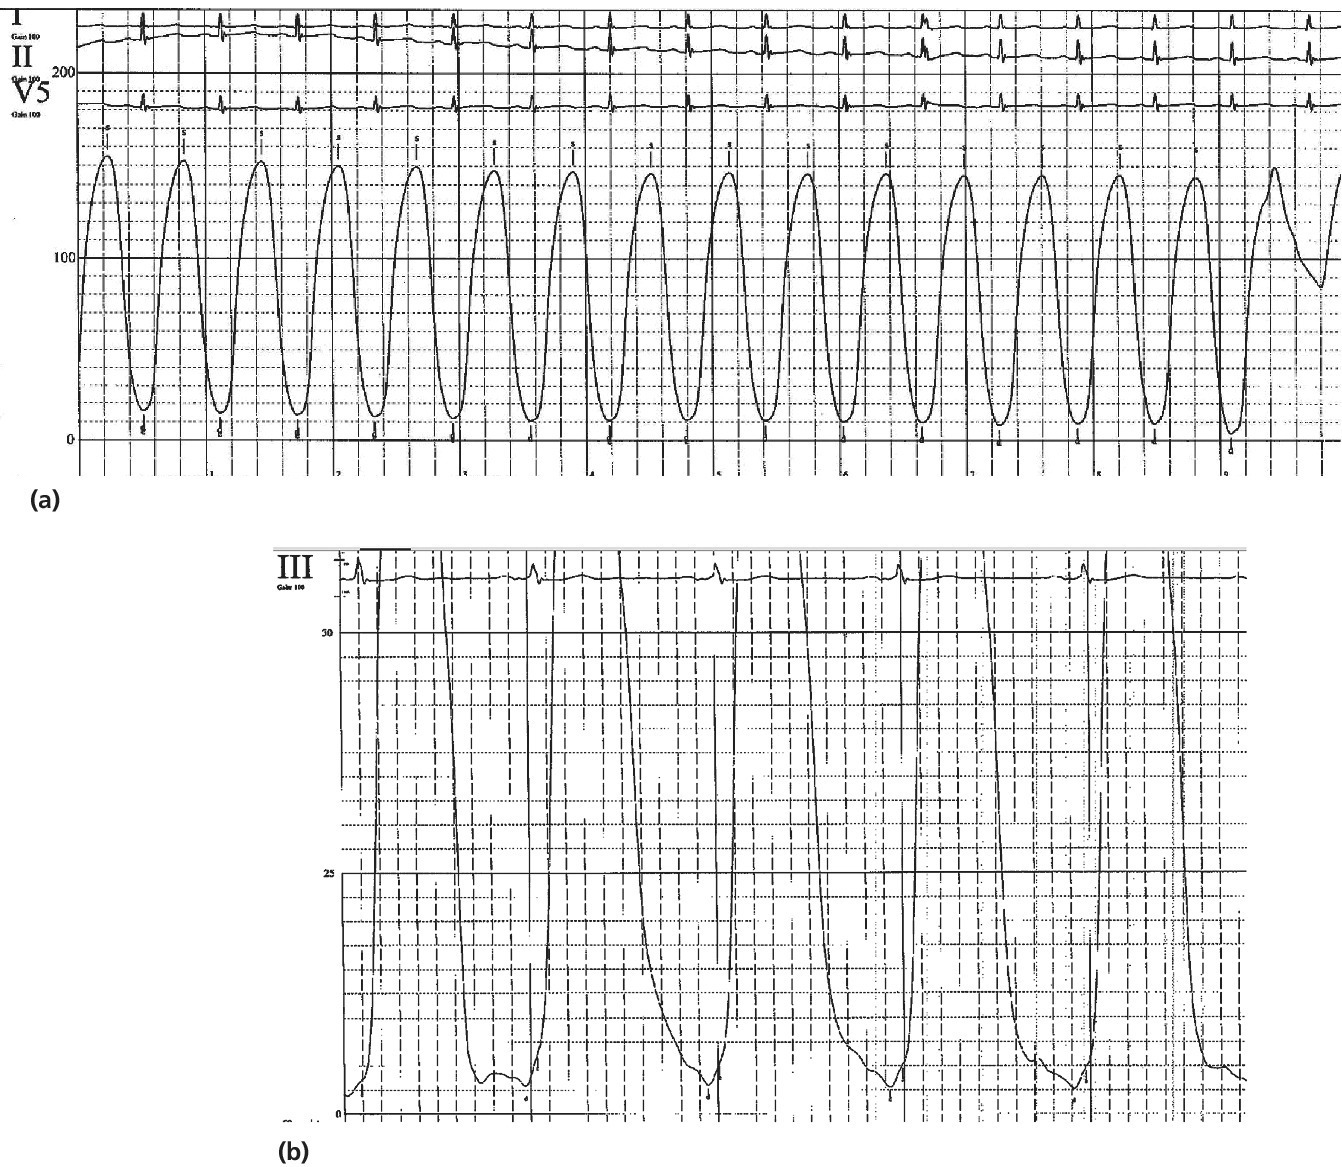
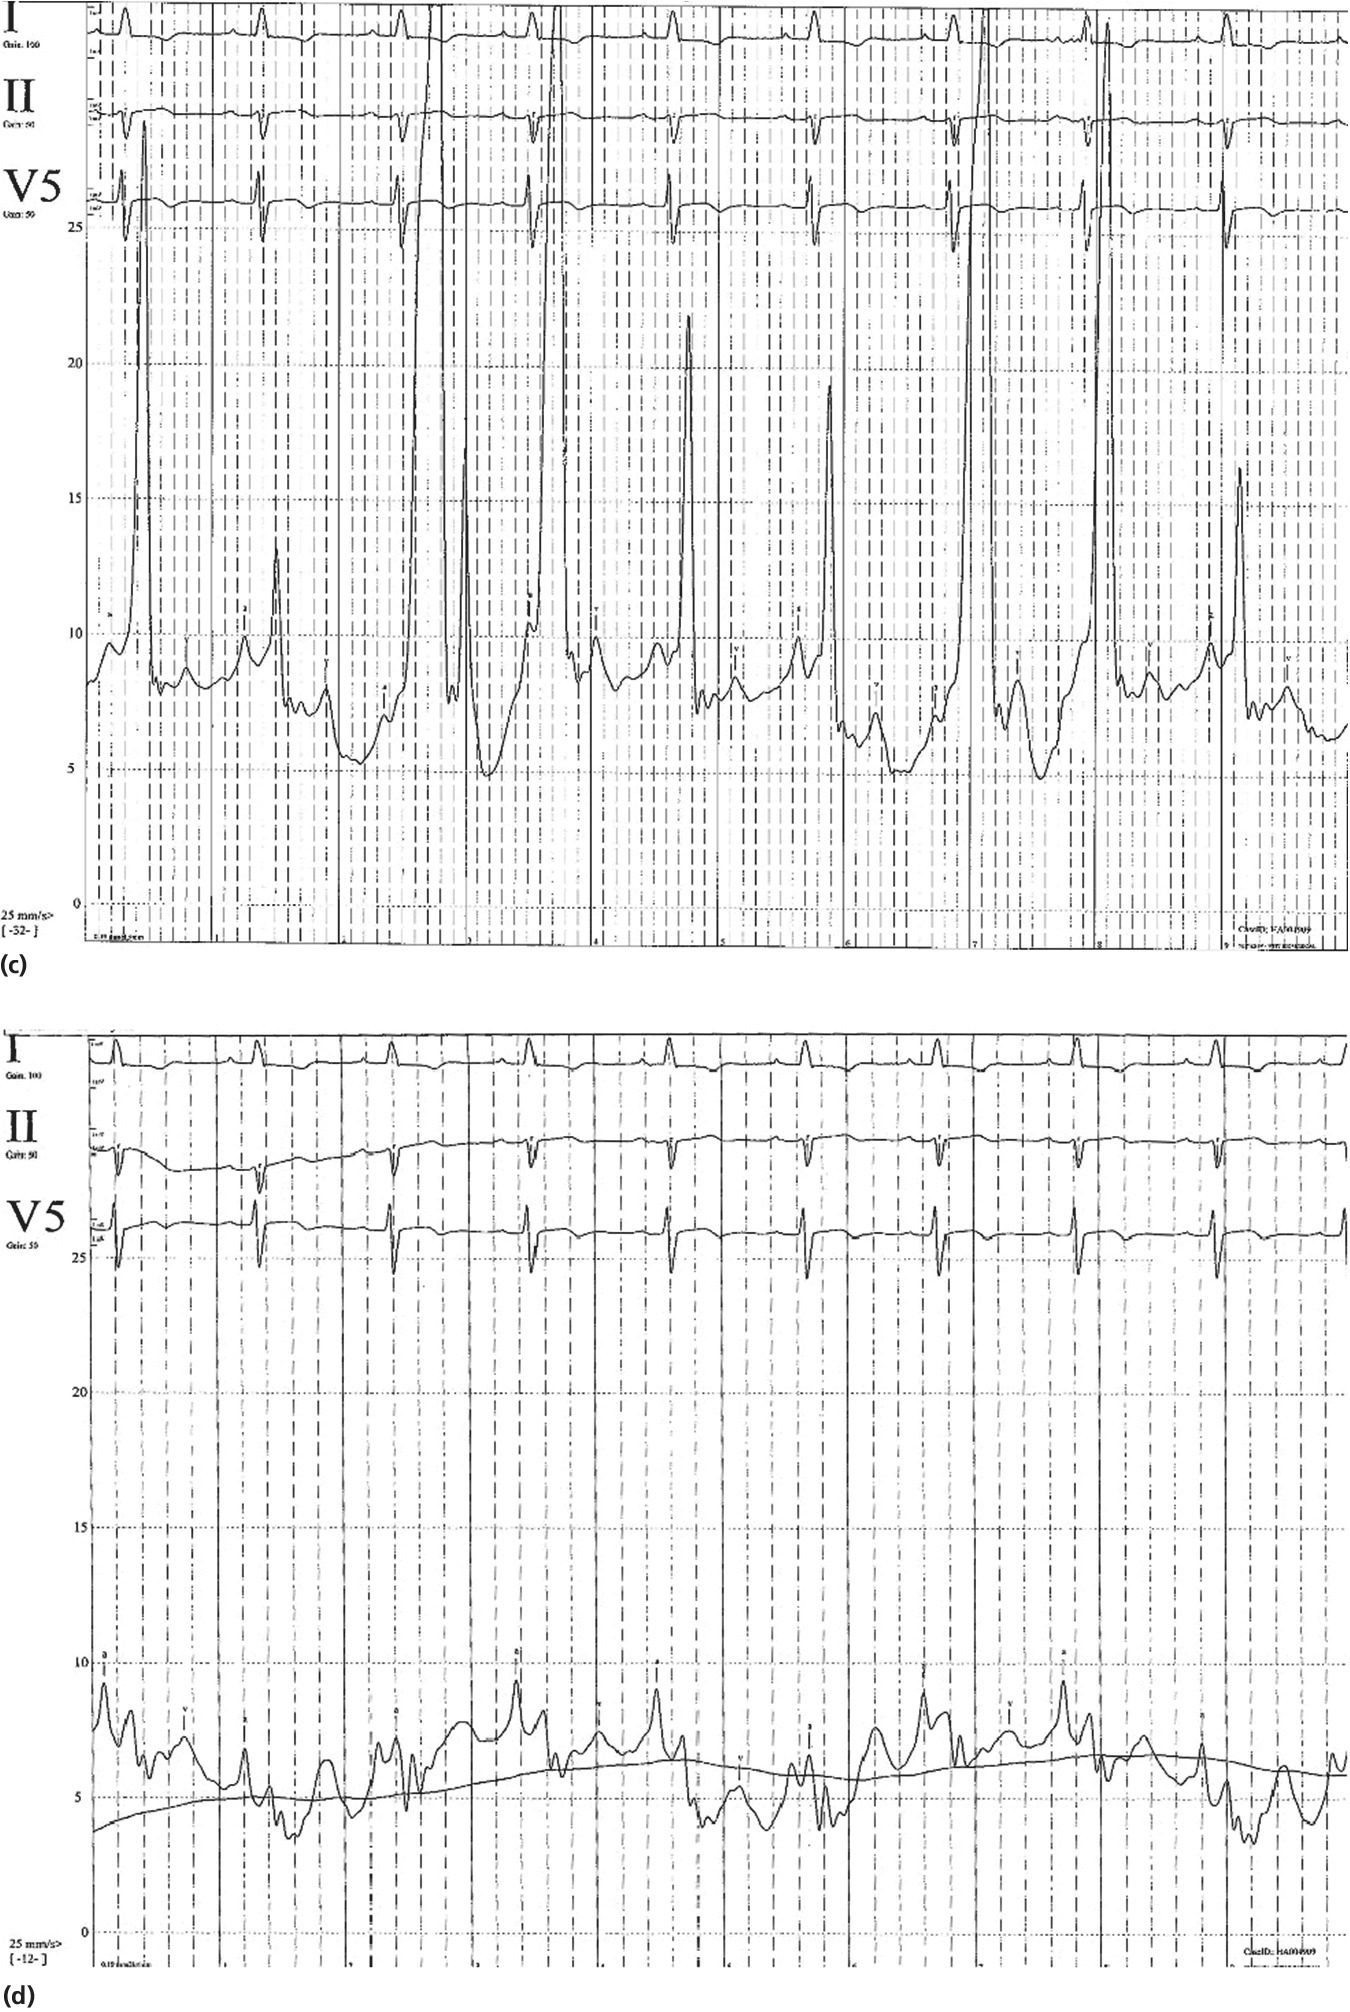
Figure 28.2 Examples of hemodynamic tracings with artifacts. The LV pressure tracing in panel (a) is a damped tracing due to an air bubble being in the line. Note the rounded appearance and lack of definition in the peak systolic and diastolic phases of the tracing. In panel (b), the LV pressure is decreasing during diastole. This is nonphysiologic and is due to a side hole of the pigtail catheter being above the aortic valve. The right atrial tracing in panel (c) has an artifact from periodically going in and out of the tricuspid valve. At first glance, it appears that RA pressures are elevated and that there is a large V wave, consistent with tricuspid regurgitation. An accurate RA tracing is shown in (d).
Unknowns
In the following images are hemodynamic data from 15 patients. See how well you do at identifying the relevant information and answering the questions.
Only gold members can continue reading. Log In or Register to continue