CHAPTER 4 George A. Stouffer Arterial blood pressure is one of the most fundamental measurements in hemodynamics. Because of the need to quantify pressure levels, emphasis is placed on mean, systolic, or diastolic values (see Table 4.1). These values, while tremendously useful, do not provide complete information to characterize the composite pressure wave, either within the aorta or as it undergoes significant changes during propagation within the arterial system. Table 4.1 Definition of terms used to describe blood pressure. The aortic pressure wave is not just determined by left ventricular mechanics, but rather results from hydraulic interactions between blood ejected from the contracting left ventricle and the systemic arterial system. The central aortic pressure wave is composed of a forward‐traveling wave generated by left ventricular ejection followed by a backward‐traveling wave reflected from the periphery. Ejection of blood into the aorta generates a pressure wave that is propagated to other arteries throughout the body at a given velocity (termed pulse wave velocity, PWV). At any discontinuity of the vascular wall, but mainly at the arteriolar branching points, the wave is reflected and comes back toward the heart at the same PWV. One way to think about reflected waves is to note that they would be absent if the aorta were an open tube rather than part of a closed system. Pressure wave reflection in the arterial system serves two beneficial purposes. When normally timed, the reflected wave returns to the central aorta in diastole and therefore enhances diastolic perfusion pressure in the coronary circulation. Partial wave reflection also returns a portion of the pulsatile energy content of the waveform to the central aorta where it is dissipated by viscous damping. Thus, wave reflection limits transmission of pulsatile energy into the periphery where it might otherwise damage the microcirculation. The velocity at which the outgoing and reflected waves travel is dependent on the properties (especially elasticity) of the arteries along which they propagate. PWV increases with stiffness and is defined by the Moens–Korteweg equation, PWV = (Eh/2ρR), where E is Young’s modulus of the arterial wall (a measurement of elasticity), h is wall thickness, R is arterial radius at the end of diastole, and ρ is blood density. An important (although simplified) concept is that the longitudinal velocity of pressure waves traveling in distensible tubes is slowed by the extent that the vessel expands with each pulsation. In the normal arterial system, there is a steep gradient of increasing arterial stiffness moving outward from the heart. In a young adult, PWV is only 4–6 m/s in the highly compliant proximal aorta and increases to 8–10 m/s in the stiffer peripheral muscular arteries. Disturbed reflection, for example with increased PWV, can cause the reflected waves to occur earlier, arriving in the central arteries during systole and not during diastole. Thus as aortic elasticity declines, transmission velocity of both forward and reflected waves increases, which causes the reflected wave to arrive at the central aorta earlier in the cardiac cycle and therefore augment pressure in late systole. This in turn contributes to an increase in systolic blood pressure and pulse pressure and a decrease in diastolic blood pressure [1]. These changes increase left ventricular afterload and decrease coronary perfusion pressure. The concept of PWV was originally described early in the twentieth century, but recent advances in noninvasive technologies have greatly increased the interest in using PWV as a surrogate for vascular disease. There are many different ways to measure PWV, but the concept is similar in each. The time delay between arterial pulse wave arrival at a proximal artery (e.g., carotid) and a more distal artery (e.g., the femoral) is measured noninvasively. The distance traveled by the pulse wave is estimated (unless aortic imaging is available to enable direct measurement) and PWV is then calculated as distance/time (m/s). Measurement of PWV has been shown to correlate with aortic stiffness and, more importantly, to be predictive of clinical events [2,3]. Not surprisingly, PWV is increased in individuals with hypertension, diabetes mellitus (DM), tobacco use, atherosclerosis, and end‐stage renal disease (CKD). A simplified relationship to remember is stiffer arteries → increased PWV → earlier arrival of reflected waves → augmentation of systolic rather than diastolic pressure → increased pulse pressure. The definition of hypertension has changed over time as more data have become available on the deleterious effects of different levels of blood pressure. Recommendations for levels of systolic blood pressure (SBP) and diastolic blood pressure (SBP) that would require treatment from the Report of the Eighth Joint National Committee (JNC 8) are described in Table 4.2 [4]. Table 4.2 Recommendations for the management of hypertension by the Panel Members Appointed to the Eighth Joint National Committee (JNC 8). Aortic pressure is the primary determinant of the afterload against which the left ventricle (LV) must pump blood. Given constant preload and contractility, an increase in afterload will reduce cardiac output. The primary determinants of afterload are mean arterial pressure, aortic compliance (distensibility), and aortic valve resistance (the normal aortic valve presents minimal resistance to flow). Thus, hypertension, calcified arteries, and aortic stenosis all represent conditions of increased afterload. The mean arterial pressure (MAP) is the average pressure during the cardiac cycle. Calculation of the true MAP requires integration of the arterial pressure over time. In clinical medicine, a useful approximation of MAP when the heart rate is 60 bpm can be obtained using the following formula: where DBP is the diastolic blood pressure. This formula is only applicable at lower heart rates, because the relative amount of time spent in systole increases at higher heart rates. The major determinant of systolic pressure is stroke volume. Lesser influences include diastolic pressure and aortic compliance. The major determinant of diastolic pressure is systemic vascular resistance (in turn, primarily determined by arteriolar resistance). Lesser determinants include systolic pressure, aortic compliance, and heart rate. The normal aorta is distensible and the diameter can increase up to 15% during LV systole. During diastole, this stored potential energy is released as the aorta recoils, thus helping to maintain diastolic blood pressure (sometimes called the diastolic pump). With age, compliance of the aorta decreases as elastin and collagen change in both amount and properties. Systolic pressure, more so than diastolic pressure, tends to increase with age in individuals over 50 years old and this can be at least partially explained by changes in aortic stiffness. Diastolic pressure, largely determined by peripheral arterial resistance, increases until middle age and then tends to fall. In contrast, systolic pressure and pulse pressure, influenced more by the stiffness of large arteries, as well as peripheral pulse wave reflection and the pattern of left ventricular ejection, increase continuously with age. A pressure waveform generated in the aorta has a characteristic waveform (Figure 4.1). When pressure in the LV exceeds aortic pressure, the aortic valve opens and blood flows rapidly from the LV into the aorta. The steep upstroke (or anacrotic limb) coincides with opening of the aortic valve and reflects the stroke volume ejected by the LV into the aorta (Figure 4.2). The rounded part at the top of the waveform (or anacrotic shoulder) reflects continued flow from the LV to the aorta, but at a reduced rate. The downslope of the pressure tracing (or dicrotic limb) is divided by the dicrotic notch (or incisura), which represents closure of the aortic valve. The location of the dicrotic notch varies according to the timing of aortic closure in the cardiac cycle and will be delayed in patients with hypovolemia (Figure 4.3). Figure 4.1 Schematic of aortic pressure. Figure 4.2 Wiggers diagram [LVEDV = Left Ventricular End Diastolic Volume; LVESV = Left Ventricular End Systolic Volume]. Figure 4.3 Aortic pressure in a hypovolemic patient. Aortic pressure tracings taken in a patient before and after an intravenous (IV) fluid bolus. The aortic waveform has a characteristic shape when left ventricular filling pressures are low. Aortic pressures are low, pulse pressure decreases, the dicrotic limb is steeper, and the dicrotic notch is delayed. The diastolic phase of the aortic pressure tracing gives an indication of peripheral runoff and may also be abnormal. In severe dehydration, there is a sudden descent in aortic pressure and then an almost flat diastolic phase. Aortic and LV systolic pressures decline during the “reduced ejection” phase, which coincides with LV repolarization. When the ventricular pressure drops below that of the aorta, the aortic valve closes. This is represented in the pressure waveform as a dicrotic notch in the downslope of the aortic pressure tracing. This marks the end of LV ejection. Diastolic pressure declines gradually as blood flows from the aorta into the peripheral vessels. The contour of the aortic pressure tracing can provide clues to various disease states (Table 4.3 and Figure 4.4): for example, aortic pressure that rises rapidly, dips, and then rises again (pulsus bisferiens) in hypertrophic obstructive cardiomyopathy or rises slowly (pulsus parvus et tardus) in aortic stenosis (Figure 4.5). Table 4.3 Disease states associated with various pulse characteristics. Figure 4.4 Arterial pressure tracings in various pathologic conditions. Aortic stenosis is characterized by slow upstroke (a). Bisferiens pulse, a name derived from Latin bis (= two) + feriere (= to beat), is characterized by an initial rapid rise in aortic pressure (spike), followed by a slight drop in pressure (dip), and then a secondary peak (dome), and is most commonly associated with hypertrophic obstructive cardiomyopathy (b). Severe aortic regurgitation is characterized by a wide pulse pressure (c). Pulsus alternans with beat‐to‐beat variability in systolic pressure is found in a patient with cardiomyopathy (d). Exaggerated decrease in systolic pressure with inspiration defines pulsus paradoxus (e). Bradycardia with hypotension and ineffective generation of systolic blood pressure during PVCs is apparent in a patient with inferior myocardial infarction (f). Figure 4.5 Aortic pressure in patients with aortic stenosis. Aortic pressure tracings taken in a 60‐year‐old male with aortic valve area of 0.4 cm2 (a) and in a 58‐year‐old male with aortic valve area of 1.1 cm2 (b). Note the delayed upstroke in the aortic pressure tracing during ventricular systole, especially in relation to the rise in left ventricular pressure (b). The augmentation index (AIx) is the proportion of central PP that results from arterial wave reflection and is a commonly used measure of arterial stiffness (Figure 4.6). AIx is a function of the timing of the arrival of the reflected wave at the proximal aorta (determined mostly by large artery PWV) and the magnitude of the reflected waves. The magnitude of reflected waves is determined by the diameter and elasticity of small arteries and arterioles and is thus influenced by vasoactive drugs. AIx is positively correlated with age and blood pressure, and inversely correlated with height and heart rate. Figure 4.6 Augmentation index—the augmentation index (AIx) is given by Changes in thoracic pressure with respiration will influence blood pressure. During normal, spontaneous respiration, intrathoracic pressure decreases during inspiration, which in turn causes a decrease in pericardial and right atrial pressures. This results in augmented systemic venous return to right‐sided chambers and decreased venous return to left‐sided chambers. It is thus normal to have a slight decrease in systolic blood pressure (approximately 5 mm Hg) with inspiration (Figure 4.7). Pulsus paradoxus is an exaggerated decrease in systolic pressure with inspiration and has been variously defined as a drop of >12 mm Hg, a drop of ≥10 mm Hg, or a drop of ≥9% during normal inspiration. Figure 4.7 Effect of respiration on aortic pressure. The tracing in (a) is from a healthy 43‐year‐old female. Note the slight decrease (<10 mm Hg) in systolic pressure with respiration. The tracing in (b) is from a patient with pleural effusions. Note that the systolic pressure declines by 18–22 mm Hg with respiration. The tracing in (c) is taken from a patient in cardiac tamponade. Systolic pressure decreases by approximately 30 mm Hg with inspiration. Note also that the waveform is very abnormal with a steep dicrotic limb, narrow ejection phase, and flat diastolic phase. These findings are consistent with decreased stroke volume and vasoconstriction. Not surprisingly, positive pressure ventilation causes an inversion in the normal relationship between respiration and blood pressure. Blood pressure will increase during inspiration (as thoracic pressure increases). Peripheral amplification is said to occur when systolic blood pressure is higher in peripheral arteries (e.g., femoral or brachial) than in the aorta (mean pressures will be the same). It is primarily observed in young individuals and is caused by the reflected pressure waves returning to the aorta during diastole (and to the peripheral arteries in late systole), making pulse pressure higher in peripheral than in central arteries (Figure 4.8). Figure 4.8 Peripheral amplification. Simultaneous aortic and right femoral artery pressures in a 49‐year‐old male with aortic insufficiency. Note that the systolic pressure is higher and the rapid increase phase narrower in the RFA. Intra‐aortic pressures are measured directly in the intensive care unit, operating room, and cardiac catheterization laboratory. Most clinical decisions are, however, based on noninvasive measurement of blood pressure. This introduces two potential problems: inaccuracies associated with noninvasive measurement of arterial pressure; and inaccuracies associated with the use of the brachial artery, rather than the aorta, as the site of measurement. Despite these limitations, there is a large amount of information including a study of more than 1,000,000 patients [5] demonstrating the usefulness of noninvasively determined brachial blood pressure in clinical decision making. Determination of blood pressure by sphygmomanometer utilizes sounds that are thought to originate from a combination of turbulent flow and arterial wall oscillations. As the blood pressure cuff is deflated from a supraphysiologic pressure, flow through the brachial artery will begin once the systolic pressure is reached. Turbulent flow (and arterial oscillation) ceases once cuff pressure falls below diastolic pressure. In 1905, at a conference at the Imperial Medical Academy, Dr. Nicolai Korotkoff announced a new way to measure blood pressure. Since that time, the sounds heard by a stethoscope placed over the brachial artery during blood pressure cuff deflation have been called Korotkoff sounds and can be divided into five phases. Phase 1 occurs when the cuff pressure equals the systolic pressure and is characterized by a sharp tapping sound. As cuff pressure is lowered, phase 2 occurs, which is characterized by softer and longer sounds. Phase 3 is defined by a resumption of crisp tapping sounds, similar to those heard in phase 1. Phase 4 begins when there is an abrupt muffling of sound as turbulent flow decreases. Finally, phase 5 is when turbulent flow ceases and thus no sound is heard. There is agreement that the onset of phase 1 corresponds to systolic and that the disappearance of sounds (phase 5) corresponds to diastolic pressure. Although some investigators have advocated using phase 4 to define diastole, general practice now is to use phase 4 only in situations in which sounds are audible even after complete deflation of the cuff, such as in pregnancy, arteriovenous fistulas, and aortic insufficiency. No clinical significance has been attached to phases 2 and 3. It is important to note that using Korotkoff sounds to measure blood pressure tends to underestimate intra‐arterial systolic pressure and overestimate intra‐arterial diastolic pressure [6]. Automated oscillometric devices are commonly used to measure brachial artery blood pressure. These devices work by measuring the amplitude of pressure changes as the cuff is deflated. In general, oscillometric devices measure mean blood pressure (MAP) and calculate systolic SBP and DBP based on a proprietary algorithm that, for each manufacturer, is the same for all patients irrespective of age, height, sex, vascular disease, or other clinical variables. Oscillometric MAP correlates well with central aortic MAP, but the assumption that a common algorithm can be used to determine SBP and DBP for all patients may not be correct. Studies have shown that the accuracy of oscillometric pressure is dependent on height, gender, and age [7,8].
Arterial pressure
Term
Definition
Systolic blood pressure
Maximum pressure (peak of arterial pressure wave)
Diastolic blood pressure
Minimum pressure (trough of arterial pressure wave)
Pulse pressure
Difference between systolic and diastolic pressure
Mean arterial pressure
Average pressure during the cardiac cycle
Aortic pressure
SBP (mm Hg)
DBP (mm Hg)
Patients < 60 years
140
90
Patients > 60 years
150
90
Patients with DM
140
90
Patients with CKD
140
90
Mean arterial pressure

Pressure waveform

Label
Characteristics
Disease states
Bounding
Large pulse pressure
Aortic insufficiency, hyperkinetic states (e.g., fever, thyrotoxicosis, anemia), AV fistula
Pulsus parvus et tardus
Slow and weak pulse
Aortic stenosis
Pulsus bisferiens
Two systolic peaks prior to dicrotic notch
Hypertrophic obstructive cardiomyopathy; more rarely in aortic insufficiency
Pulsus alternans
Alternating strong and weak pulses
Severe LV dysfunction
Pulsus paradoxus
Excessive decrease (>10 mm Hg) in systolic pressure with inspiration
Cardiac tamponade; less frequently it can be observed with acute aortic regurgitation (i.e., acute aortic dissection), elevated LVEDP, atrial septal defect, pulmonary hypertension, or right ventricular hypertrophy
Dicrotic pulse
Two systolic peaks with one occurring after dicrotic notch
Low cardiac output + low peripheral resistance; rare in patients >45 years old 
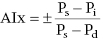 with Ps, Pd, and Pi indicating systolic, diastolic, and inflection pressure, respectively.
Effects of respiration on aortic pressure
Peripheral amplification
Noninvasive measurement of blood pressure
Oscillometric blood pressure devices
Stay updated, free articles. Join our Telegram channel

Full access? Get Clinical Tree


