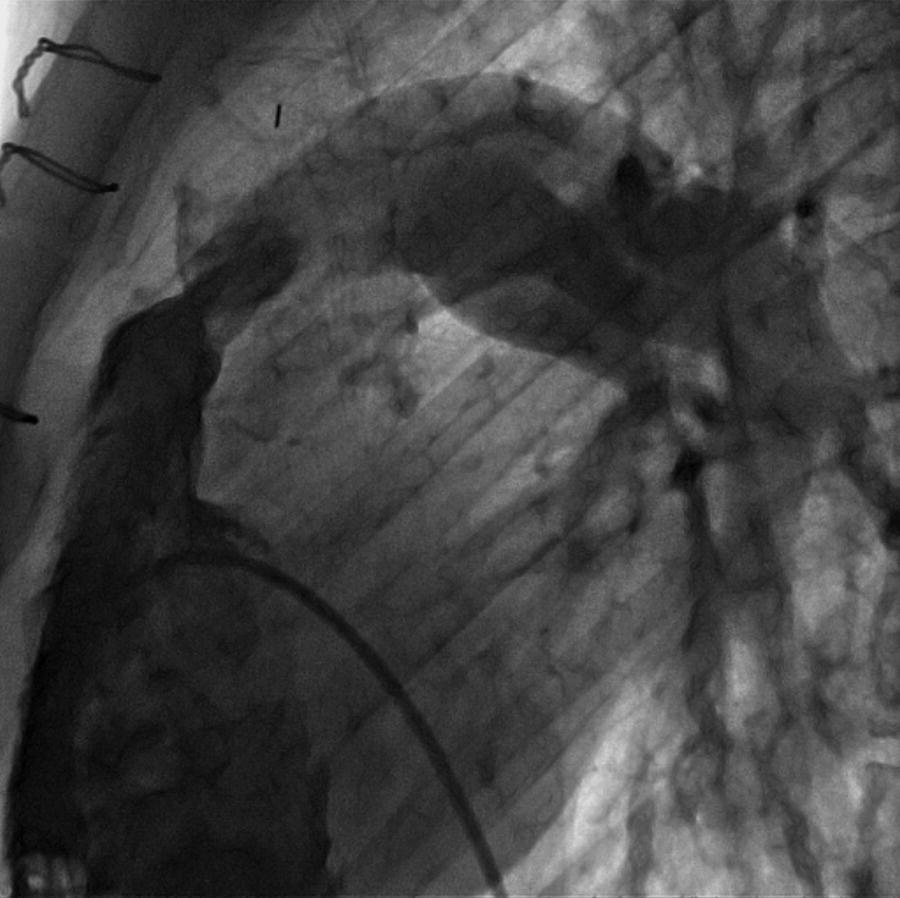
CHAPTER 14 Cynthia Zhou, Anand Shah and George A. Stouffer Hemodynamically significant pulmonic valve disease is rare and usually diagnosed at birth or in childhood. Pulmonary stenosis (PS) is commonly due to isolated valvular obstruction, but may also be due to either subvalvular or supravalvular obstruction. PS is typically first diagnosed in childhood, and it accounts for approximately 8% of all congenital heart defects [1]. The clinical presentation of PS varies from critical stenosis in newborns to asymptomatic mild stenosis without the need for therapy. Severe pulmonary regurgitation (PR) most commonly occurs as a sequelae of treatment of PS or Tetralogy of Fallot, with fewer cases of primary pulmonic valvular regurgitation [2]. The amount of PR is influenced by valvular integrity, right ventricular (RV) size, and RV diastolic pressures. In chronic severe PR, the RV remodels to accommodate the regurgitant flow and RV stroke volume increases to maintain effective forward blood flow. Hemodynamic changes include a widened pulmonary artery (PA) pulse pressure and low PA diastolic pressures. As the amount of regurgitation increases, RV end‐diastolic pressure becomes elevated and systemic cardiac output is reduced, especially with exercise. “Ventricularization” of the PA pressure tracing, in which the contour of the PA pressure is similar to the contour of the RV pressure, is a specific but not sensitive finding in severe PR. The stenotic area in PS can be either valvular, subvalvular, or supravalvular (Figure 14.1) [3]. PS is often seen in conjunction with other congenital heart abnormalities. Most adults with mild to moderate PS are asymptomatic and it will be discovered when a murmur is found during routine physical examination. Patients with more severe PS may experience exertional dyspnea and fatigue. Figure 14.1 Schematic showing various locations of stenotic areas in patients with PS. Mild, moderate, and severe PS as determined by echocardiography are defined as peak pressure gradients of <36 mm Hg, 36–64 mm Hg, and >64 mm Hg, respectively [4]. Long‐term outcomes of patients with PS are dependent on pressure gradient across the valve, with patients with invasively measured peak‐to‐peak gradient of ≤25 mm Hg having normal survival and no progression of their stenosis in 25 years of follow‐up, and patients with a gradient between 25 and 49 mm Hg having a 20% chance of needing an intervention [5]. In valvular PS, the pulmonary valve is generally shaped like a dome and has a narrow central opening. Alternatively, the valve may be dysplastic with myxomatous thickened leaflets, which is seen in Noonan syndrome. There can be a stenotic bicuspid or unicuspid pulmonary valve in Tetralogy of Fallot. Valvular PS can also be associated with other congenital heart defects such as atrial septal defect (ASD), Ebstein’s anomaly, double outlet right ventricle, and transposition of the great arteries. Subvalvular PS can be infundibular or subinfundibular. Primary infundibular PS is generally seen as part of Tetralogy of Fallot, while secondary infundibular hypertrophy may occur in valvular PS and result in dynamic RVOT obstruction. Subinfundibular PS is very rare and referred to as double chambered right ventricle (DCRV). Supravalvular PS can occur as a result of congenital rubella syndrome or can be found in association with other congenital abnormalities, such as in Williams–Beuren, Noonan, Allagile, DiGeorge, and Leopard syndromes. The stenosis can be found in the common pulmonary trunk, the bifurcation, or the pulmonary branches (Figure 14.1). The clinical standard to diagnose PS and quantify its severity is transthoracic 2D echocardiography with Doppler imaging. The valve morphology can be assessed and peak and mean gradients can be measured by Doppler imaging. Computed tomography (CT) can be used to image the anatomy of the right ventricular outflow tract (RVOT) and the pulmonary arterial tree, but lacks the ability to analyze function. Magnetic resonance imaging (MRI) is beneficial for analyzing the anatomy of the RVOT, the pulmonary artery, and its branches. The exact location of the stenosis can be identified, which enables a distinction between valvular, subvalvular, and supravalvular stenosis. MRI is considered the standard for assessment and quantification of right ventricular volume, mass and function. Right heart catheterization has been the traditional way of measuring the severity of PS and is still used prior to treatment, but has largely been supplanted by echocardiography for establishing the diagnosis of PS. Pressure gradients can be measured directly (Figures 14.2 and 14.3) and angiography (Figure 14.4) provides information on the anatomy. Cardiac catheterization also provides the opportunity for treatment via balloon valvuloplasty. Figure 14.2 Simultaneous RV and PA tracings (a) and RA tracing (b) in a 28‐year‐old female with moderate PS. Figure 14.3 Simultaneous RV and PA tracings (a) and RA tracing (b) in a 42‐year‐old female with moderate PS. Figure 14.4 Right ventriculogram in a patient with PS. Note the post‐stenotic dilation. Hemodynamic findings associated with PS include fixed outflow tract obstruction (Figures 14.2a and 14.3a) and diastolic dysfunction (Figures 14.2b and 14.3b). Over time, the RV will hypertrophy in patients with PS in response to the pressure overload. Increased wall thickness causes the RV to become stiffer and less compliant and higher end‐diastolic pressures are required to maintain RV filling. This, in turn, leads to higher RA pressures (Figures 14.2b and 14.3b), which will further increase if RV systolic function starts to fail. Unlike mitral and aortic stenosis in which severity is estimated by calculated valve area, this is rarely used in PS. Rather, severity and need for treatment are generally determined based on peak‐to‐peak gradient across the pulmonic valve (Table 14.1). The success of treatment is also determined by measuring pressure gradients, with treatment considered a success when the invasive gradient is <30 mm Hg. Table 14.1 Severity grading of pulmonary stenosis [4].
Hemodynamic findings in pulmonic valve disease
Pulmonic valve stenosis
Valvular pulmonary stenosis
Subvalvular pulmonary stenosis
Supravalvular pulmonary stenosis
Non‐invasive imaging
Cardiac catheterization and invasive hemodynamics
Mild
Moderate
Severe
Peak Doppler velocity (m/s)
<3
3–4
>4
Peak Doppler gradient (mm Hg)
<36
36–64
>64
Mean Doppler gradient (mm Hg)
>40
Treatment of PS
Stay updated, free articles. Join our Telegram channel

Full access? Get Clinical Tree


