Echocardiography and Coronary Artery Disease


Echocardiography and Coronary Artery Disease


Clinical Overview

Coronary artery disease is the most common form of heart disease encountered in adults. Its clinical presentations are the result of atherosclerotic disease of the coronary arteries and include syndromes of stable and unstable angina, acute myocardial infarction, ischemic cardiomyopathy with congestive heart failure, and sudden cardiac death. The role of echocardiography in ischemic heart disease includes diagnosing, detecting complications, and assessing prognosis. The American College of Cardiology and the American Heart Association have established areas for which echocardiography is an appropriate diagnostic tool in patients with known or suspected coronary artery disease (Table 16.1).


Pathophysiology of Coronary Syndromes

Normal left ventricular wall motion consists of simultaneous myocardial thickening and endocardial excursion so that the cavity decreases in size in a relatively symmetric manner (Figs. 16.1, 16.2 and 16.3). Interruption of normal myocardial contraction, due to ischemia or infarction, results in regional abnormalities of thickening and endocardial motion.

There is a well-defined hierarchy of functional abnormalities that occur as a consequence of myocardial ischemia. This has been termed the “ischemic cascade” and is schematized in Figure 16.4. Resting blood flow to the myocardium is preserved until a coronary stenosis approaches 90% diameter narrowing. It should be emphasized that simple diameter narrowing is only one component of a complex anatomic and physiologic abnormality that results in reduced coronary flow. Lesion eccentricity, length, and number of sequential lesions, as well as vasomotor tone, all play crucial roles. At lesser degrees of stenosis, rest flow is preserved, but coronary flow reserve may be reduced. At times of increasing demand such as exercise, a supply-demand mismatch occurs. Creation and detection of a supply-demand mismatch, in the presence of an otherwise nonobstructive lesion, is the underlying principle of stress echocardiography and other stress-testing techniques designed to unmask occult coronary artery stenoses (see Chapter 17).


Table 16.1 Appropriateness Criteria for Use of Echocardiography in Coronary Artery Disease


Indication


Appropriateness Score (1-9)


1.


Symptoms potentially due to suspected cardiac etiology, including but limited to dyspnea, shortness of breath, lightheadedness, syncope, TIA, cerebrovascular events.


A (9)


2.


Prior testing that is concerning for heart disease (i.e., chest X-ray, baseline scout images for stress echocardiogram, ECG, elevation of serum BNP.


A (8)


6.


Patients who have sustained or nonsustained SVT or VT.


A (8)


8.


Initial evaluation of LV function following acute MI.


A (9)


9.


Reevaluation of LV function following MI during recovery phase when results will guide therapy.


A (8)


7.


Evaluation of LV function with prior ventricular function evaluation within the past year with normal function (such as prior echocardiogram, LV gram, SPECT, cardiac MRI) in patients in whom there has been no change in clinical status.


I (2)


11.


Evaluation of hypotension or hemodynamic instability of uncertain or suspected cardiac etiology.


A (9)


12.


Evaluation of acute chest pain with suspected myocardial ischemia in patients with nondiagnostic laboratory markers and ECG and in whom a resting echocardiogram can be performed during pain


A (8)


13.


Evaluation of suspected complication of myocardial ischemia/infarction, including but not limited to acute MR, hypoxemia, abnormal chest X-ray, VSD, free-wall rupture/tamponade, shock, right ventricular involvement, heart failure, or thrombus.


A (9)


14.


Evaluation of respiratory failure with suspected cardiac etiology.


A (8)


Reprinted with permission of the ACCF from Douglas PS, Khandheria B, Stainback RF, et al. ACCF/ASE/ACEP/ASNC/SCAI/SCCT/SCMR 2007 appropriateness criteria for transthoracic and transesophageal echocardiography. J Am Coll Cardiol 2007;50(2):187-204.


With the above hierarchy of functional abnormalities in mind, one can then appreciate the predictable sequence of events that can be detected with echocardiographic imaging in the presence of a coronary stenosis. Experimentally, immediately after coronary artery occlusion, abnormalities in diastolic function occur and can be detected with echocardiographic and Doppler techniques. The easiest and most commonly identified abnormality is abnormal mitral valve inflow, with reduction in E-wave velocity and an increase in A-wave velocity which occurs within seconds of total coronary occlusion (Fig. 16.5). Early diastolic abnormalities are also detectable with strain and strain-rate imaging. There also may be a visibly abnormal relaxation pattern to the wall, mimicking a conduction abnormality. Detailed analysis with Doppler tissue or speckle tracking has demonstrated that, in many instances, this abnormality is the result of postsystolic contraction. This is followed almost immediately by loss of systolic wall thickening and decreased endocardial excursion in the region perfused by the obstructed coronary artery (Figs. 16.6 and 16.7).

If coronary obstruction persists for a threshold period of time (typically ≥4 hours), myocardial necrosis ensues and a
persistent wall motion abnormality develops. If flow is restored before the onset of myocardial necrosis, variable degrees of recovery of function can be expected. In most instances, total occlusion of 4-6 hours results in irreversible myocardial necrosis. Below this threshold, varying degrees of nontransmural necrosis, predominantly involving the subendocardial layers of the myocardium, occur. The severity and extent of wall motion abnormalities depend in part on the amount of transmural versus nontransmural infarction present in a given segment.


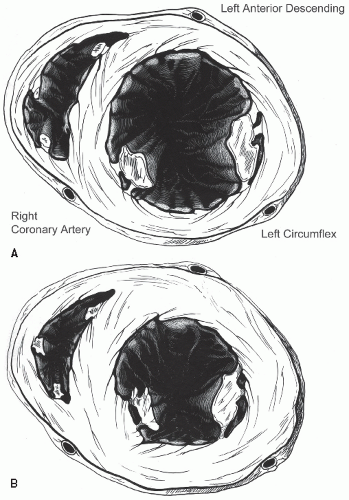
FIGURE 16.1. Anatomic rendering of a short-axis view of the left ventricle in diastole (A) and systole (B). Note the circular geometry of the left ventricle in both diastole and systole and the crescent-shaped geometry of the right ventricle. In the real-time image, note the symmetric wall thickening and inward endocardial excursion.

If a substantial period of ischemia has occurred, as may be seen in transient occlusion of 20 to 60 minutes, recovery of function may not be immediate but delayed due to myocardial stunning. Myocardial stunning is a phenomenon easily demonstrated experimentally and represents persistent wall motion abnormalities after restitution of coronary flow. These abnormalities recover over a variable time period. Typically, with brief occlusions of 5 minutes or less, recovery of function occurs within 60 to 120 seconds. With coronary occlusions of 30 to 60 minutes, there may be a 24- to 72-hour delay in recovery of function. In clinical practice, there is substantial variability in the time course over which myocardial stunning recovers, and recovery of function occasionally may be delayed for weeks. A phenomenon of regional and global diastolic stunning also occurs. This can be demonstrated by Doppler tissue imaging or speckle tracking for strain or strain-rate analysis. A phenomenon of repetitive stunning has also been described. In this scenario, the myocardium is subject to repetitive, brief episodes of ischemia. No single episode of ischemia is sufficient to result in postischemic dysfunction; however, the combined effect of multiple episodes over time may result in prolonged postischemic dysfunction that mimics myocardial hibernation.


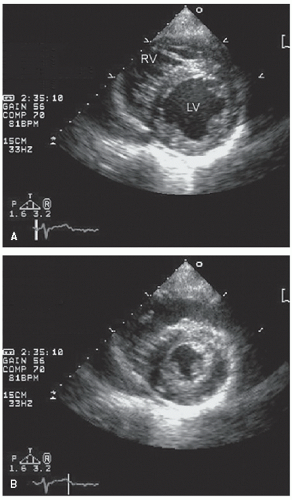
FIGURE 16.2. Parasternal short-axis view of the left ventricle at the papillary muscle level. As with the accompanying schematic (Fig. 16.1), note the circular geometry of the left ventricle and the symmetric endocardial inward motion and wall thickening from diastole (A) to systole (B).

After transmural infarction, a series of events known as remodeling occurs. Over a period of roughly 6 weeks, the necrotic myocardium is replaced by fibrosis and scar, which is thinner and denser than normal myocardium but which has similar tensile strength, rendering it unlikely to rupture (Fig. 16.8). There may be regional dilation in the area of the scar that results in a ventricular aneurysm (Figs. 16.9 and 16.10). An aneurysm is defined as a regional area of akinesis or dyskinesis and scar that has abnormal geometry in both diastole and systole. This is in contrast to a regional wall motion abnormality that has normal geometry in diastole and the distortion occurs exclusively in systole.

On occasion, there can be acute remodeling of an infarct segment that results in expansion of the myocardium in that area. Myocardial expansion occurs typically in the first 48 hours after transmural myocardial infarction and represents acute thinning of the infarcted myocardium. Because expansion occurs acutely, there is no time for scar formation or gradual remodeling, and, as such, the wall in the area of myocardial expansion

consists of relatively thin necrotic myocardium with reduced tensile strength. Myocardial infarct expansion may be heralded by new electrocardiographic changes and pain but without enzymatic evidence of further necrosis. It is the precursor to free-wall rupture, ventricular septal defect, and other mechanical complications of myocardial infarction.


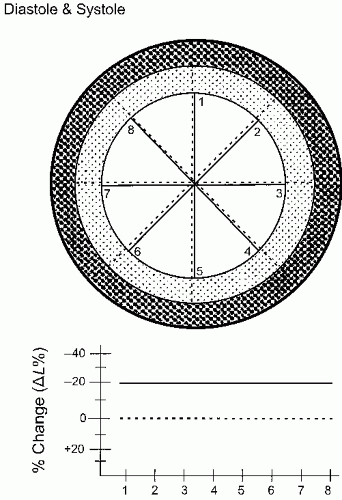
FIGURE 16.3. Schematic diagram of normal endocardial motion. The outer dark circle represents the diastolic thickness of the left ventricle and the inner lighter shaded circle represents the extent of systolic contraction. Eight radians from the center of mass have been drawn for both the diastolic (dashed line) and the systolic (solid line) endocardial boundaries. At bottom, the percentage of change in length from diastole to systole is schematized. The dashed line represents zero change in length and the solid line represents the actual percentage of change in length for the normally contracting ventricle, which, in this example, is a 20% reduction in length.


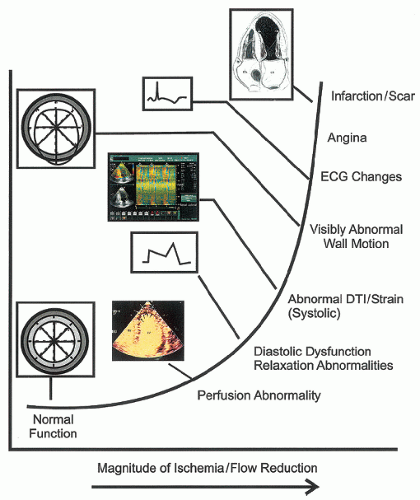
FIGURE 16.4. Demonstration of the ischemic cascade outlining the sequence of events as the magnitude of ischemia or coronary flow reduction progresses from none to severe. DTI, Doppler tissue imaging; ECG, electrocardiogram.


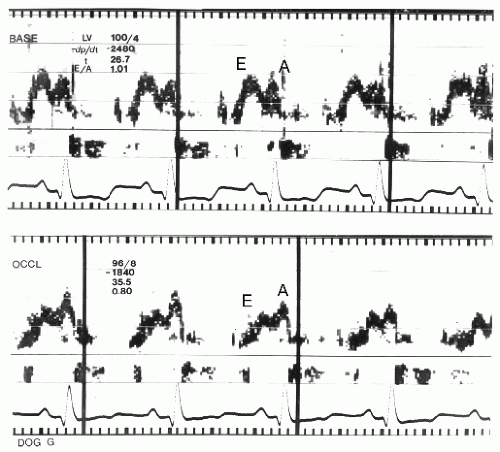
FIGURE 16.5. Pulsed Doppler recording of mitral inflow in a canine model of myocardial ischemia. Top: Note the normal E/A ratio and the reversal of the E/A ratio within seconds of coronary occlusion in the bottom panel.


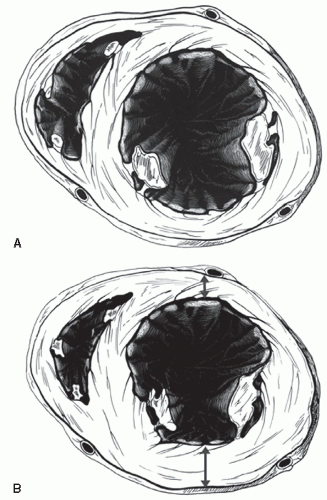
FIGURE 16.6. Anatomic rendering in diastole (A) and systole (B) of ischemia in the distribution of the left anterior descending coronary artery. When comparing diastole and systole, note the lack of thickening in the anterior wall and anterior septum compared with normal hyperdynamic motion in the uninvolved segments.


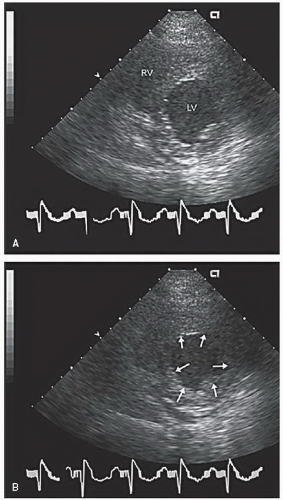
FIGURE 16.7. Parasternal short-axis view recorded in diastole (A) and in systole (B) in a patient with acute left anterior descending coronary artery occlusion and myocardial infarction. B: Note the lack of wall thickening and the dyskinesis of the anterior septum (outwardpointing arrows) and the normal motion of the posterior wall (inward-pointing arrows).


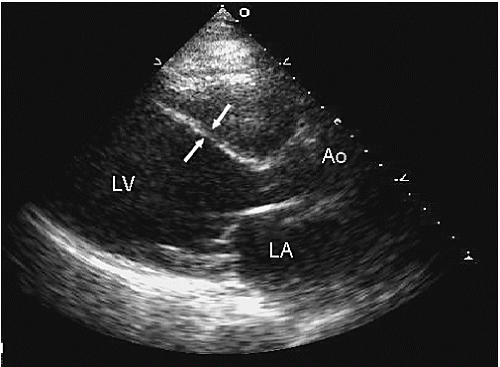
FIGURE 16.8. Parasternal long-axis view recorded in a patient with extensive septal and apical scar related to myocardial infarction. Note the pathologically thin ventricular septum (arrows) and the substantial dilation and remodeling of the left ventricle. In the real-time image, note the relative preservation of wall motion in the posterior wall and akinesis of the septum.


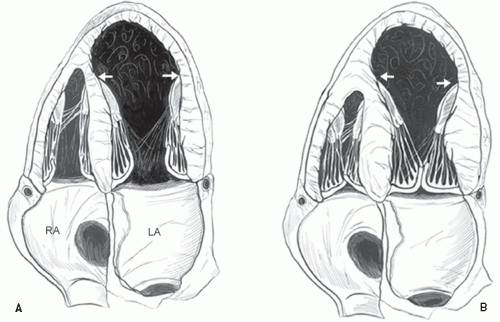
FIGURE 16.9. Anatomic rendering in the fourchamber view depicts a left ventricular apical aneurysm. A: Diastole. B: Systole. Note in diastole the abnormal geometry of the apex with localized apical and septal dilation and the relative thinning of the wall compared with the thickness in the proximal walls. B: The preserved thickening of the proximal walls and a lack of thickening in the aneurysmal segment in all segments distal to the arrows are shown. This abnormal geometry in both diastole and systole with wall thinning is the hallmark of true ventricular aneurysm.

Although the location of a wall motion abnormality is an accurate marker for the site of ischemia or infarction, the size of the wall motion abnormality may either underestimate or overestimate the anatomic extent of ischemia or infarction. This is in large part due to tethering. Myocardial tethering refers to the impact that an abnormal segment has on a normal adjacent border segment. Tethering occurs on both a horizontal and a vertical basis. Horizontal tethering occurs when there is akinesis or dyskinesis of a segment that reduces endocardial excursion in the adjacent normal boundary tissue. The effect of horizontal or lateral tethering is for the extent of a wall motion abnormality to overrepresent the anatomic extent of myocardial necrosis
because the detected wall motion abnormality includes not only the infarcted tissue but also a variable amount of the adjacent nonischemic boundary tissue. Generally, a wall motion abnormality will overestimate the anatomic extent of a myocardial infarction by approximately 15% due to this phenomenon (Fig. 16.11). Conversely, if myocardial ischemia or necrosis involves a very limited region, tethering by the adjacent normal (and frequently hyperdynamic) myocardium may mask the limited region of abnormal wall motion.


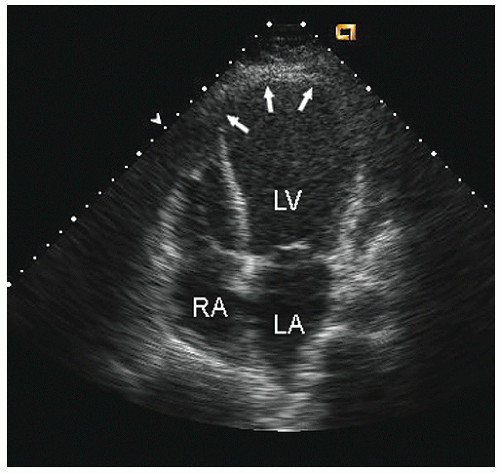
FIGURE 16.10. Apical four-chamber view recorded in a patient with a large apical and septal aneurysm. Note the apical dilation and abnormal geometry in diastole and systole (arrows).

Both the velocity and the magnitude of contraction are greater in the subendocardial than in the subepicardial layers. As such, a contraction abnormality in the subendocardium has a disproportionate impact on overall wall thickening. This phenomenon is known as vertical tethering. Vertical tethering has been demonstrated both experimentally and clinically and has relevance for the determination of myocardial infarction size, based on wall motion abnormalities. In general, ischemia or infarction of the inner 25% of the myocardial wall will result in akinesis or dyskinesis of that segment. As such, nontransmural involvement (either infarction or ischemia) results in malfunction of the entire wall thickness, and thus the wall motion abnormality, as evaluated by standard wall motion analysis, is indistinguishable from that seen with full transmural myocardial infarction or ischemia.


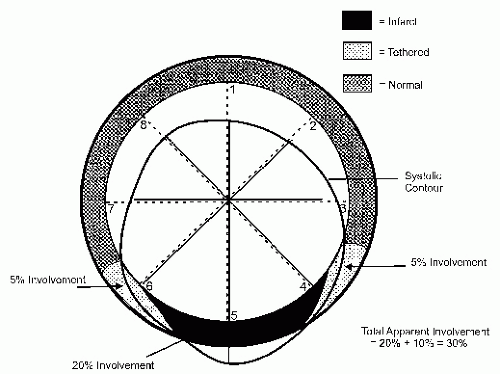
FIGURE 16.11. Schematic representation of horizontal tethering. This diagram represents posterior dyskinesis without translational motion. The true extent of the infarct is as noted in the darkly shaded area encompassing radian 5 and parts of radians 6 and 4. Note that there is a border zone (lightly shaded areas) adjacent to the infarct area that is anatomically normal but has abnormal motion due to the tethering effect of posterior dyskinesis. In the schematic, the true anatomic defect represents 20% of the circumference of the left ventricle, with the tethered border zone giving an apparent total extent of 30%.


Detection and Quantitation of Wall Motion Abnormalities

Regional left ventricular wall motion and global ventricular function can be analyzed and quantified using a number of schemes. These can be classified as purely qualitative, semiquantitative, and quantitative assessments. Table 16.2 outlines many of the schemes that are either commonly used today or have been proposed in the past for evaluation of regional wall motion abnormalities. Although detailed quantitative schemes, which measure regional or global function as a percentage of anticipated normal, may be useful for serial studies and investigational protocols, they are not necessary for clinical diagnosis. A compromise that allows semiquantitation and that can be employed easily is the calculation of a wall motion score which is a unitless number directly proportional to the severity and magnitude of wall motion abnormalities.

M-mode left ventricular measurements provide only limited information on patients with coronary artery disease, largely
because of the regional nature of the wall motion abnormality (Fig. 16.12). The linear minor-axis dimension between the posterior left ventricular endocardium and the septum provides an assessment of systolic function at the base of the heart. A twodimensional area measurement of the short axis at the papillary muscle level and the resultant fractional area change may provide a reasonable global assessment of left ventricular function but shares many of the same limitations as M-mode dimensions.


Table 16.2 Wall Motion Analysis Methods


Regional


Qualitative


“Eyeball” assessment


Normal-hypokinetic-akinetic-dyskinetic


Presence of scar/aneurysm


Semiquantitative


Wall motion score/score index


Quantitative


Fractional shortening


Radial shortening


Cavity/fractional cavity area change


Chordal centerline analysis


Doppler tissue based


Wall velocity


Myocardial displacement


Myocardial gradient


Strain


Strain rate


Ventricular torsion


Global


Ventricular geometry


Short-axis area change


Left ventricular volumes


Diastole


Systole


Ejection fraction


Doppler forward flow (TVILVOT)


Annular displacement (DTI)


Myocardial performance index


Left ventricular dP/dt (from mitral regurgitation)


DTI, Doppler tissue imaging; TVILVOT, Doppler time velocity integral in the left ventricular outflow tract.


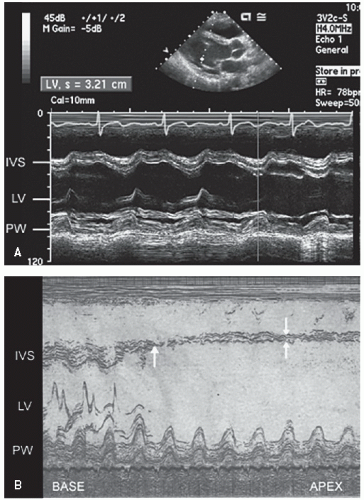
FIGURE 16.12. A: A two-dimensionally guided M-mode echocardiogram through the mid left ventricle in a normal subject. Note the symmetric contraction of both the anterior septum and the posterior wall (PW). B: Recorded in a patient with an anteroseptal myocardial infarction and extensive areas of scar. At the base, the anterior septum has normal contraction but at the level of the mitral valve (upward-pointing arrow), there is an abrupt loss of wall thickness and endocardial motion (rightward arrows) of the anterior septum.

Determination of global ventricular function provides diagnostic and prognostic information in patients with ischemic syndromes. Many of the algorithms for determining global function are discussed in Chapter 6. The most commonly used assessment of left ventricular systolic function is the ejection fraction. As a matter of convenience, many echocardiographic laboratories give an “eyeball” or visually estimated qualitative assessment of the ejection fraction. Although there are data supporting this approach, it is subjective and highly observer dependent. One can measure left ventricular diastolic and systolic volumes, from which ejection fraction is then calculated. The volumes are frequently indexed to body surface area to allow normalization of data for investigational purposes.

The most commonly used method for determination of left ventricular volume is the Simpson rule, or the rule of disks method. For this method, endocardial borders in diastole and systole are outlined. A series of disks of identical height, each of which corresponds to one of multiple, equally spaced, minor-axis dimensions of the ventricle, are generated. The volume of the individual disks is summed to provide a volume (Fig. 16.13). If a regional wall motion abnormality is not visualized in the plane of examination, this technique will overestimate the ejection fraction. For this reason, when dealing with patients with coronary disease in whom regional abnormalities are anticipated, biplane methodology is necessary if precise measurements are required. Because of the regional nature of coronary disease, other methods, such as area length calculations, have had less acceptance in evaluating patients with coronary disease.


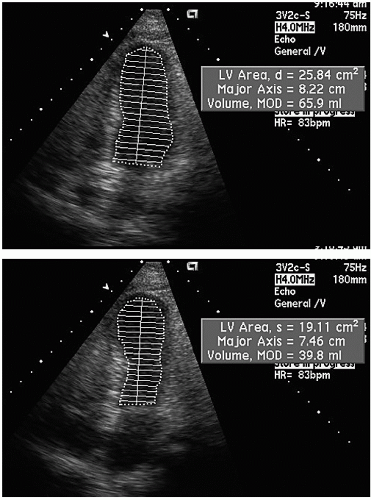
FIGURE 16.13. Apical four-chamber view recorded in a patient with an anteroapical myocardial infarction from which a Simpson rule left ventricular volume is calculated. For both the diastolic and the systolic images, the endocardium has been manually traced and a series of 21 “disks” created each of equal height. From this, a diastolic volume of 65.9 mL, a systolic volume of 39.8 mL, and a left ventricular ejection fraction of 39% are calculated.

Evaluation of regional left ventricular function is substantially more complex. There are multiple schemes for regional wall motion assessment (Table 16.2). The assessment can be undertaken on purely qualitative terms such as an “eyeball” assessment of wall motion as being normal or abnormal or further characterized as hypokinetic, akinetic, or dyskinetic. At the other end of the spectrum, analysis can be undertaken by detailed quantitative schemes in which shortening of multiple endocardial chords around the circumference of the ventricular cavity is calculated. Figure 16.14 schematizes the simplest, quantitative analysis of wall motion using radian shortening and assuming no translational or rotational motion of the heart.

While a number of different detailed, quantitative techniques have been developed and validated in the animal laboratory for quantitation of wall motion abnormalities, the majority of these are not utilized in routine clinical practice. They are limited by the ability to accurately identify endocardial borders and/or myocardial thickening as well as rotational and translational motion and the effects of tethering. As such, while in theory highly accurate for identification of wall motion abnormalities,
they have seen little application in clinical practice. (See Chapter 6 for a more detailed discussion of quantitative techniques.)


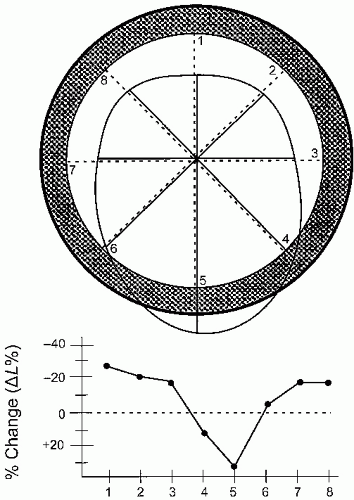
FIGURE 16.14. Schematic demonstrates posterior dyskinesis with no translational or rotational motion. The dark outer circle represents the contour of the ventricle in diastole and the inner circle represents the endocardial contour in systole. Note the maximal area of dyskinesis at segment 5 with less dyskinesis at segment 4 and essential akinesis at segment 6. At bottom, the graph illustrates the change in radian length from diastole to systole. Note the hyperkinesis of the noninvolved segments with increased radian shortening compared with normal contraction in Figure 16.3.

It is important to recognize that normal myocardial motion in systole consists of two closely related events. The first is myocardial thickening during which all layers of the wall contract, resulting in augmentation of the thickness of the myocardium from its normal 8 to 11 mm to 14 to 16 mm. This typically represents a 35% to 40% change in wall thickness. The left ventricular myocardium consists of two layers of myocardial fibers oriented circumferentially around the left ventricle. The contraction of these layers results in both apex to base shortening and circumferential shortening of the left ventricle. The two fiber layers are oriented in opposing directions such that the left ventricle contracts with a wringing motion. When viewed from the apex, the base of the heart rotates clockwise and the apex in a counterclockwise direction. The nature of this wringing motion can be detected with techniques such as Doppler tissue imaging or speckle tracking. While deviation from this normal clockwise-counterclockwise wringing motion has been noted in ischemic heart disease, the incremental benefit of this analysis has not been demonstrated in clinical practice. It should also be pointed out that the apex has limited motion during the ejection and filling phases of the left ventricle. Significant apical motion on an apical view suggests that the transducer is not over the true apex.

Because of the sequence of electrical activation of the heart, not all regions contract at the identical rate or time. In addition to there being substantial temporal and mechanical heterogeneity of contraction in the normal setting, ischemia results in further temporal and mechanical heterogeneity. Although abnormal wall motion is typically described as being akinetic or dyskinetic, detailed analysis of the sequence of contraction often reveals temporal variations of these contraction abnormalities. One such variation is early systolic contraction followed by dyskinetic motion rather than dyskinesis throughout the entire duration of systole. A second is marked delay in onset of contraction but with nearly normal excursion (tardokinesis). The implications of these latter two wall motion abnormalities vary with the clinical setting. Either can be seen as a normal variant, as a manifestation of ischemia, or in the postischemia period. As a general rule, if the wall motion abnormality is very brief (<50 milliseconds), it is more likely to be a normal variant than a manifestation of myocardial ischemia.

An additional qualitative indicator of abnormal ventricular function involves assessment of ventricular geometry. The normal left ventricle is best described as a cylinder with an apical cone resulting in “bullet”-shaped geometry. This bullet-shaped geometry is noted in the apical four- and two-chamber views as well as in the subcostal view. In the short-axis view, normal left ventricular geometry is circular. In the parasternal long-axis view, normal geometry involves a slight concave curvature of both the ventricular septum and the inferoposterior wall, with the direction of concavity for each wall pointing toward the center of the ventricle. Normal geometry is schematized in Figure 16.15 and further illustrated in Figures 16.16 and 16.17. Abnormal geometry is often most apparent in the apical
four-chamber view and may involve rounding of the apex or asymmetry of apical shape as opposed to smooth bulletlike tapering (Fig. 16.18). When evaluating an echocardiogram for an ischemic wall motion abnormality, it is important to quickly assess the left ventricular geometry because it often provides a very rapid clue to the presence of abnormal regional function.


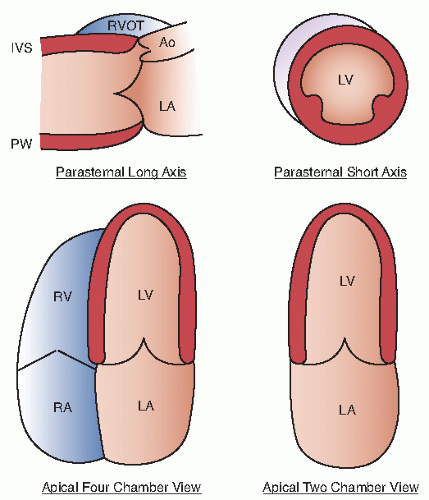
FIGURE 16.15. Schematic representation of normal left ventricular geometry in parasternal and apical views. In the parasternal long-axis view, note the slight concavity of the septum and the posterior wall toward the center of the cavity. Note in the parasternal short-axis view the circular geometry of the left ventricle and the crescent-shaped right ventricle. In the apical views, note the tapering of the apex with the apical segment being thinner than the other walls. In the apical view, the left ventricular geometry has been referred to as bullet shaped or as representing a cone on top of a cylinder.


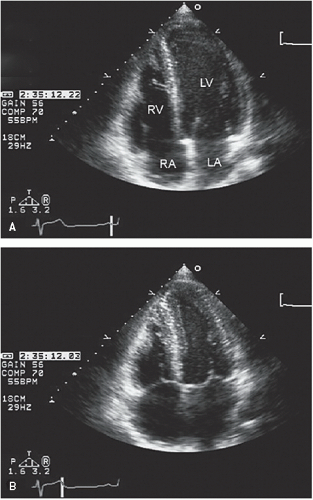
FIGURE 16.16. Apical four-chamber view recorded in a normal ventricle in diastole (A) and systole (B). Note the normal bullet-shaped geometry of the left ventricle that tapers at the apex and the symmetric contraction of all visualized walls. Also note the stable position of the apex in the real-time image, indicating that the transducer is at the true apex.


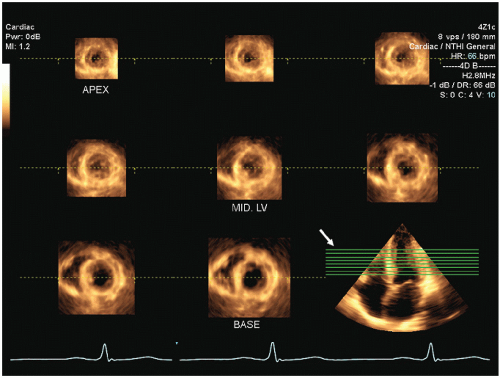
FIGURE 16.17. A series of nine, equally spaced short-axis views of the left ventricle which have been extracted from a single, real-time, three-dimensional volume acquisition. Note the progressive decrease in left ventricle diameter from base to apex. In the real-time image, note the symmetric contraction at each level in this normal patient.

When dealing with coronary disease, it is imperative to adopt a regional approach to the description of wall motion abnormalities, whether that description is a highly detailed quantitative scheme or a simple “eyeball” approach. Figure 16.19 schematizes the standard segments of the left ventricle that are commonly employed for analysis as well as the coronary arteries that usually perfuse those segments. Previous schemes employed a 16-segment model. More recently, a 17-segment approach has been recommended in which the 17th segment represents the true apex. This approach allows a more precise correlation with the segments visualized and analyzed by competing imaging techniques. The new segmentation schematic renames the segments, dropping the term “posterior” (Table 16.3). In general, the anterior septum and anterior wall are perfused by the left anterior descending coronary artery and its branches, and the inferior wall in the area of the posterior interventricular groove by the right coronary artery. Figure 16.19 outlines the most prevalent distribution of coronary arteries to the various segments. There can be substantial overlap in the inferior, lateral, and anterolateral segments, depending on the dominance of the right and left circumflex coronary arteries. The inferoapical segment represents an overlap zone between the distal left anterior descending coronary artery and the distal right coronary artery, and the apical lateral wall represents an overlap between the circumflex and the left anterior descending coronary arteries. This type of scheme that attributes the coronary artery territories to different regions can be superimposed on any of the semiquantitative or quantitative schemes to assist in linking regional wall motion abnormalities to the coronary artery responsible for wall motion abnormality.

The simplest assessment of wall motion consists of description of wall motion as being normal or abnormal, typically further characterized as hypokinetic, akinetic, and dyskinetic in each region of the myocardium. This assessment suffices for the immediate detection of an ischemic event but does not provide information that can be readily communicated with

respect to the size of myocardial infarction or the size of an area in jeopardy.


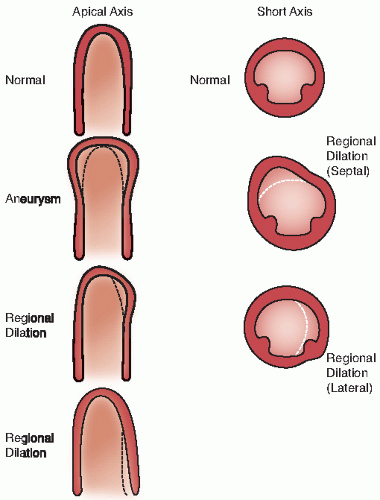
FIGURE 16.18. Schematic representation of normal and abnormal left ventricular geometry shows varying degrees of regional dilation, including a classic apical aneurysm and less typical regional dilation, which also may be a manifestation of myocardial ischemia or infarction. Note that in the schematic depicting lateral wall regional dilation the posterolateral papillary muscle has been laterally displaced as well. This may result in mitral valve malcoaptation and functional mitral regurgitation. In each schematic, the dotted line represents the normal geometry.


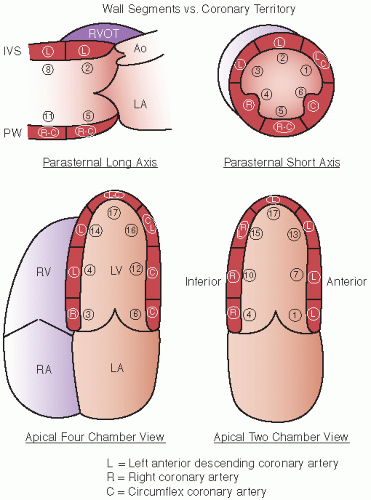
FIGURE 16.19. Schematic representation of the currently recommended 17-segment model of the left ventricle. The parasternal and apical views are depicted. The circled numbers correspond to the current segment numbers recommended by the American Society of Echocardiography (Table 16.3). For each segment, the coronary distribution most likely responsible for the wall motion abnormality in that area is noted. When more than one coronary territory is listed, overlap between coronary distributions is anticipated in that segment. The apex is most often perfused by the left anterior descending coronary artery; however, in the presence of a dominant right coronary artery or circumflex coronary artery, it may also be perfused by that artery.


Table 16.3 Comparison of Current (17 Segment) and Former (16 Segment) Nomenclature for Left Ventricular Segmentation


New Segment No.


New Nomenclature


Views


Old Nomenclature


1


Basal anterior


PSx, 2C


Same


2


Basal anterior septal


PSx, PLAX


Same


Dropped


Basal septal


3


Basal inferior septal


PSx, 4C


½ basal inferior + ½ basal septal


4


Basal inferior


PSx, 2C


½ basal inferior + ½ basal post


Dropped


Basal posterior


5


Basal inferior lateral


PSx, PLAX


Basal lateral


6


Basal anterior lateral


PSx, 4C


Basal lateral


7


Midanterior


PSx, 2C


Same


8


Midanterior septal


PSx, PLAX


Same


9


Midinferior septal


PSx, 4C


½ mid septal + ½ midinferior


Dropped


Midposterior


10


Midinferior


PSx, 2C


½ midinferior + ½ midposterior


11


Midinferior lateral


PSx, PLAX


Midlateral


12


Midanterior lateral


PSx, 4C


Midlateral


13


Apical anterior


2C


Same


14


Apical septal


4C


Same


15


Apical inferior


2C


Same


16


Apical lateral


4C


Same


17


True apex


4C/2C


N/A


4C, apical four-chamber view; N/A, not available; PLAX, parasternal long-axis view; PSx, parasternal short-axis view; 2C, apical two-chamber view.


Table 16.4 Wall Motion Score


Standard Scores


Optional Scores


0


Hyperdynamic


Normal


1


1.5


Mildly hypokinetic


Hypokinetic


2


2.5


Severely hypokinetic


Akinetic


3


Dyskinetic


4


Aneurysm


5


6


Akinetic with scara


7


Dyskinetic with scara


a Descriptive numbers only. The actual numeric value added to the global score is that corresponding to the motion pattern (i.e., 1-5).


The next level of complexity for quantitation of wall motion abnormalities involves generation of a wall motion score or score index. This methodology involves describing the wall motion characteristics of each of the predefined segments as being normal, hypokinetic, akinetic, dyskinetic, or aneurysmal. A numerical score, typically 1 to 5, is then applied to each of these segments (Table 16.4), and the total score is divided by the number of segments evaluated to create a wall motion score index. A ventricle with completely normal wall motion has a wall motion score index of 1.0 (total score divided by the number of segments), with higher scores representing progressively greater degrees of ventricular dysfunction. This global score, representing overall left ventricular wall motion, can then be subdivided into an anterior score, representing the distribution of the left anterior descending coronary artery, and a posterior score, representing the right plus circumflex coronary artery territories. Often, because of the tremendous overlap in the posterior circulation, an effort is not made to separate the independent contribution of the right coronary artery and the circumflex coronary artery. It is often helpful to also calculate the percentage of segments with normal motion. Figure 16.20 presents examples of wall motion score indexes. In Figure 16.20A, note that the global score of 2.375 is made up entirely of a wall motion abnormality in the left anterior descending coronary territory, whereas the posterior territories are normal.


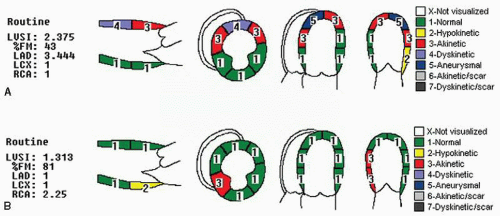
FIGURE 16.20. Wall motion score index recorded in two patients. A: A wall motion score recorded in a patient with extensive anteroapical myocardial infarction. B: A wall motion score from a patient with a more limited inferior wall myocardial infarction. In each instance, note the global left ventricular score index and the ability to separate the score for each of the three major coronary territories.%FM, percent of segments with normal wall motion; LAD, left anterior descending coronary artery; LCX, circumflex coronary artery; LVSI, left ventricular wall motion score index; RCA, right coronary artery.

Additional modifications of the wall motion score index have included an additional descriptive score for scar. Typically, the number assigned for scar is used only for descriptive purposes and the numeric value corresponding to the wall motion abnormality (i.e., 2, 3, or 4) is used for calculation purposes. For example, an akinetic scarred segment will receive a descriptive value of 6, but when calculating the wall motion score index, it is given a value of 3 because it is akinetic. Although allowing for the description of the scar and its extent, it avoids attributing a greater functional deficit to a segment than is actually present.

Other modifications have included using a score of 0 for hyperdynamic. As with the aneurysm score, this allows description of walls with compensatory hyperkinesis; however, it may result in relative underestimation of the deficit attributable to the infarct because the global numeric score now allows the compensatory hyperkinesis to reduce the impact of the wall motion abnormality. By using a score of 1.0 for calculation purposes, the regional wall motion score will remain abnormal even if overall left ventricular function is normal due to compensatory hyperkinesis. Further modifications of a wall motion score scheme have included intermediate scores of 1.5 and 2.5 for mild and severe hypokinesis, respectively, which provide additional quantitative information when evaluating patients during cardiovascular stress or in following recovery of function after myocardial infarction.


Role of the Three-dimensional Echocardiography

Three-dimensional echocardiography potentially provides an incremental method for evaluating left ventricular wall motion and extraction of detailed parameters of left ventricular function. One clinically relevant application of three-dimensional echocardiography relies on an automated or semiautomated extraction of the left ventricular border from which a “shell” model of the left ventricular volume can be created (Fig. 16.21). Carefully done clinical studies have demonstrated the superiority of left ventricular volumes determined from three-dimensional echocardiography with respect to absolute accuracy and reproducibility. The three-dimensional volume can be automatically divided into subvolumes corresponding to either a 16- or a 17- segment model of regional wall motion, analogous to that used
for generation of a wall motion score. In theory, this method for analysis of regional ventricle function should provide information equivalent to that from visual analysis of left ventricular wall motion. In reality, technical parameters, such as dropout of the endocardial border and deficiencies in the algorithms used to identify precise boundaries, may reduce the actual impact of this technology in clinical practice. Multiple two-dimensional image planes can be extracted from a threedimensional data set allowing simultaneous visualization of a wall motion abnormality from two or more imaging perspectives (Figs. 16.17 and 16.22). While technically feasible, realtime or reconstructed images from three-dimensional data sets remain limited by frame rate, and image quality generally is not equivalent to that obtained from dedicated two-dimensional transducers.


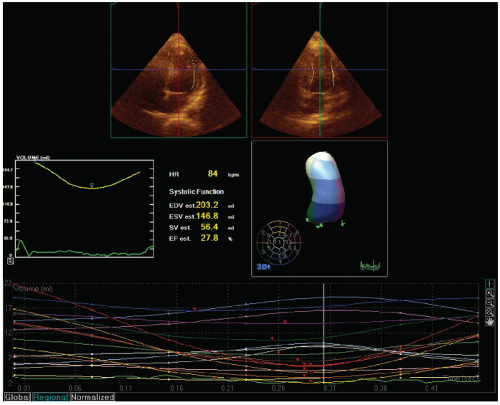
FIGURE 16.21. Left ventricular volume depicted as a three-dimensional shell from a real-time, threedimensional volumetric acquisition. Semiautomated methodology has been utilized to define the endocardial border and create the left ventricular volume which is subsequently divided into subsegments for analysis. The volume change in each segment can be tracked as an additional measure of regional wall motion analysis. In this example, note the dyskinesis of the apical segments. EDV, end diastolic volume; EF, ejection fraction; ESV, end systolic volume; HR, heart rate; SV, stroke volume.


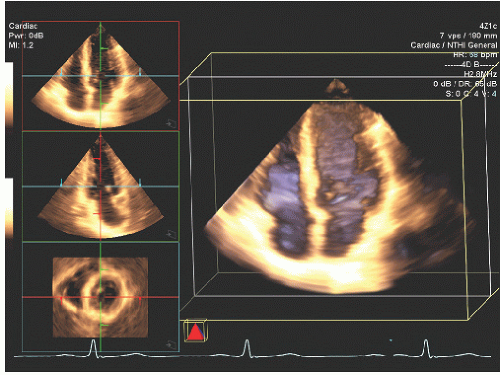
FIGURE 16.22. Multiple two-dimensional imaging planes have been extracted from a single, three-dimensional volume allowing simultaneous visualization of wall motion in an apical four-chamber, apical long-axis, and short-axis view of the left ventricle for simultaneous assessment for regional wall motion abnormalities in multiple orthogonal planes.


Doppler Tissue Imaging and Speckle Tracking

The most recent approach to analysis of regional wall motion has been with either Doppler tissue imaging or “speckle” tissue tracking. These highly sophisticated techniques allow tracking of wall motion in one or more regions of interest, or along a predefined length of the myocardium, from which myocardial deformation can be determined. In its simplest form, this provides analysis of the velocity of myocardial motion at a single point from which displacement can be calculated. At the next step of complexity two adjacent points can be compared for their location and velocity. From this comparison, strain, representing the degree to which the two regions of interest either move toward or away from each other (Fig. 16.23), or strain rate, representing the velocity of the change in length of the predefined segment, can be determined. Experimental data suggest that both strain and strain-rate imaging are more sensitive and earlier markers of myocardial dysfunction than is visual analysis of wall motion.

The basic techniques for determining strain and strain rate were discussed in Chapter 3 and further in Chapter 6 dealing with evaluation of left ventricular function. From a clinical perspective, the clinician should be cognizant of the fact that the algorithms for determining strain and strain rate are highly technique dependent and absolute values of normal vary with location in the myocardium and from patient to patient, making analysis of a subtle deviation from “normal” at any single timepoint problematic. Scrupulous attention to detail is essential with respect to placement of regions of interest to provide data equivalent to that seen in the experimental setting. In view of the complexities of obtaining noise-free strain and (especially) strain-rate signals, this technique is infrequently employed in routine clinical practice. It has shown some promise in stress echocardiography where serial changes are tracked in predefined regions in a given patient. As discussed earlier, the normal wringing contraction motion of the left ventricle is related to the opposing direction of contraction of endocardial and epicardial fibers. Selective ischemia of one layer (typically the endocardial) will alter the normal ventricular torsion and may be a specific marker of selective subendocardial ischemia.


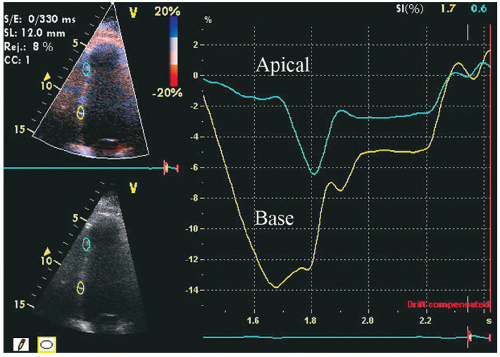
FIGURE 16.23. Doppler tissue-based strain imaging recorded in a patient with an apical myocardial infarction. Basal and midseptal regions of interest have been analyzed for strain imaging. Note the normal strain pattern in the basal septum and the substantially delayed contraction and pathologically reduced strain at the border zone of the apical myocardial infarction.


Other Methods for Evaluating Ischemic Myocardium

There are several other technologies that can be brought to bear in evaluating patients with acute ischemic syndromes. Tissue characterization has shown promise for providing incremental information regarding myocardial contractility. This technique relies on evaluating the cyclic variation in backscatter (returning signals from the myocardium). In the absence of myocardial ischemia, the overall intensity of returning signals within the myocardium varies phasically with the cardiac cycle. The presence of even mild myocardial ischemia results in a reduction in this cyclic variation of intensity.

Contrast echocardiography using new perfluorocarbon- or nitrogen-based agents has shown promise for evaluating the integrity of capillary level flow in the myocardium. Myocardial contrast echocardiography can be used for detection of coronary stenosis. Demonstration of preserved microvascular perfusion with myocardial contrast echocardiography has correlated with myocardial viability and subsequent recovery of function in both experimental and clinical myocardial infarction. This topic was discussed in Chapter 4.


Echocardiographic Evaluation of Clinical Syndromes


Angina Pectoris

Resting echocardiography has a limited role in evaluation of patients with stable exertional angina. For patients with transient exertional chest pain, stress echocardiography can play an instrumental role in establishing the diagnosis of occult coronary artery disease. This is discussed in Chapter 17. For patients with angina pectoris, a resting echocardiogram occasionally provides confirmatory information. In rare instances, a patient may experience an episode of spontaneous chest pain while imaging is taking place or in a situation in which imaging can be undertaken immediately. If this fortuitous timing occurs, detection of a regional wall motion abnormality during or shortly following an episode of pain is excellent evidence that the pain is due to myocardial ischemia. The specificity of this observation is obviously greatest if the wall motion abnormality is transient and resolves simultaneously with resolution of chest pain or electrocardiographic changes.

Similarly, in a patient with a history of chest pain and a moderate or high likelihood of underlying coronary disease, detection of a resting wall motion abnormality provides circumstantial evidence that underlying coronary artery disease is present. Some studies have suggested that as many as 40% of patients with chronic coronary artery disease, but without documented myocardial infarction, have regional wall motion abnormalities on a resting echocardiogram. The potential mechanisms are repetitive stunning due to recurrent ischemia, myocardial hibernation in the presence of severe coronary stenosis, or clinically unrecognized previous nontransmural infarction. Detection of a resting regional wall motion abnormality in a patient with clinical suspicion of coronary disease is evidence that significant underlying coronary artery disease is present.

Conversely, by detecting other forms of organic heart disease, echocardiography can play an exclusionary role in evaluating patients with chest pain. When the resting echocardiogram reveals evidence of severe valvular heart disease such as aortic stenosis or of other diseases such as pulmonary hypertension, dilated or hypertrophic cardiomyopathy, this may provide a definitive diagnosis and a plausible explanation for the presenting symptoms. In this instance, the echocardiogram is used to establish an alternative diagnosis, and coronary artery disease may become a less likely alternative.


Acute Myocardial Infarction

Urgent transthoracic two-dimensional echocardiography can play a crucial role in establishing the diagnosis of acute myocardial infarction and determining its location, extent, and prognosis. As noted in the previous sections on pathophysiology and evaluation of wall motion abnormalities, a regional wall motion abnormality is the echocardiographic hallmark of an acute ischemic syndrome. In the presence of chest pain with electrocardiographic changes, detection of a regional wall motion
abnormality is direct evidence of myocardial ischemia, and the extent of the wall motion abnormality is directly related to the volume of myocardium in jeopardy. On the basis of the fundamentals previously noted, including the disproportionate impact of subendocardial ischemia, one should appreciate the independence of the wall motion abnormality from electrocardiographic changes, as wall motion abnormalities may be seen in the absence of ST-segment elevation or Q-wave infarct.

Classic inferior myocardial infarction with ST-segment elevation and/or Q waves in electrocardiographic leads II, III, and AVF typically involves segments bordering the posterior interventricular groove with variable amounts of involvement of the inferoposterior wall. Classic anterior and anterolateral myocardial infarction with ST-segment elevation and/or Q-waves in the anterior precordial leads involves the anterior septum, anterior wall, and apex. Circumflex coronary artery occlusion presents with variable electrocardiographic changes, most often presenting as an inferior myocardial infarction or with exaggerated R-waves in the anterior precordium. The location of wall motion abnormalities in this instance is predominantly in the inferior, posterior, and posterolateral walls. Apical involvement on echocardiography can be seen in any of the classic electrocardiographic distributions of myocardial infarction and is not limited to the anterior infarct pattern. As such, detection of an apical abnormality in the presence of an inferior or posterolateral wall motion abnormality does not necessarily imply multivessel coronary disease or concurrent anterior myocardial infarction but rather can be the effect of a single posterior dominant coronary territory. Figures 16.24, 16.25, 16.26, 16.27, 16.28, 16.29, 16.30 and 16.31 were recorded in patients presenting with classic ST-segment elevation or Q-wave myocardial infarction. The image in Figure 16.32 was recorded in two patients with remote myocardial infarction and reveals variable degrees of wall thinning and scar formation.


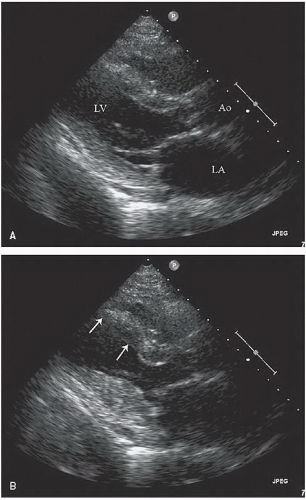
FIGURE 16.24. Parasternal long-axis echocardiogram recorded in a patient with extensive anteroapical and anterior wall myocardial infarction. Figures 16.24, 16.25 and 16.26 were recorded in the same patient. Note the normal geometry of the left ventricle in diastole (A). B: In systole, note the normal motion of the proximal inferior wall and a lack of thickening and akinesis of the entire anterior septum (arrows).

There are several nonischemic cases of abnormal wall motion which may complicate analysis. Left bundle branch block, either antecedent or occurring as a complication of myocardial infarction, confounds wall motion analysis. There are several guidelines that one can use to separate the bundle branch block wall motion abnormality from ischemia or myocardial infarction. These are listed in Table 16.5. In general, wall motion abnormalities due exclusively to left bundle branch block are most prominent in the proximal and mid-anterior septum and less obvious in the anterior wall or apex. They typically do not result in alteration of left ventricular geometry or regional dilation. By using M-mode echocardiography, or by careful attention to frame-by-frame analysis of two-dimensional echocardiography, wall thickening can be seen to be preserved


and there is often multiphasic motion of the septum (Fig. 16.33). M-mode echocardiography is the more definitive method for demonstrating the mechanical effects of the left bundle branch block. With this technique, a classic early downward “beak” is noted with the onset of ventricular depolarization followed by concurrent anterior motion of the septum and myocardial thickening. In contrast, an ischemic abnormality in the left anterior descending territory results in loss of systolic thickening of the myocardium in the ventricular septum and wall motion abnormalities that often extend to the anterior wall and apex. These are not infrequently associated with abnormal geometry of the left ventricular cavity. Finally, because the wall motion in left bundle branch block is due to conduction delay, there is often marked dyssynchrony between the onset of motion (normal and abnormal) in the noninvolved walls compared with the normal time for onset of motion. These guidelines suffice for separation of ischemic from nonischemic abnormalities in the presence of a left bundle branch block in the majority of patients. It should be emphasized that there are numerous exceptions to these guidelines, and the accuracy for detecting ischemia in the presence of a left bundle branch block is diminished compared to that seen for the other coronary territories, even for the most experienced echocardiographer.


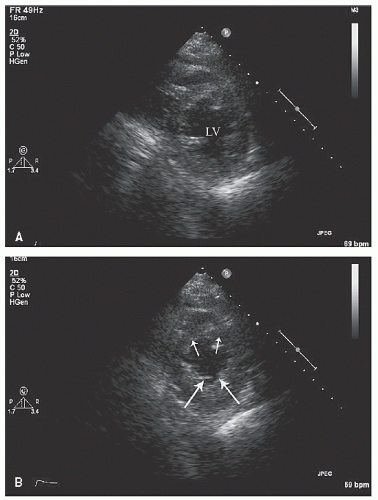
FIGURE 16.25. Parasternal short-axis view recorded in the same patient depicted in Figure 16.24. Note preserved circular geometry of the left ventricle in diastole (A) and the normal myocardial thickening and endocardial excursion of the posterior wall. B: Recorded in systole, the anterior and midseptum are both full thickness but dyskinetic (arrows).


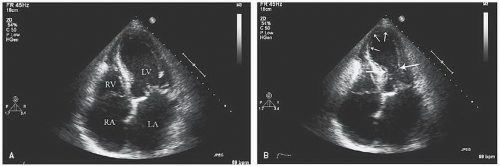
FIGURE 16.26. Apical four-chamber view recorded in the same patient depicted in Figures 16.24 and 16.25. A: Recorded in diastole, note the relatively normal left ventricle geometry and biatrial enlargement, evidence of long-standing hypertensive cardiovascular disease. B: In the systolic panel, note the normal motion at the base of the heart (larger arrows) including the ventricular septum and lateral wall and dyskinetic and apical segments (arrows).


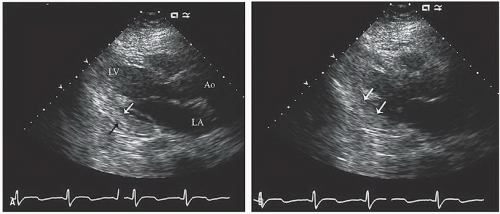
FIGURE 16.27. Parasternal long-axis view recorded in a patient with an acute interolateral wall myocardial infarction. In the diastolic (A) panel note the full thickness of the interolateral wall. In the systolic (B) frame, note the normal motion of the ventricular septum and the dyskinesis of the full-thickness interolateral wall. These wall motion characteristics are better appreciated in the real-time image.


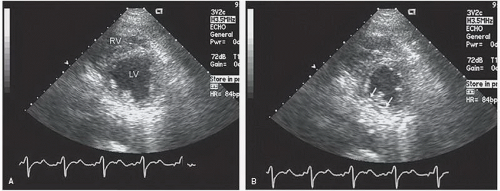
FIGURE 16.28. Parasternal short-axis view recorded in a patient with an inferior wall myocardial infarction. A: Recorded in diastole. Note the normal shape of the left ventricle in diastole. In systole (B), the true inferior wall is thin and frankly dyskinetic (arrows), whereas the remaining walls contract normally.


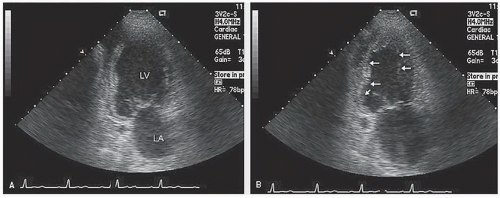
FIGURE 16.29. Apical two-chamber view recorded in diastole (A) and systole (B) in a patient with an inferior myocardial infarction. In systole (B), note the normal motion of the anterior wall and the frank dyskinesis of the proximal two thirds of the inferior wall (arrows).


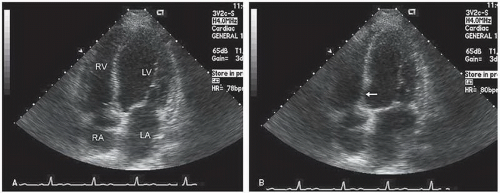
FIGURE 16.30. Apical four-chamber view recorded in the same patient depicted in Figure 16.29 in diastole (A) and systole (B). Note the dyskinesis of the proximal 25% of the ventricular septum, which in this instance is attributable to septal involvement by the inferior myocardial infarction. Caution is advised when interpreting a wall motion abnormality in this location. The proximal ventricular septum in the apical four-chamber view often has abnormal motion. Only when the abnormality is seen in association with concurrent inferior wall myocardial infarction should it be presumed to be infarct as well.

Only gold members can continue reading. Log In or Register to continue

Stay updated, free articles. Join our Telegram channel

Jun 22, 2016 | Posted by in CARDIOLOGY | Comments Off on Echocardiography and Coronary Artery Disease

Full access? Get Clinical Tree

Get Clinical Tree app for offline access