Vascular Imaging and Tonometry
A. Rauoof Malik
Iftikhar J. Kullo
Currently, the cardiovascular risk of a person is assessed with conventional risk factors and risk factor algorithms. However, the predictive value of these algorithms for coronary heart disease events is less than satisfactory (1,2). Cardiac stress testing detects only lesions that produce significant flow limitation, and coronary angiography is limited because it is invasive. Furthermore, these tests are not suitable for asymptomatic persons, the main target of primary prevention. Noninvasive arterial testing potentially may be a valuable adjunct to conventional cardiovascular risk assessment by allowing early detection of the structural and functional changes that precede cardiovascular events such as myocardial infarction.
Of the several modalities for noninvasive testing of arterial function and structure, vascular ultrasonography and tonometry are particularly appealing because they are safe and reproducible. High-resolution ultrasonography can be used to assess the vasodilator response to physical or pharmacologic stimuli in a peripheral artery and to examine the arterial wall directly for early atherosclerotic changes that precede luminal compromise. Arterial tonometry, which involves noninvasive acquisition of arterial waveforms with a high-fidelity manometer, can be used to measure indices of arterial stiffness and wave reflection.
Brachial Artery Reactivity Testing
Brachial artery reactivity (BAR) testing was developed as a noninvasive tool for assessing endothelial function (3). Other arterial sites have been used for vasoreactivity testing, but the brachial artery is commonly used because of its ease of access. Endothelial dysfunction is likely a systemic disorder, and BAR may be a surrogate for coronary endothelial function (4). Endothelial dysfunction precedes the development of atherosclerotic plaque and is characterized by reduced bioavailability of the endothelium-derived vasodilator, nitric oxide. BAR testing consists of measuring 1) the reactive hyperemic flow after a brief period of arterial occlusion and 2) the flow-mediated dilatation (FMD) of the brachial artery in response to hyperemia. Both measures are considered, at least in part, to be endothelium-dependent responses, with FMD reflecting conduit artery endothelial function and reactive hyperemia reflecting microvascular endothelial function.
BAR studies generally are performed with standard echo-Doppler equipment that has a high-frequency (7.0–13.0 MHz) ultrasound scanning transducer (5) (Fig. 22-1 and 22-2). Ideally, the test should be performed in the morning after the subject has fasted overnight and has not taken any vasoactive drugs for 12 to 24 hours. The test generally is well tolerated, although arterial occlusion may cause a transient slight discomfort. Forearm ischemia is induced by occlusion in either the upper arm or forearm. Although upper arm occlusion produces a greater degree of reactive hyperemia, there is concern that it may be associated with ischemia of the wall of the brachial artery (6). Changes in brachial artery diameter may be measured manually with calipers or edge detection software.
Generally, the measurement of reactive hyperemia and FMD is followed by an assessment of vasodilatation to nitroglycerin (nitroglycerin-mediated dilatation [NMD], considered an endothelium-independent response). After the release of cuff occlusion, a period of 10 to 20 minutes is allowed for the brachial artery to return to its basal state. NMD is assessed as the percentage increase in diameter 3 to 5 minutes after the administration of 0.4 mg sublingual
nitroglycerin. This drug should not be administered to patients who take phosphodiesterase-5 inhibitors for sexual dysfunction or who have a history of hypersensitivity to nitrates.
nitroglycerin. This drug should not be administered to patients who take phosphodiesterase-5 inhibitors for sexual dysfunction or who have a history of hypersensitivity to nitrates.
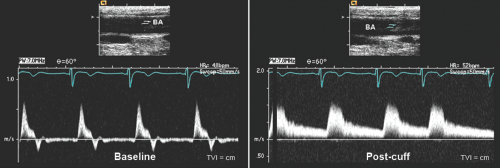 Figure 22-1 Measurement of reactive hyperemia during brachial artery reactivity testing. Pulsed Doppler interrogation of the brachial artery (BA) is performed using a Doppler angle of 60 to 70 degrees and range gate in the center of the lumen. An average of 2 or 3 time velocity integrals (TVI) is determined at baseline (A) and immediately after the release of cuff occlusion (B), and BA blood flow is calculated as: Flow (mL/min) = TVI (cm) × CSA × heart rate (per min) where CSA is the cross-sectional area of BA (0.785 × BA diameter2). Reactive hyperemia is calculated as the ratio of maximal flow during the first 15 seconds after cuff release (Flowmax) to the baseline flow (Flowmax/Flowbasal) or as the fractional increase in flow [(Flowmax – Flowbasal)/Flowbasal]. |
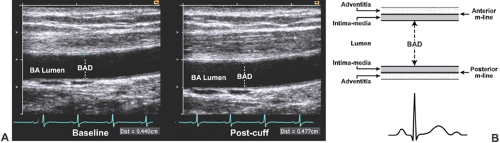 Figure 22-2 Measurement of flow-mediated dilatation during brachial artery reactivity (BAR) testing. A 3- to 5-cm longitudinal segment of the brachial artery (BA) is scanned 4 to 10 cm above the antecubital fossa to obtain continuous two-dimensional images of the artery with depth and gain settings adjusted using a resolution box function to optimize the vessel wall-lumen interface. Electronic calipers are used to measure BA diameter (BAD) as the distance from the intima-lumen interface or the m-line (media-adventitia interface) at the anterior wall of BA to the intima-lumen interface or m-line at the posterior wall of BA. BAD measurements are made at baseline (BADbasal) and during a period of increased shear stress produced by hyperemia in response to transient occlusion of arterial flow. The peak blood flow response is achieved immediately after release of cuff occlusion, whereas the maximal increase in BAD (BADmax) generally occurs between 45 and 90 seconds after release. Images can be recorded on a videotape or computer disk for subsequent off-line analysis. Maintaining the transducer position and system settings constant throughout the procedure is paramount. A: Longitudinal B-mode ultrasonographic image of BA at the level of the elbow at baseline (left) and after release of cuff occlusion (right) during BAR testing. A blood pressure (pediatric) cuff is attached to the limb well beyond the scanning site and inflated to suprasystolic pressure (200 mm Hg) for 5 minutes, at which time it is suddenly deflated. B: BAD is measured at end-diastole coincident with the R wave of a simultaneously recorded ECG. An average of at least three diameter measurements should be taken. Flow-mediated dilatation is calculated as BADmax at 45 to 90 seconds after release of cuff occlusion and expressed as the fractional increase [(BADmax – BADbasal)/BADbasal] from BADbasal |
Some, but not all, studies have noted abnormalities in reactive hyperemia, FMD, and NMD in asymptomatic subjects with risk factors for coronary heart disease and in patients with angiographically documented coronary heart disease. Several studies have shown that brachial FMD is an independent predictor of adverse cardiovascular events in high-risk subjects (7,8,9). BAR testing may provide incremental information about risk for coronary heart disease, but additional prospective research and standardization of measurement technique across laboratories are needed. Published guidelines for BAR testing recommend that at least 100 scans should be performed and interpreted under supervision before BAR testing is conducted independently and a minimum of 100 procedures should be performed annually to maintain competency (5).
Carotid Intima-Media Thickness
Intimal thickening of the carotid artery is considered a marker of systemic atherosclerosis. Because of the difficulty in measuring intimal thickness alone by ultrasonography, the combined intima-media thickness (IMT) is measured. Because the carotid artery is an elastic artery and its media is not particularly thick, carotid IMT represents mainly intimal thickening. The extracranial carotid arteries are preferred for study because of their size and superficial location (Fig. 22-3).
Methodologic differences exist among various laboratories about the arterial segment or segments examined, the wall (near, far, or both) measured, and the measurements reported (mean, maximal, or average of maximal values). Generally, a composite of several measurements is used (10,11) (Fig. 22-4). IMT images can be stored on videotape or in digital format for later off-line analysis. This has the advantage of separating data acquisition from data interpretation, making the examination of patients more efficient. However, on-line analysis optimizes imaging without pixel loss and eliminates the need for a storage system, making the test time- and resource-efficient. Serial measurements may provide more prognostic information than a single measurement and also may be useful in assessing the effect of an intervention. The use of external reference points or appropriate software may improve identification of the common carotid artery sector for repeat measurements.
Recent advances in the measurement of carotid IMT include the use of ultrasonographic contrast agents, tissue harmonic imaging, and automated edge-tracking. Echo-contrast enhancement may improve the delineation of the intima-lumen interface, especially at the arterial near wall. Tissue harmonic sonographic imaging improves signal-to-noise ratio and spatial resolution, and the use of automated computerized edge-tracking methods may decrease variability by obviating the need for manual measurement with calipers (13,14).
 Figure 22-3 Measurement of the carotid intima-media thickness. For the examination, the patient is supine, with the neck extended slightly and the head directed away from the side of the examination. Longitudinal two-dimensional images of the carotid arteries are obtained in the anterior, lateral, and posterior planes. Multiple measurements are taken from the distal 1 cm of the common carotid artery (CCA), from the adjoining carotid bulb, and from the proximal 1 cm of the internal carotid artery (ICA), on both the right and left sides. ECA, external carotid artery. |
IMT must be differentiated from atherosclerotic plaque, which typically is seen as a focal widening, often with mineralization and protrusion into the lumen. If a plaque is located at the site IMT is measured, plaque thickness is included in the IMT value. However, some investigators restrict the measurement of IMT to plaque-free arterial segments or they analyze plaques separately. Alternatively, to indicate the increasing severity of atherosclerosis, arterial wall thickness can be graded as normal, intima-media thickening, nonstenotic plaque or stenotic plaque (15).
Stay updated, free articles. Join our Telegram channel

Full access? Get Clinical Tree


