Prosthetic Valve Evaluation
Valve replacement usually is required for severe valvular heart disease, although valve repair increasingly is performed for a regurgitant lesion. No prosthetic valve is perfect, and a substantial portion of cardiology practice is dedicated to following patients who have a prosthetic valve and to evaluating prosthetic valve dysfunction when patients present with cardiovascular symptoms. Prosthetic valves can be classified as either tissue or mechanical valves (Fig. 13-1). A tissue prosthesis is an actual valve or one made of biologic tissue from an animal (bioprosthesis or heterograft) or human (homograft or allograft) source. A mechanical valve is made of a nonbiologic material (e.g., pyrolitic carbon, polymeric silicone substances [Silastic], or titanium), as in a ball-cage (Starr-Edwards) or disk (St. Jude Medical or Medtronic) valve. Blood flow characteristics, hemodynamics, durability, and thromboembolic tendency vary depending on the type and size of each prosthesis and, more importantly, on the characteristics of the patient.
The physical examination of patients with a prosthetic valve is different from that of those with native valves because prosthetic valves are inherently stenotic and may produce additional prosthetic sounds (caused by ball movement or disk closure). Therefore, it can be challenging clinically to distinguish between abnormal and normal prosthetic valve sounds. The evaluation of prosthetic valves requires a thorough knowledge of the unique makeup and hemodynamic profiles of the different prostheses. Dysfunction of a native valve is usually suspected on the basis of abnormal findings on two-dimensional (2D) echocardiography, but it is more difficult to identify an abnormality of a prosthetic valve with 2D transthoracic echocardiography (TTE) alone. At Mayo Clinic, we rely more on Doppler and color flow imaging as well as on transesophageal echocardiography (TEE) to detect dysfunction of prosthetic valves.
Two-Dimensional Echocardiography
Two-dimensional echocardiography can identify gross structural abnormalities of a prosthesis, such as dehiscence, vegetation, thrombus, or degeneration of a tissue prosthesis, but its sensitivity for cardiac prosthetic dysfunction is hampered by the difficulty with visualizing structures around and behind the cardiac prosthesis. Echo reflectance of the prosthetic material, attenuation of the ultrasound beam, and multiple ultrasound reverberations from the prosthesis cause difficulties in interpretation. Normally, it is easier to image a tissue prosthesis than a mechanical one. To identify the structural abnormalities associated with a prosthesis, it is important to understand the characteristics of the prosthesis and the surgical technique (Fig. 13-2).
Doppler and Color Flow Imaging
Doppler echocardiography reliably detects flow velocity across a prosthetic valve, thus allowing pressure gradients to be determined with the use of the modified Bernoulli equation (Pressure gradient = 4 × Velocity2). An excellent correlation has been shown between Doppler and invasive dual-catheter pressure measurements made simultaneously across various prosthetic valves (1) (Fig. 13-3); however, several invitro models of a normal disk prosthesis have demonstrated an overestimation of aortic prosthetic gradients determined with Doppler velocities compared with catheter-derived gradients (2,3). The highest catheter-derived gradient was found within the central orifice of the St. Jude Medical prosthesis, and it decreased rapidly when the catheter was moved downstream (pressure recovery
phenomenon). The discrepancy is smaller in a prosthesis with a larger ring and in a tissue prosthesis. The potential source of difference between Doppler-derived and catheter-derived prosthetic pressure gradients should be considered, but it has not been a major problem in the evaluation of a dysfunctional prosthesis.
phenomenon). The discrepancy is smaller in a prosthesis with a larger ring and in a tissue prosthesis. The potential source of difference between Doppler-derived and catheter-derived prosthetic pressure gradients should be considered, but it has not been a major problem in the evaluation of a dysfunctional prosthesis.
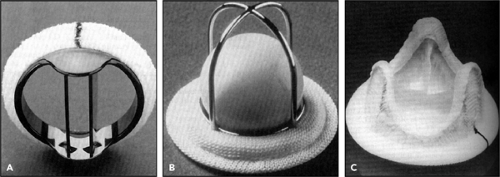 Figure 13-1 Three popular types of valve prostheses. A: Bileaflet St. Jude Medical prosthesis in fully opened position (there are two major lateral flow orifices and one minor central orifice). B: Starr-Edwards prosthesis (model 6120). C: Porcine heterograft (frame-mounted glutaraldehyde-preserved). (From Schaff HV. Prosthetic valves. In: Giuliani ER, Gersh BJ, McGoon MD, et al, eds. Mayo Clinic Practice of Cardiology, 3rd ed. St. Louis: Mosby, 1996:1484–1496 . Used with permission of Mayo Foundation for Medical Education and Research.) |
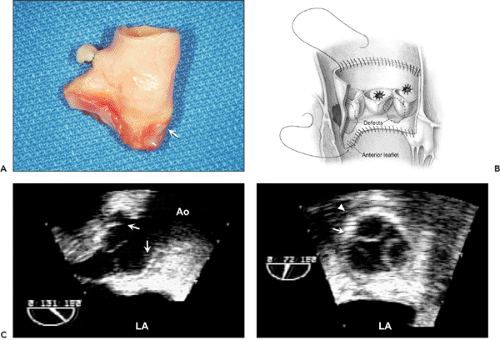 Figure 13-2 A: An aortic homograft specimen. Arrow, area of aortic anulus. A portion of the coronary artery has a tie around it. B: Diagram of the surgical technique for placement of an aortic homograft. Both the proximal and distal portions of the homograft are sutured to the native aorta, providing a potential space between the two structures. The allograft aortic valve is used as an intra-aortic cylinder. In this diagram, the allograft anterior mitral leaflet is used to repair the defects created by endocarditis. C: Transesophageal echocardiographic appearance of a normal aortic homograft. Left, Longitudinal view (131 degrees). Right, Short-axis view (72 degrees). This has a cylinder-in-cylinder appearance because of insertion of the homograft (arrows, left and right) within the patient’s aortic root (arrowhead). Ao, aorta; LA, left atrium. (B From Dearani JA, Orszulak TA, Schaff HV, et al. Results of allograft aortic valve replacement for complex endocarditis. Journal of Thoracic and Cardiovascular Surgery, 1997;113:285–291 . Used with permission of Mayo Foundation for Medical Education and Research.) |
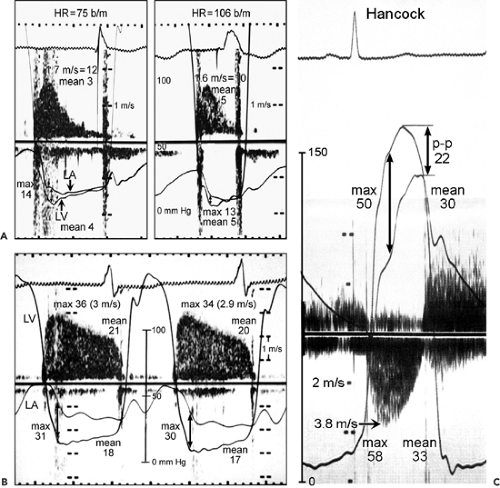 Figure 13-3 A: Simultaneous Doppler and catheterization study of a normal mechanical mitral prosthesis. The correlation between the two techniques at different heart rates (HR) is good. b/m, beats per minute; LA, left atrium; LV, left ventricle. B: Simultaneous continuous wave Doppler and catheter pressure measurements (LV and LA) in a patient with an obstructed Hancock mitral prosthesis. The maximal (36 vs. 31 mm Hg, by Doppler and catheter, respectively) and mean (21 vs. 18 mm Hg) gradients derived from these two techniques correlate well. C: Simultaneous Doppler and catheterization study in a patient with a Hancock aortic prosthesis. The correlation between Doppler-derived and catheter-derived maximal (58 vs. 50 mm Hg) and mean (33 vs. 30 mm Hg) pressure gradients is good. A good correlation was noted also for the mechanical aortic prosthesis. Note that the peak-to-peak (p-p) gradient, which is a nonphysiologic assessment, underestimates the severity of obstruction (p-p gradient, 22 mm Hg; catheter-derived mean gradient, 30 mm Hg). (B and C From Burstow et al [1]. Used with permission.) |
The continuity equation can be used to estimate the functional orifice area of prosthetic aortic and mitral valves (4,5,6) (see Chapter 12). The pressure half-time (PHT) method used for stenosis of a native mitral valve overestimates the area of a mitral prosthesis (4). The prosthetic valve is inherently stenotic in varying degrees compared with the respective native valve; therefore, flow velocity across a normal prosthetic valve is higher than that expected for a native valve. Normal prosthetic flow velocity (hence, maximal and mean pressure gradients) varies according to the type and size of the prosthesis, the location, and the cardiac output. Hence, it is important to know the normal ranges of flow velocities across a particular prosthesis for comparison with measured values. The Mayo Echocardiography Laboratory prospectively determined a range of normal Doppler values for each type of aortic,
mitral, tricuspid, and pulmonary prosthesis in a large number of patients: 609, 456, 82, and 51, respectively (7,8,9,10) (Tables 13-1, 13-2, 13-3, 13-4). Because the hemodynamics of a prosthesis depend on various factors, it is recommended that a baseline Doppler study be performed in the early postoperative period (“fingerprint”) so that it can be used as a reference for comparison with later studies.
mitral, tricuspid, and pulmonary prosthesis in a large number of patients: 609, 456, 82, and 51, respectively (7,8,9,10) (Tables 13-1, 13-2, 13-3, 13-4). Because the hemodynamics of a prosthesis depend on various factors, it is recommended that a baseline Doppler study be performed in the early postoperative period (“fingerprint”) so that it can be used as a reference for comparison with later studies.
Table 13-1 Doppler hemodynamic profiles of 609 normal aortic valve prostheses | |||||||||||||||||||||||||||||||||||||||||||||
|---|---|---|---|---|---|---|---|---|---|---|---|---|---|---|---|---|---|---|---|---|---|---|---|---|---|---|---|---|---|---|---|---|---|---|---|---|---|---|---|---|---|---|---|---|---|
| |||||||||||||||||||||||||||||||||||||||||||||
Regurgitation and obstruction both result in increased flow velocities across a prosthesis (Fig. 13-4). The increase in flow velocity indicates a smaller orifice when the prosthesis is obstructed or increased flow across the prosthesis when there is clinically significant regurgitation. Other helpful Doppler features differentiate obstruction from regurgitation (Table 13-5). When a prosthesis is obstructed, flow velocities increase and the PHT is prolonged (for mitral and tricuspid valve prostheses). The increase in flow velocity across the obstructed aortic prosthesis is not accompanied by increased left ventricular outflow tract (LVOT) velocity, but it is with severe regurgitation. When the velocity across the mitral or tricuspid prosthesis is increased because of severe regurgitation, PHT is normal or shortened and LVOT velocity is decreased because forward flow is decreased (Fig. 13-5). A high cardiac output state also increases velocity across a prosthesis, and it can be confirmed by recording increased flow velocities across all cardiac orifices (LVOT, atrioventricular valve, right ventricular [RV] outflow tract).
Table 13-2 Doppler hemodynamic profiles of 456 normal mitral valve prostheses | ||||||||||||||||||||||||||||||
|---|---|---|---|---|---|---|---|---|---|---|---|---|---|---|---|---|---|---|---|---|---|---|---|---|---|---|---|---|---|---|
| ||||||||||||||||||||||||||||||
Obstruction
The incidence of prosthetic valve obstruction has been estimated at 0.1% to 0.4% per year, depending on valve size, type, location, and adequacy of anticoagulation (11). Whereas the obstruction of a mitral mechanical prosthesis is caused more frequently by thrombus (Fig. 13-6), the obstruction of an aortic mechanical prosthesis is caused more frequently by pannus formation (12). When a prosthetic valve becomes obstructed, the motion of the disk, ball, or leaflets decreases; however, it is difficult to visualize, and yet more difficult to quantify, the restriction of excursion with surface 2D echocardiography. TEE may be able to visualize normal and abnormal motion of a prosthetic valve (Fig. 13-7). The most accurate method for detecting and quantifying the degree of prosthetic obstruction is Doppler echocardiography (Fig. 13-7 B and 13-8). The Doppler study must be performed with various transducer positions to ensure that the maximal jet velocity across the stenosed prosthesis is recorded.
From the Doppler velocity tracing, the maximal and mean pressure gradients and the effective valve area can be calculated with the same formulas and equations described for the native valve (see Chapter 12). It is important to remember, however, that increased flow velocity itself does not always indicate prosthetic obstruction. The velocity can be increased without stenosis in a high-output state and in the presence of severe prosthetic regurgitation (Table 13-5). In patients with a mitral prosthesis, PHT is useful for determining whether increased velocity (i.e., gradient) is due to increased flow or obstruction. PHT as well as peak flow velocity are expected to increase when a mitral or tricuspid prosthesis is obstructed (Fig. 13-4).
From the Doppler velocity tracing, the maximal and mean pressure gradients and the effective valve area can be calculated with the same formulas and equations described for the native valve (see Chapter 12). It is important to remember, however, that increased flow velocity itself does not always indicate prosthetic obstruction. The velocity can be increased without stenosis in a high-output state and in the presence of severe prosthetic regurgitation (Table 13-5). In patients with a mitral prosthesis, PHT is useful for determining whether increased velocity (i.e., gradient) is due to increased flow or obstruction. PHT as well as peak flow velocity are expected to increase when a mitral or tricuspid prosthesis is obstructed (Fig. 13-4).
Table 13-3 Doppler hemodynamic profiles of 82 normal tricuspid valve prostheses | |||||||||||||||||||||||||||||||||||
|---|---|---|---|---|---|---|---|---|---|---|---|---|---|---|---|---|---|---|---|---|---|---|---|---|---|---|---|---|---|---|---|---|---|---|---|
| |||||||||||||||||||||||||||||||||||
Table 13-4 Doppler echocardiographic data for pulmonary valve prostheses | |||||||||||||||||||||||||||||||||||||
|---|---|---|---|---|---|---|---|---|---|---|---|---|---|---|---|---|---|---|---|---|---|---|---|---|---|---|---|---|---|---|---|---|---|---|---|---|---|
|


