Contrast Echocardiography
Contrast echocardiography has been available since the early stage of echocardiography, when indocyanine green and agitated saline were used to identify cardiac structures seen on M-mode and two-dimensional (2D) echocardiography (1,2). The clinical applications of contrast echocardiography have been expanded, and it is now used to identify intracardiac and intrapulmonary shunts, to augment Doppler velocity signals, to enhance the endocardial border, and, most recently, to assess myocardial perfusion. In an echocardiography practice, agitated saline or a contrast agent is used daily in 10% to 15% of all studies and in 30% to 40% of stress tests. This chapter discusses the routine clinical use and potential future applications of contrast echocardiography.
Evaluation of Shunts
The most frequent shunt lesion evaluated in an echocardiography laboratory is an atrial shunt through a patent foramen ovale, which is a common finding even in a normal population. The evaluation can be made with either transthoracic or transesophageal echocardiography (Fig. 6-1 and 6-2). With transthoracic echocardiography, either the apical four-chamber view or subcostal view is used. With transesophageal echocardiography, the 0-degree transverse or 90-degree atrial septal view (with the transducer rotated clockwise) is optimal for imaging. An intravenous catheter is required (usually in an arm vein), with a three-way stopcock and two 12-mL syringes to agitate the saline immediately before it is injected. Bubbles created by agitated saline do not appear in the left side of the heart unless there is a communication between the right and left chambers. With a three-way stopcock, 10 mL of saline can be squirted back and forth (i.e., agitated) between two syringes at least five times before the saline is injected into the venous circulation. To facilitate the saline injection, the upper arm is massaged with two hands soon after the injection is made. The injection should be coordinated with the person who performs echocardiography so that the most optimal imaging view for identifying a suspected shunt lesion is shown on the screen when the saline is injected. If an atrial shunt is present, bubbles from the agitated saline will appear immediately in the left atrium after being seen in the right atrium. In case of a left-to-right shunt, a negative contrast effect is seen. If the patient has an intrapulmonary shunt, more than three cardiac cycles may be needed for the bubbles to go through the pulmonary circulation before they appear in the left atrium. An intrapulmonary shunt can be located by visualizing the pulmonary veins with transesophageal echocardiography (Fig. 6-3).
Another indication for agitated saline is the evaluation of a persistent left superior vena cava that drains into the coronary sinus. In this case, agitated saline should be injected into a left arm vein. The enlarged coronary sinus in the left atrioventricular groove will be opacified (Fig. 6-4), although both the left and right superior vena cava can drain into the coronary sinus.
Augmentation of the Doppler Velocity Signal
Bubbles created by agitated saline strengthen Doppler velocity signals from the right heart chambers. To estimate right ventricular (RV) and pulmonary artery systolic pressure, it is necessary to record tricuspid regurgitation velocity, which may not be detectable in 30% of patients. In some patients, the tricuspid regurgitation signal is faint and a stronger signal is needed to provide a reliable estimate
of RV systolic pressure. Agitated saline (prepared as described above) improves the chance of obtaining tricuspid regurgitation signals (see Chapter 9). However, if tricuspid regurgitation is not detected with color flow imaging, its signal is not likely to appear even with the injection of agitated saline.
of RV systolic pressure. Agitated saline (prepared as described above) improves the chance of obtaining tricuspid regurgitation signals (see Chapter 9). However, if tricuspid regurgitation is not detected with color flow imaging, its signal is not likely to appear even with the injection of agitated saline.
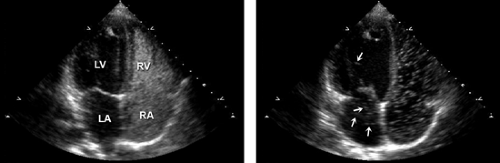 Figure 6-1 Left and right, Transthoracic echocardiograms demonstrating, with agitated saline, a right-to-left shunt. Because of a shunt through a patent foramen ovale, the contrast microbubbles (arrows) appear immediately in the left atrium (LA) after appearing in the right atrium (RA). In contrast, if the patient has a pulmonary atrial ventricular shunt, the microbubbles appear in the LA several cardiac cycles after they appear in the RA. The apical four-chamber view is best for evaluating an atrial shunt, but a subcostal view may be used. LA, left atrium; LV, left ventricle; RA, right atrium; RV, right ventricle. |
Gas-Filled Microbubbles
Currently, the most frequent indication for the use of a contrast agent with gas-filled microbubbles is to enhance the definition of the endocardial border (6,7). Microbubbles generally are 4- to 5-μm spheres able to pass through the microcirculation. They undergo volumetric oscillations upon exposure to ultrasound waves. These oscillations create the acoustic signals that opacify cardiac chambers or other areas of blood flow (8). Microbubbles need to be packaged within a stable shell.
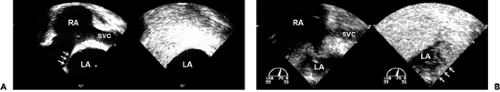 Figure 6-2 With agitated saline, transesophageal echocardiography can demonstrate a patent foramen ovale and right-to-left shunt. A: No shunt through the atrial septum (arrows); B: large right-to-left shunt (arrows). The echocardiography probe is set at a 60-90–degree angle to obtain the atrial septal–superior vena cava (SVC) view. The connection of the SVC with the right atrium (RA) is well visualized, as is the patent foramen ovale and atrial septum. Agitated saline is injected instead of contrast agent. After the agitated saline is injected into an arm vein, it appears in the SVC and then the RA. Because of a patent foramen ovale, agitated saline microbubbles appear immediately in the left atrium (LA). Some patients may have a right-to-left shunt only when they perform a Valsalva maneuver or cough. Therefore, imaging should be done with agitated saline and with the patient’s cough or upon release of the Valsalva maneuver. |
Modifications of the microbubble shell and gas properties have improved their stability through the pulmonary circulation and have provided good imaging of microbubbles in the left heart chambers and myocardium. The microbubble shell consists of lipid, polymer, galactose, surfactant, albumin, or a combination of these (7). The gas contents are usually perfluorocarbons and sulfur hexafluoride. Ultrasound generates positive and negative (sinusoidal) pressures, and microbubbles are compressed and expanded by the ultrasound acoustic energy in a nonlinear fashion if the acoustic pressure is sufficiently high at the resonant frequency of the microbubbles. This nonlinear property of microbubbles generates harmonic signals when the microbubbles are contacted by ultrasound waves
(Fig. 6-5). When ultrasound waves are transmitted at high frequency (fundamental frequency) to the microbubbles, returning signals have not only the fundamental frequency, fo, but also a second harmonic frequency, 2 fo (frequency twice that of the fundamental frequency) (Fig. 6-6). Myocardial tissue also generates signals with a second harmonic frequency but a much smaller amount than the nonlinearly behaving microbubbles. Therefore, modifying the imaging device to receive the signals with the second harmonic frequency (second harmonic imaging) enhances the detection of microbubbles. Even without microbubbles in the cardiac chambers, second harmonic imaging of tissue also improves the image quality of myocardial structures. Although the second harmonic imaging signals increase with higher ultrasound power, the microbubbles are deformed by higher positive and negative pressures to the point of being destroyed. The ultrasound acoustic power is expressed as the mechanical index, which is proportional to the acoustic pressure and inversely proportional to the square root of the ultrasound frequency. A mechanical index higher than 0.7 is likely to destroy the microbubbles:
(Fig. 6-5). When ultrasound waves are transmitted at high frequency (fundamental frequency) to the microbubbles, returning signals have not only the fundamental frequency, fo, but also a second harmonic frequency, 2 fo (frequency twice that of the fundamental frequency) (Fig. 6-6). Myocardial tissue also generates signals with a second harmonic frequency but a much smaller amount than the nonlinearly behaving microbubbles. Therefore, modifying the imaging device to receive the signals with the second harmonic frequency (second harmonic imaging) enhances the detection of microbubbles. Even without microbubbles in the cardiac chambers, second harmonic imaging of tissue also improves the image quality of myocardial structures. Although the second harmonic imaging signals increase with higher ultrasound power, the microbubbles are deformed by higher positive and negative pressures to the point of being destroyed. The ultrasound acoustic power is expressed as the mechanical index, which is proportional to the acoustic pressure and inversely proportional to the square root of the ultrasound frequency. A mechanical index higher than 0.7 is likely to destroy the microbubbles:
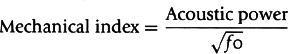
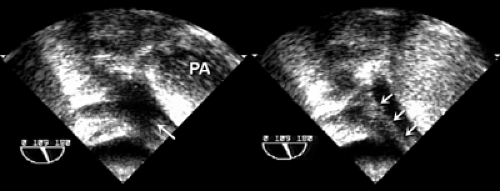 Figure 6-3 Visualization of left pulmonary vein. Left, Left upper pulmonary vein (arrow). Right, Contrast (arrows) demonstrates the location of an intrapulmonary shunt. PA, pulmonary artery. |
Several techniques have been developed by the ultrasound industry to enhance second harmonic signals from microbubbles (Fig. 6-7). The pulse-inversion method sends out two ultrasound pulses of inverted (or out of) phase (analogous to sine and cosine curves) to the myocardial tissue and microbubbles. Myocardial tissue with linear properties produces two ultrasound signals of inverted phase at the fundamental frequency which are canceled by each other, but the microbubbles, with nonlinear properties, produce residual signals from two nonlinearly reflected signals. Another method is pulse-modulation, which sends out two successive pulses, one signal with half the amplitude of the other signal. The returning signal of the half-amplitude signal is doubled and subtracted from the full signal. In linearly behaving tissue signals, both signals are canceled, but in nonlinearly behaving microbubbles, some signals remain and are imaged.
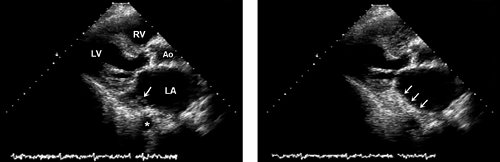 Figure 6-4 Left, Parasternal long-axis view showing a large coronary sinus (arrow). *, Descending thoracic aorta; Ao, aorta; LA, left atrium; LV, left ventricle; RV, right ventricle. Right, Agitated saline injected into the left arm opacifies the coronary sinus, indicating a persistent left superior vena cava. Arrows, Opacification of the coronary sinus. |
Blood flow velocity and volume can be measured with contrast echocardiography by using the unique interaction between microbubbles and ultrasound. Microbubbles are destroyed by high-energy ultrasound (high mechanical index), and the rate of the reappearance of the microbubbles reflects the velocity of blood flow. Full replenishment of microbubbles after destruction represents blood volume in the myocardium. Therefore, the lack of or decreased replenishment of microbubbles several cardiac cycles after their destruction indicates a perfusion defect in the myocardium (5,6,7).
Enhancement of the Definition of the Endocardial Border
Stay updated, free articles. Join our Telegram channel

Full access? Get Clinical Tree


