Valvular Heart Disease
Echocardiography is not only the most versatile imaging technique for the cardiovascular system but also the most comprehensive and reliable hemodynamic tool. As we have gained confidence in the use of two-dimensional (2D) and Doppler echocardiography for assessing cardiac hemodynamics, the evaluation of valvular heart diseases has increasingly depended on echocardiography, so that fewer patients with valvular heart disease undergo invasive hemodynamic assessment. Therefore, hemodynamic variables such as pressure gradients, stenotic and regurgitant valve orifice area, cardiac output, regurgitant volume, left ventricular (LV) filling pressure, and pulmonary artery pressures are routinely and reliably measured with 2D and Doppler echocardiography.
In some conditions, a Doppler hemodynamic evaluation is more accurate than an invasive hemodynamic assessment. For example, the pressure gradient across a stenotic mitral valve can be overestimated with cardiac catheterization when pulmonary capillary wedge pressure instead of left atrial (LA) pressure is used to measure the transmitral gradient (1). Echocardiographic evaluation of valvular regurgitation has become more quantitative with the use of Doppler and color flow imaging (2,3,4). Transesophageal echocardiography (TEE) allows a clearer delineation of valvular morphology and provides easier access for recording pulmonary vein flow velocities, which assist in determining the severity of mitral regurgitation, and diastolic filling pressures. Hence, in most patients with valvular heart disease, an echocardiographic evaluation should provide comprehensive structural, functional, and hemodynamic information. Because of this comprehensive echocardiographic information, physicians can better decide on the optimal treatment strategy, including the timing of surgical intervention for patients with valvular heart disease.
Clinical observations also indicate that even hemodynamically insignificant valvular abnormalities have a profound prognostic implication or at least are associated with a more general abnormality in the cardiovascular and metabolic systems. Sclerosis and calcification of the aorta and calcification of the mitral anulus have been associated with abnormal lipid metabolism, abnormal myocardial perfusion, and even poor survival (5,6,7). In the general population, atherosclerotic risk factors have been found to be independently associated with abnormality of the aortic valve. The echocardiographic evaluation of the valvular structure itself may become an important surrogate marker for a more wide-spread metabolic syndrome or atherosclerotic process. Several ongoing clinical trials are studying the question about whether clinically significant aortic stenosis can be prevented or slowed by aggressive management of atherosclerotic risk factors.
Aortic Stenosis
Two-Dimensional and M-Mode Echocardiography
A normal aortic valve has three thin cusps and an unrestricted systolic opening. The area of a normal aortic valve is 3 to 4 cm2, and normal opening generally produces 2 cm of leaflet separation. The same amount of separation is maintained during most of systole unless the patient has a low cardiac output or obstruction of the LV outflow tract (LVOT) (see Fig. 2-18). The most common form of aortic stenosis is caused by degenerative valvular calcification. The leaflets are thickened and calcified (Fig. 12-1), decreasing systolic opening. However, the M-mode echocardiogram may appear normal in patients with a noncalcific stenotic valve with systolic doming, as in congenital aortic stenosis, because the restriction of valve opening occurs at the distal portion with doming. However, 2D echocardiography visualizes the entire aortic valve structure and is helpful in identifying noncalcific as well as calcific aortic stenosis. Although occasionally difficult, the number of aortic cusps can be determined with 2D echocardiography, especially from a parasternal short-axis view at the level of the aortic
valve (Fig. 12-2) or with TEE (Fig. 12-3). In addition, the degree of valvular calcification, the size of the aortic anulus and the supravalvular ascending aorta, and the presence of secondary subvalvular obstruction are easily evaluated. Furthermore, 2D echocardiography is useful for determining the degree of LV hypertrophy (wall thickness and mass), LA enlargement, ventricular function, and the integrity of the other valves.
valve (Fig. 12-2) or with TEE (Fig. 12-3). In addition, the degree of valvular calcification, the size of the aortic anulus and the supravalvular ascending aorta, and the presence of secondary subvalvular obstruction are easily evaluated. Furthermore, 2D echocardiography is useful for determining the degree of LV hypertrophy (wall thickness and mass), LA enlargement, ventricular function, and the integrity of the other valves.
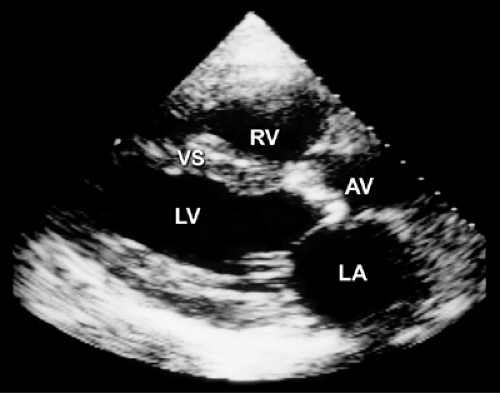 Figure 12-1 Two-dimensional echocardiogram of the parasternal long-axis view of a systolic frame showing a calcified aortic valve (AV) with reduced opening. LA, left atrium; LV, left ventricle; RV, right ventricle; VS, ventricular septum. |
Doppler Echocardiography
The hemodynamic severity of aortic stenosis determined with 2D and Doppler echocardiography is based on peak aortic flow velocity, mean pressure gradient, aortic valve area, and the LVOT–to–aortic valve (AoV) time velocity integral (TVI) ratio (LVOT:AoV TVI). A meticulous search for the maximal aortic velocity is essential because all the above variables are derived from the peak aortic flow velocity. To obtain comprehensive hemodynamic data, a systematic and meticulous Doppler examination should be performed on all patients with valvular stenosis.
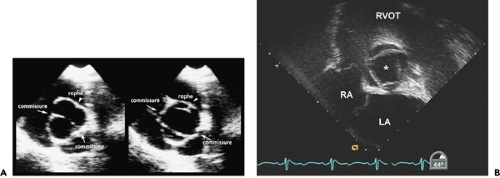 Figure 12-2 Still-frame of two-dimensional echocardiogram of bicuspid (A) and quadricuspid (B) aortic valves. A (left): Diastolic frame showing commissures at 4 and 10 o’clock positions. Right, A “fish-mouth” opening during systole. The raphe is at the 1 o’clock position. B: Systolic frame showing four aortic cusps in the transesophageal echocardiographic 64-degree view. *, aortic valve; LA, left atrium; RA, right atrium; RVOT, RV outflow tract. (From Brandenburg R Jr, Tajik AJ, Edwards WD, et al. Accuracy of 2-dimensional echocardiographic diagnosis of congenitally bicuspid aortic valve: echocardiographic-anatomic correlation in 115 patients. American Journal of Cardiology, 1983;51:1469–1473 . Used with permission.) |
All available transducer windows should be used to obtain the Doppler signal most parallel with the direction of the stenotic jet flow, which provides the highest velocity recording. Compared with a duplex transducer, a nonimaging continuous wave Doppler transducer is smaller and thus easier to manipulate between the ribs and suprasternal notch. Color flow imaging may be helpful in aligning the continuous wave Doppler beam so it is most parallel with the direction of blood flow.
The blood flow velocity and pressure gradient increase as the valve becomes smaller as long as stroke volume remains constant. Blood flow velocity (v) measured with Doppler echocardiography reliably reflects the pressure gradient according to the modified Bernoulli equation (see Chapter 4 for a comprehensive discussion of hemodynamic evaluation by Doppler echocardiography):
Pressure gradient = 4 × v2 or (2 × v)2
The accuracy of Doppler-derived instantaneous and mean pressure gradients has been validated with simultaneous cardiac catheterization data (8,9). Not uncommonly, however, there is a small difference between the Doppler-derived and catheter-derived aortic valve pressure gradients because of the pressure recovery phenomenon. Part of the kinetic energy lost during flow passage through a small orifice is recovered. Therefore, this pressure recovery results
in a higher absolute pressure in the ascending aorta away from the stenotic aortic valve, explaining why the catheter-derived pressure gradient is lower than the Doppler-derived pressure gradient (Doppler echocardiography measures the highest value). Pressure recovery is smaller when the aorta is dilated (10). However, pressure recovery may be an important factor in causing a discrepancy between echo-derived aortic valve area and catheter-derived aortic valve area. It should be emphasized that for a given valve area, the flow velocity and pressure gradient vary with the change in stroke volume and cardiac output. Therefore, cardiac output or stroke volume should be taken into account when the severity of valvular stenosis is determined. The continuity equation, which is derived from the same basic hydraulic formula (flow = area × flow velocity) as the Gorlin formula, can reliably estimate valve area by calculating stroke volume from another cardiac orifice (11,12,13). Good correlations have been obtained between echocardiographic-derived and catheter-derived valve areas (12,13,14). The following steps are required to obtain these data:
in a higher absolute pressure in the ascending aorta away from the stenotic aortic valve, explaining why the catheter-derived pressure gradient is lower than the Doppler-derived pressure gradient (Doppler echocardiography measures the highest value). Pressure recovery is smaller when the aorta is dilated (10). However, pressure recovery may be an important factor in causing a discrepancy between echo-derived aortic valve area and catheter-derived aortic valve area. It should be emphasized that for a given valve area, the flow velocity and pressure gradient vary with the change in stroke volume and cardiac output. Therefore, cardiac output or stroke volume should be taken into account when the severity of valvular stenosis is determined. The continuity equation, which is derived from the same basic hydraulic formula (flow = area × flow velocity) as the Gorlin formula, can reliably estimate valve area by calculating stroke volume from another cardiac orifice (11,12,13). Good correlations have been obtained between echocardiographic-derived and catheter-derived valve areas (12,13,14). The following steps are required to obtain these data:
Step 1. Determine stroke volume (SV) from LVOT diameter (D) and TVI (Fig. 12-4):

Step 2. Obtain the maximal aortic velocity by systematic search from multiple windows using continuous wave Doppler echocardiography (Fig. 12-5).
Step 3. Calculate the mean aortic pressure gradient and TVI by tracing the maximal velocity jet (Fig. 12-6), and be familiar with three different types of pressure gradients: maximal instantaneous gradient, mean gradient, and peak-to-peak gradient.
Step 4. Calculate the aortic valve area (AVA) using the continuity equation (Fig. 12-7):
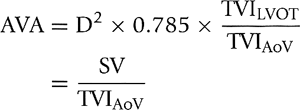
where AoV is aortic valve. (For a detailed discussion of Doppler hemodynamics, see Chapter 4.)
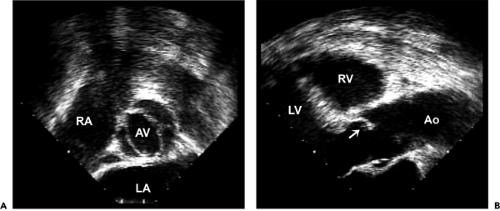 Figure 12-3 Transesophageal echocardiographic images of the bicuspid aortic valve from the (A) short-axis view and (B) long-axis view. The short-axis view shows a typical bicuspid aortic valve with the raphe at the 3 o’clock position and commissures at the 5 and 10 o’clock positions. From a long-axis view, the anterior cusp has a typical doming motion during systole (arrow). (Figure 1-3 also shows typical doming motion of a bicuspid aortic valve in the parasternal long-axis view.) Ao, aorta; AV, aortic valve; LA, left atrium; LV, left ventricle; RA, right atrium; RV, right ventricle. |
Definition of Severe Aortic Stenosis
In patients with normal LV systolic function and cardiac output, aortic stenosis is usually severe when
Peak aortic valve velocity is ≥4.5 m/s (Fig. 12-8)
Mean pressure gradient is ≥50 mm Hg (Fig. 12-8)
Aortic valve area is ≤0.75 cm2
LVOT: AoV TVI is ≤0.25 (Fig. 12-9)
The American Heart Association/American College of Cardiology guidelines for valvular heart diseases recommend that an aortic valve area of 1.0 cm2 or less be considered severe, rather than 0.75 cm2 or less (the traditional definition) (15). This recommendation overestimates the severity of aortic stenosis when the aortic valve area is calculated with 2D Doppler echocardiography. The pressure recovery phenomenon occurs even with native aortic valve stenosis and becomes more evident in patients with a relatively normal-size aorta (10). Because the Doppler-derived aortic pressure gradient is somewhat higher than the
catheter-derived gradient, a Doppler-derived aortic valve area is usually smaller than a catheter-derived aortic valve area. Garcia and colleagues (10) proposed a new index, the energy loss coefficient (ELCo) to estimate energy loss due to aortic stenosis, as follows:
catheter-derived gradient, a Doppler-derived aortic valve area is usually smaller than a catheter-derived aortic valve area. Garcia and colleagues (10) proposed a new index, the energy loss coefficient (ELCo) to estimate energy loss due to aortic stenosis, as follows:
where EL is energy loss, Q is flow rate in mp/s, AVA Doppler is Doppler-derived aortic valve area, and Aa is cross-sectional area of the aorta. Because the value of EL is very close to that of the catheter-derived pressure gradient, ELCo can be equated with catheter-derived aortic valve area (AVAcath). Hence, AVAcath can be estimated from AVA Doppler as follows:

When LV systolic function and cardiac output are abnormally low or high, the following points should be considered: peak velocity and mean aortic gradient vary with changes in stroke volume. If LV function or stroke volume is decreased, the peak aortic velocity and mean aortic pressure gradient may be less than 4.5 m/s and 50 mm Hg, respectively, in patients with severe aortic stenosis. However, the velocity or TVI ratio (hence, aortic valve area) should be independent of any change in stroke volume because the LVOT and aortic valve velocities change proportionally (Fig. 12-10). In patients with increased cardiac output across the aortic valve (as in aortic regurgitation or anemia), aortic stenosis may not be severe even when the peak velocity is 4.5 m/s or greater and the mean gradient is 50 mm Hg or higher. Again, LVOT:AoV TVI (or velocity) and aortic valve area should be more helpful in determining the severity of aortic stenosis.
To calculate the aortic valve area in the presence of clinically significant aortic regurgitation, the following should be considered: flow across the aortic valve increases with aortic regurgitation, as does the aortic pressure gradient. The increased flow is reflected in the LVOT and aortic valve velocities proportionally; thus, the TVI ratio remains the same for a given aortic valve area. Cardiac catheterization is less reliable in this situation and tends to result in a lower calculated aortic valve area, mainly because cardiac output is underestimated. When it is difficult to measure LVOT diameter, the TVI ratio can be helpful in determining the severity of aortic stenosis.
Dobutamine Echocardiography in Severe Aortic Stenosis with Low Aortic Pressure Gradient
When LV systolic function is abnormal and cardiac output is reduced, aortic stenosis is probably severe if 1) the aortic valve area by the continuity equation is 0.75 cm2 or less and 2) the LVOT:AoV TVI (or velocity) is 0.25 or less. In this situation, however, there are two diagnostic possibilities: one, true anatomically severe aortic stenosis
and, two, functionally severe aortic stenosis, because an aortic valve with mild or moderately severe stenosis may not open fully if the stroke volume is low. Gradual infusion of dobutamine (up to 20 μg/kg per minute) to increase stroke volume may be helpful in differentiating morphologically severe aortic stenosis from a decreased effective stenotic orifice area caused by low cardiac output (pseudosevere aortic stenosis) (16,17,18). In patients with truly severe aortic stenosis, the infusion of dobutamine increases the peak velocity and TVI of both the LVOT and aortic valve proportionally (hence, the LVOT:AoV TVI remains constant), whereas an increase in velocity and TVI
of the LVOT is far greater than that of the aortic valve (whose area becomes larger with higher output); hence, LVOT:AoV TVI increases in patients with pseudosevere (or functionally severe) aortic stenosis (Fig. 12-10).
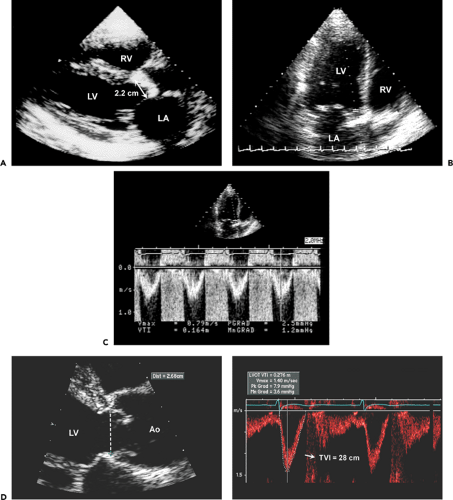 Figure 12-4 Stroke volume across the aortic valve needs to be calculated to determine aortic valve area. This is done by measuring the left ventricular outflow tract (LVOT) diameter and flow velocity. A: Measurement of LVOT diameter (D), (double-headed arrow): from the systolic freeze-frame of the parasternal long-axis view, the distance (2.2 cm) from where the anterior aortic cusp meets the ventricular septum to the point where the posterior cusp meets the anterior mitral leaflet. The line between the two cusps is almost perpendicular to the anterior wall of the aortic root. LVOT area = D2 × 0.785; hence, (2.2)2 × 0.785 = 3.8 cm2. B: Measurement of LVOT velocity from the apical long-axis view. The pulsed wave sample volume is located 3 to 5 mm below the aortic valve or at the aortic anulus. If the sample volume is too close to the aortic valve, prestenotic acceleration jet velocity may be recorded. LA, left atrium; LV, left ventricle; RV, right ventricle. C: Determination of LVOT time velocity integral (TVI) (velocity time integral [VTI]). TVI is determined by tracing the velocity envelope and is equal to the sum of individual velocities of the Doppler spectral envelope (TVI = 16 cm). After LVOT diameter and TVI are determined, stroke volume (SV) across the LVOT is calculated as follows:  D: LVOT diameter (left, dashed line) and TVI (right) measurement in a patient with a bicuspid aortic valve. SV = (2.7)2 × 0.785 × 28 = 160 mL. This patient has severe aortic regurgitation as well as mild stenosis. Ao, aorta. The following table shows corresponding LVOT areas calculated from various LVOT diameters: 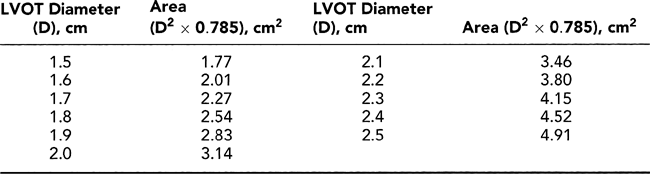 |
 Figure 12-5 A: Diagram of multiple transducer positions used to obtain aortic stenosis jet velocity. Maximal velocity is obtained most commonly (85% of the time) from the apical transducer position. The second most commonly successful position is the right parasternum. However, all the transducer positions should be used to ensure obtaining maximal velocity. B: Continuous wave Doppler recordings of aortic velocity from the apex (Apex) and right parasternal window (RPS) together with pulsed wave Doppler recording of the left ventricular outflow tract (LVOT) in an elderly patient with severe aortic stenosis. Peak aortic flow velocity is higher (4.5 m/s) from the RPS position than from the apex (4.0 m/s). If continuous wave Doppler had not been performed from the RPS position, the severity of aortic stenosis would have been underestimated. (A Modified from Nishimura RA, Miller FA Jr, Callahan MJ, et al. Doppler echocardiography: Theory, instrumentation, technique, and application. Mayo Clinic Proceedings, 1985;60:321–343 . Used with permission of Mayo Foundation for Medical Education and Research.) |
Dobutamine can be infused gradually from 5 μg/kg per minute in 5-μg increments every 3 minutes until the LVOT velocity or TVI reaches a normal value, 0.8 to 1.2 m/s or 20 to 25 cm, respectively. Maximal velocity or stroke volume is usually obtained with 15 to 20 μg/kg per minute of dobutamine. Aortic stenosis should be considered severe, warranting aortic valve replacement, if the aortic valve area is 1.0 cm2 or less and the mitral gradient, 30 mm Hg or more with dobutamine (17). However, according to recent data, the most important role of dobutamine infusion in patients who have severe aortic stenosis and a low gradient is to assess inotropic reserve, defined as an increase in stroke volume of more than 20% with dobutamine. The lack of inotropic reserve with dobutamine portends poor perioperative mortality (50% vs 7%) if aortic valve replacement is attempted (17,18). Therefore, if dobutamine infusion is able to increase stroke volume (or LVOT TVI) by 20% or more and the aortic valve area remains 1.0 cm2 or less, aortic valve replacement should be recommended. If no inotropic reserve is demonstrated with dobutamine, aortic valve replacement is still better than no treatment, but the mortality rate is very high (18,19,20).
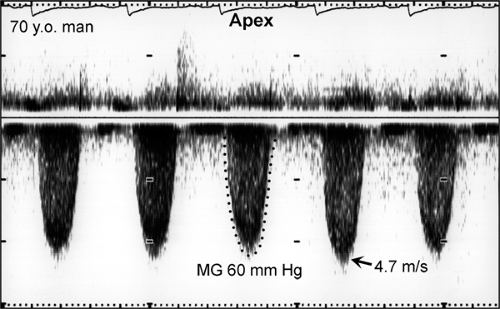 Figure 12-6 Continuous wave Doppler spectra from a 70-year-old man with severe aortic stenosis. The velocity was obtained from the apical window. The mean gradient (MG) was obtained by tracing a velocity signal. |
When a patient presents with severe heart failure, severe aortic stenosis, and severe LV systolic dysfunction, cautious administration of nitroprusside in combination with dopamine has been shown to stabilize the patient’s condition, and aortic valve replacement can be performed with greater success (21). Overall, the literature suggests that aortic valve replacement should be the treatment of choice for all patients with severe aortic stenosis, even when LV systolic function is reduced and the aortic pressure gradient is low. The lack of inotropic reserve demonstrated
with dobutamine infusion identifies a group of patients with high surgical mortality.
with dobutamine infusion identifies a group of patients with high surgical mortality.
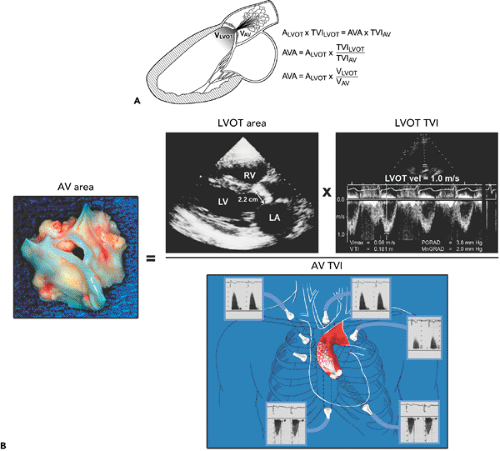 Figure 12-7 A: Diagram illustrating the continuity equation, which states that flow across the left ventricular outflow tract (LVOT) is the same as flow across the aortic valve (“what goes in must come out”). Therefore, Flow across LVOT = Flow across aortic valve LVOT area × TVILVOT = AVA × TVIAV LVOT (D)2 × 0.785 × TVILVOT = AVA × TVIAV AVA = LVOT D2 × 0.785 × TVILVOT/TVIAV where D = diameter, AVA = aortic valve area, AV = aortic valve, and TVI = time velocity integral. Because flow duration across the LVOT and aortic valve is the same, the TVI ratio is similar to their peak velocity (V) ratio. Therefore, the continuity equation can be simplified as AVA = D2 × 0.785 × VLVOT/VAV It is always preferable to use the TVI ratio. It should be noted that TVI or peak velocity ratio is inversely proportional to the area ratio of the LVOT and aortic valve. For example, the TVI ratio of 0.3 indicates that the aortic valve area is about 30% of the LVOT area. This ratio is also useful in determining the severity of aortic stenosis (see Fig. 12-9). B: Continuity equation to calculate aortic valve (AV) area. |
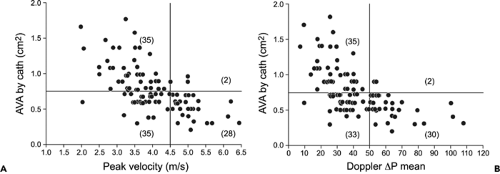 Figure 12-8 Plot of catheter (cath)-derived aortic valve area (AVA) versus Doppler peak velocity (A) and Doppler-derived mean pressure (ΔP) gradients (B). The aortic valve area is 0.75 cm2 or smaller when the peak velocity and mean pressure gradient are at least 4.5 m/s and 50 mm Hg, respectively, in essentially all patients. However, one-half of the patients with lower Doppler peak velocities and mean gradients also had an aortic valve area of 0.75 cm2 or less, especially in the setting of low cardiac output. (From Oh et al. [13]. Used with permission.) |
Caveats
The aortic stenosis jet must be differentiated from other systolic Doppler findings, including mitral regurgitation, LVOT obstruction, tricuspid regurgitation, and pulmonary stenosis (Fig. 12-11).
It may be difficult to measure LVOT diameter because of heavy calcification of the aortic valve and anulus. In this situation, another nonregurgitant orifice (right ventricular [RV] outflow tract or mitral valve) can be used to calculate stroke volume. In this case, the TVI ratio, not the peak velocity ratio, must be used because the flow ejection periods are different.
It may be difficult to obtain a satisfactory LVOT velocity because of coexisting LVOT obstruction from basal septal hypertrophy. Flow velocity proximal to the aortic valve may reach 2 m/s, which can overestimate the aortic pressure gradient calculated with the modified Bernoulli equation.
If the patient’s rhythm is other than sinus, the aortic and LVOT velocities will vary with each cardiac cycle, depending on the preceding RR interval. In this case, one can use the average velocities from 5 to 10 cardiac cycles or match the RR intervals for the LVOT and aortic valve velocity to obtain the TVI or velocity ratio. A simpler way is to use the highest velocity from the aortic valve and LVOT and their ratio (Figs. 12-12 and 12-13).
Studies suggest that calculations of aortic valve area are affected by change in stroke volume (22). Hence, a slightly larger area determined with dobutamine echocardiography may be related to the continuity equation itself instead of being a true change in valve area (23). TEE planimetry of the aortic valve area may be helpful in this situation (24).
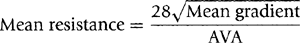
Aortic valve resistance is another hemodynamic index that represents the severity of aortic stenosis. It has a good correlation with aortic valve area (AVA) for a given aortic flow velocity. Mean aortic valve resistance is calculated by using the mean aortic pressure gradient and a constant of 28 obtained with nonlinear regression analysis by Bermejo and colleagues (23):
Aortic resistance appears to be affected less by change in flow. The index, however, does not appear to provide information that is any more valuable clinically than the measurements noted above.
Diastolic Function in Aortic Stenosis
Diastolic function varies in patients with aortic stenosis. These patients usually have at least a mild degree (grade 1) of diastolic dysfunction, which implies impairment of myocardial relaxation but normal diastolic filling pressure. As aortic stenosis progresses to a symptomatic stage, diastolic function also deteriorates to grades 2 and 3. Although our current practice does not usually incorporate the status of diastolic function into the management strategy for aortic stenosis, our ability to manage this common clinical problem may be improved if diastolic function is considered. It may be most helpful in the assessment of a combined disease state, for example, hypertension, moderate mitral regurgitation, and aortic stenosis.
LV longitudinal motion is afterload-dependent. In patients with severe aortic stenosis, the early diastolic
velocity (Ea) of the mitral anulus is decreased. On average, this velocity increases by 2 cm/s after replacement of the aortic valve (25).
velocity (Ea) of the mitral anulus is decreased. On average, this velocity increases by 2 cm/s after replacement of the aortic valve (25).
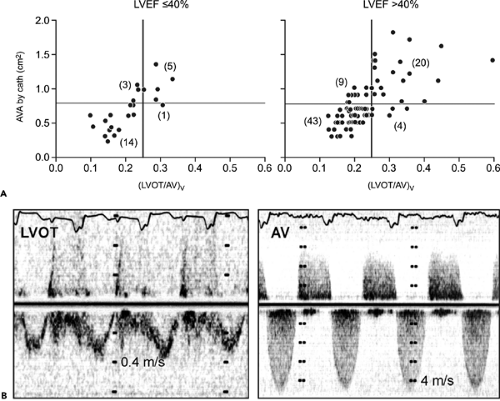 Figure 12-9 A: Correlation of left ventricular outflow tract (LVOT)/aortic valve (AV) velocity ratio with catheter-derived aortic valve area (AVA). LVOT/AV velocity [(LVOT/AV)v] or time velocity interval (TVI) ratio is inversely proportional to their area ratio. When the ratio is >0.25 (i.e., aortic valve area >25% of LVOT area), AVA is >0.75 cm2. Most patients with a ratio <0.25 (i.e., AVA <25% of LVOT area) have severe aortic stenosis (i.e., AVA <0.75 cm2), whether left ventricular ejection fraction (LVEF) is >40% or ≤40%. B: Example of critical aortic stenosis in the setting of low cardiac output. The aortic valve (AV) velocity is 4.2 m/s and LVOT flow velocity is 0.4 m/s, indicating a marked decrease in cardiac output. The LVOT/AV velocity ratio is <0.1 |
Severe Pulmonary Hypertension with Severe Aortic Stenosis
Forty-seven patients with an aortic valve area less than 1 cm2 and a tricuspid regurgitant velocity of 4 m/s or more were analyzed by Malouf and colleagues at Mayo Clinic (26). The LV systolic function was decreased (LV ejection fraction ≤35%) in 40% of the patients. Although perioperative mortality was high (16%), most of the patients who were treated conservatively died. However, for patients who survived aortic valve replacement, the symptoms improved and life expectancy was not significantly worse than that expected from life tables.
Natural Progression and Role of Exercise in Asymptomatic Patients with Aortic Stenosis
Patients with moderate to severe aortic stenosis may remain asymptomatic. Understanding the natural progression of the severity of aortic stenosis is helpful for timing follow-up and surgical intervention. Otto and colleagues (27) repeated echocardiographic studies and correlated the results with the clinical outcome of asymptomatic patients who had valvular aortic stenosis. The aortic jet velocity increased by 0.32 ± 0.34 m/s per year and the mean aortic pressure gradient by 7 ± 7 mm Hg per year; the
valve area decreased by 0.12 ± 0.19 cm2 per year. When the peak aortic velocity was more than 4.0 m/s, the likelihood of the patient remaining alive without valve replacement at 2 years was only 21% ± 18%. If LV systolic function and stroke volume decrease, aortic valve velocity may even decrease with more severe aortic stenosis (Fig. 12-14). Exercise Doppler hemodynamics were not helpful in the management of individual patients. Similar data were reported by Rosenhek and colleagues (28): of 128 consecutive patients with asymptomatic severe aortic stenosis (mean age, 60 ± 18 years, and mean peak aortic velocity, 5.0 ± 0.6 m/s), 60% ± 6% and 47% ± 6% were free of death or aortic valve replacement at 1 and 2 years of follow-up, respectively. Progression was faster in patients who were older than 50 years or who had aortic valve calcification (or both) (Fig. 12-15). The rate of progression
of stenosis was significantly higher in patients who had cardiac events: 0.45 ± 0.38 m/s vs. 0.14 ± 0.18 m/s. Of the patients who had moderately or severely calcified aortic valves and whose aortic valve velocity increased by 0.3 m/s or more, 79% had valve replacement or died during 2 years of follow-up. Knowledge of the natural history of the progression of aortic stenosis can also guide our management of less-than-severe aortic stenosis at the time of another cardiac operation.
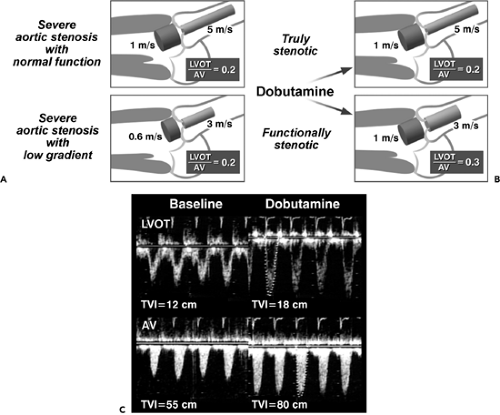 Figure 12-10 A: Diagram demonstrating that aortic flow velocity (AV) can be deceptively low (<4.5 m/s) in patients with severe aortic stenosis and low cardiac output. Cylinders represent stroke volume. Left ventricular outflow tract (LVOT) velocity is usually about 1 m/s in patients with normal function (top) and decreases to 0.6 m/s when stroke volume is decreased (bottom). However, the LVOT/AV velocity ratio is low (0.2) in both cases. B: When dobutamine is given to a patient who has severe aortic stenosis and low stroke volume and gradient (or low velocity), AV may or may not increase as LVOT velocity increases. In truly anatomically severe aortic stenosis (top), the AV velocity will increase in proportion to the increase in LVOT velocity. Hence, LVOT/AV remains low. In functionally (pseudo) severe aortic stenosis (bottom), AV velocity does not increase in proportion to LVOT velocity because the aortic valve area increases with higher stroke volume. Hence, LVOT/AV increases. C: Example of dobutamine Doppler hemodynamic measurement in a patient with severe aortic stenosis and a low gradient. At baseline, LVOT time velocity integral (TVI) was low (12 cm), indicating a low stroke volume, and AV peak velocity was 3 m/s, with TVI of 55 cm. TVI ratio between LVOT and AV was 0.22. With infusion of dobutamine up to 20 μg/kg per minute, LVOT TVI increased to 18 cm, which translated to a 50% increase in stroke volume, and AV TVI increased to a similar degree, to 80 cm. TVI ratio was 0.23, similar to the baseline ratio. This result indicates that the aortic valve is truly stenotic, with a low gradient. The patient had aortic valve replacement, which was successful. |
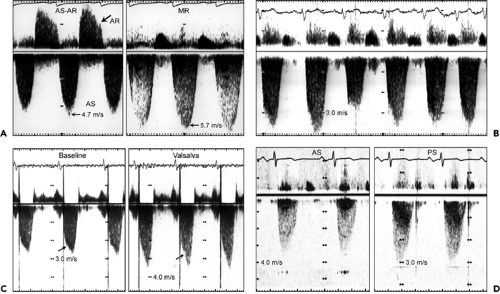 Figure 12-11 Differentiation of aortic stenosis Doppler spectral velocity from other systolic Doppler spectra. Systolic flow velocities by continuous wave Doppler echocardiography need to be analyzed on the following bases: 1) peak velocity, 2) flow duration or ejection time, 3) location of Doppler window, 4) accompanying diastolic flow signals, and 5) Doppler flow configuration. A: Duration of mitral regurgitation (MR) is longer than that of aortic stenosis (AS) because there is no ejection through the aortic valve during isovolumic relaxation and contraction, whereas regurgitation flow occurs during those periods. The mitral regurgitation jet is normally >4 to 5 m/s unless left atrial pressure is markedly increased. The peak velocity of mitral regurgitation is always higher than that of aortic stenosis when they occur together in the same patient. The aortic regurgitation (AR) jet also is frequently recorded together with the AS velocity and not with mitral regurgitation. B: The tricuspid regurgitation velocity typically has respiratory variation, with a lower peak velocity during inspiration. C: Flow velocity of dynamic left ventricular outflow tract obstruction produces a late-peaking dagger-shaped (arrow) velocity envelope. Dynamic left ventricular outflow velocity increases with the Valsalva maneuver. D: Doppler spectrum of pulmonary stenosis (PS) is almost identical to that of AS. The PS signal is best obtained from the subcostal or left upper parasternal window, whereas an AS jet is usually obtained from the apex or right parasternal window. |
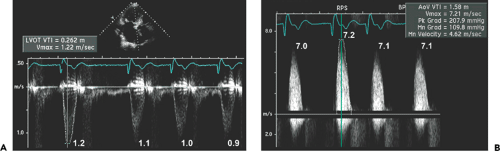 Figure 12-12 Pulsed wave Doppler recording of left ventricular outflow tract (LVOT) (A) and continuous wave Doppler recording of aortic valve (AV) (B) velocities in an elderly patient with atrial fibrillation. Velocities vary. LVOT velocities are 1.2 m/s, 1.1 m/s, 1.0 m/s, and 0.9 m/s, with an average of 1.05 m/s. AV velocities from the right parasternal window are 7.0 m/s, 7.2 m/s, 7.1 m/s, and 7.1 m/s. LVOT/AV velocity ratio is 0.15 using average values and 0.17 using peak values. LVOT/AV time velocity integral (TVI = VTI) ratio is 0.16 using peak velocities. AoV, aortic valve; Vmax, maximal velocity. |
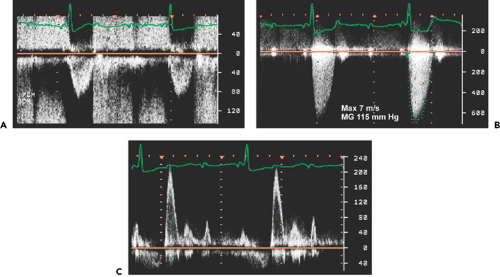 Figure 12-13 Left ventricular outflow tract (LVOT) (A) and aortic valve (AV) (B) velocities in a 67-year-old woman who presented with syncope. She has a heart block but rhythm is regular. LVOT velocity is 0.9 m/s and maximal AV velocity is 7 m/s. Aortic valve area was calculated to be 0.4 cm2, with her LVOT diameter of 2 cm. C: Mitral inflow from the patient shows a restrictive filling although early diastolic velocity is altered by superimposed atrial contraction. MG, mean gradient. |
Pellikka and colleagues (29) reviewed the cases of 622 asymptomatic patients who had aortic valve velocity of 4 m/s or more. The probability of these patients remaining free of cardiac symptoms without having valve replacement was 82%, 67%, and 33% at 1, 2, and 5 years, respectively. During the mean follow-up of 5.4 years, 265 patients (43%) died, (cardiac death in 117 [19%]). Sudden death occurred in 11 (4.1%) of 270 patients who did not have valve replacement. Patients who had a peak velocity of at least 4.5 m/s had a higher likelihood of developing symptoms or having surgery or cardiac death.
Transesophageal Echocardiography
If transthoracic Doppler echocardiography (TTE) is difficult to perform or there is dynamic LVOT obstruction, TEE can be used to measure aortic valve area by planimetry (24). With a multiplane probe, the transducer array is rotated to 45 to 60 degrees to obtain the short-axis view of the aortic valve. The number of aortic cusps can be determined confidently with TEE. However, it is not routine practice to use TEE to evaluate aortic stenosis.
Many patients with severe stenosis who undergo aortic valve replacement have mitral valve regurgitation, which is frequently related to increased LV systolic pressure, without any morphologic abnormality of the mitral valve. TEE is used intraoperatively to evaluate the severity of mitral regurgitation before and after aortic valve replacement and to assess the need for mitral valve replacement or repair.
Clinical Implications
Echocardiography provides a comprehensive morphologic and hemodynamic evaluation of stenotic aortic valves, and on the basis of the information obtained with this technique, proper management decisions can be made. In patients with severe aortic stenosis (mean gradient ≥50 mm Hg or echocardiographically derived aortic valve area ≤0.75 cm2), we routinely proceed with aortic valve replacement after coronary angiography (when the patient is 50 years or older), but without LV angiography or invasive hemodynamic confirmation. In our current practice, more than 85% of patients undergo aortic valve replacement without an invasive hemodynamic assessment.
Serial cranial magnetic resonance imaging studies documented focal diffusion-imaging abnormalities in 22% of patients who underwent retrograde catheterization of the aortic valve (30). Therefore, cardiac catheterization should be used only in patients with echocardiographic findings nondiagnostic for aortic stenosis. Because aortic valve sclerosis or calcification appears to be related to or associated with lipid metabolism or the atherosclerotic process (30,31,32), it is reasonable to consider the use of a lipid-lowering agent to slow the progression of aortic stenosis. Several ongoing clinical trials are studying this strategy. In a few years, the optimal management of patients with evidence of aortic valve disease should be clear.
Serial cranial magnetic resonance imaging studies documented focal diffusion-imaging abnormalities in 22% of patients who underwent retrograde catheterization of the aortic valve (30). Therefore, cardiac catheterization should be used only in patients with echocardiographic findings nondiagnostic for aortic stenosis. Because aortic valve sclerosis or calcification appears to be related to or associated with lipid metabolism or the atherosclerotic process (30,31,32), it is reasonable to consider the use of a lipid-lowering agent to slow the progression of aortic stenosis. Several ongoing clinical trials are studying this strategy. In a few years, the optimal management of patients with evidence of aortic valve disease should be clear.
Calcification of the aortic valve seen with computed tomography has been correlated with the mean gradient and area of the stenotic aortic valve (33). It has a good negative predictive value but a low positive predictive value, as in coronary calcification. Therefore, aortic valve calcification may serve as a screening tool, but a detailed hemodynamic assessment requires Doppler echocardiography.
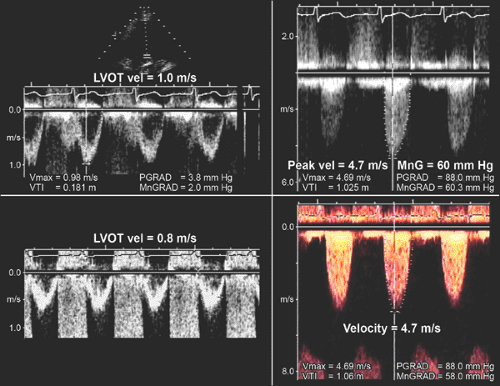 Figure 12-14 Top, Left ventricular outflow tract (LVOT) and aortic valve (AV) velocities (vel) in a 67-year-old asymptomatic man. Peak velocity (Peak vel) of 4.7 m/s and mean gradient (MnGRAD, MnG) of 60 mm Hg indicate severe aortic stenosis. Bottom, LVOT and AV velocities 3 years later. Although AV velocity remained the same at 4.7 m/s, LVOT velocity (i.e., stroke volume) decreased. Left ventricular systolic function was normal when the initial Doppler velocities were obtained. Three years later, the left ventricular ejection fraction was 20%, and he was symptomatic with heart failure. Most likely, AV velocity was much higher 1 or 2 years after the first examination while left ventricular systolic function and stroke volume were normal. Subsequently, left ventricular systolic function, stroke volume, and AV velocity all decreased, even with progression of aortic stenosis. PGRAD, peak or maximal gradient; Vmax, peak or maximal velocity; VTI, velocity time integral. |
Mitral Stenosis
Two-Dimensional and M-Mode Echocardiography
In nearly all patients, valvular mitral stenosis is caused by rheumatic involvement of the mitral valve. Uncommon causes include degenerative calcification, a complication of mitral valve surgery, medication toxicity (Cafergot,
fen-phen, or pergolid), hypereosinophilia, and vegetation. The typical M-mode (see Fig. 2-19) and 2D echocardiographic features of rheumatic mitral stenosis include the following (Fig. 12-16):
fen-phen, or pergolid), hypereosinophilia, and vegetation. The typical M-mode (see Fig. 2-19) and 2D echocardiographic features of rheumatic mitral stenosis include the following (Fig. 12-16):
Thickened and calcified mitral leaflets and subvalvular apparatus
Decreased E-F slope (M-mode)
“Hockey-stick” appearance of the anterior mitral leaflet in diastole (long-axis view)
Immobility of the posterior mitral leaflet (a similar appearance can be seen in hypereosinophilia or ergot use)
“Fish-mouth” orifice in the short-axis view
Increased LA size, with the potential for thrombus formation
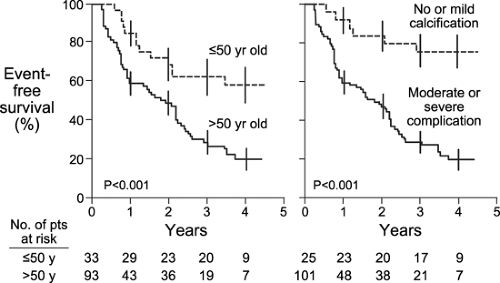 Figure 12-15 Event-free survival curve for asymptomatic patients with severe aortic stenosis (see text for details). (From Rosenhek et al. [28]. Used with permission.) |
The mitral valve area can be measured with planimetry from the parasternal short-axis view (Fig. 12-16 B), which may be difficult in patients who have heavy calcification or who previously had commissurotomy. In patients undergoing mitral balloon valvuloplasty, an echocardiographic score based on valve thickness, calcification, mobility, and subvalvular thickening can be used to predict the outcome of the procedure (34) (Table 12-1). Patients with an echocardiographic score of 8 or less have a more favorable result from mitral balloon valvuloplasty than those with a higher score, but a score higher than 8 does not preclude the option of valvuloplasty (34). Commissural calcification or fusion is another important determinant of poor outcome after percutaneous valvuloplasty or valvotomy (35).
Doppler and Color Flow Imaging
Stay updated, free articles. Join our Telegram channel

Full access? Get Clinical Tree


