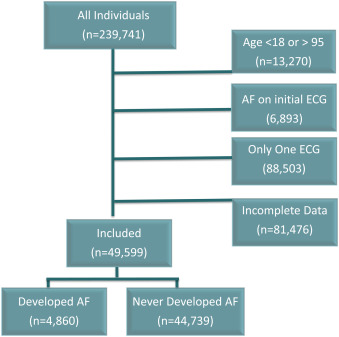
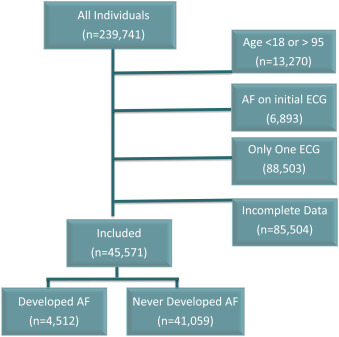
A risk score for atrial fibrillation (AF) has been developed by the Framingham Heart Study and Cohorts for Heart and Aging Research in Genomic Epidemiology (CHARGE)-AF consortium. However, validation of these risk scores in an inner-city population is uncertain. Thus, a validation model was built using the Framingham Risk Score for AF and CHARGE-AF covariates. An in and outpatient electrocardiographic database was interrogated from 2000 to 2013 for the development of AF. Patients were included if their age was >45 and <95 years, had <10-year follow-up, if their initial electrocardiogram was without AF, had ≥2 electrocardiograms, and declared a race and/or ethnicity as non-Hispanic white, African-American, or Hispanic. For the Framingham Heart Study, 49,599 patients met inclusion criteria, of which 4,860 developed AF. Discrimination analysis using area under the curve (AUC) for original risk equations: non-Hispanic white AUC = 0.712 (95% confidence interval [CI] 0.694 to 0.731), African-American AUC = 0.733 (95% CI 0.716 to 0.751), and Hispanic AUC = 0.740 (95% CI 0.723 to 0.757). For the CHARGE-AF, 45,571 patients met inclusion criteria, of which 4,512 developed AF. Non-Hispanic white AUC = 0.673 (95% CI 0.652 to 0.694), African-American AUC = 0.706 (95% CI 0.685 to 0.727), and Hispanic AUC = 0.711 (95% CI 0.691 to 0.732). Calibration analysis showed qualitative similarities between cohorts. In conclusion, this is the first study to validate both the Framingham Heart Study and CHARGE-AF risk scores in both a Hispanic and African-American cohort. All models predicted AF well across all race and ethnic cohorts.
Atrial fibrillation (AF) is the most common cardiac arrhythmia, whose prevalence is increasing. It represents a major public health problem and is closely related to stroke, mortality, decreased quality of life, and a high health care cost burden. Various prediction models have been constructed to assist clinicians and epidemiologists in assessing a patient’s risk to develop AF. The most widely used models are the risk-based algorithm for 10-year incidence of AF in the Framingham Heart Study (FHS) and the more recent risk-based algorithm for 5-year incidence in the Cohorts for Heart and Aging Research in Genomic Epidemiology (CHARGE)-AF consortium. Validation of these prediction models in minorities and socioeconomically heterogeneous populations has been recommended as it is known that both the incidence and risk burden of AF vary by racial/ethnic groups and social economic status (SES). For example, despite having a higher burden of traditional AF risk factors, African-Americans and Hispanics have a lower incidence of AF compared with non-Hispanic whites, referred to as the “racial paradox”. Therefore, we externally validated both the FHS and CHARGE-AF risk prediction models in an underserved inner-city population comparing the performance of these models among Hispanics, African-Americans, and non-Hispanic whites.
Methods
This study is a retrospective, epidemiologic, external validation study of the FHS and CHARGE-AF prediction models for AF in both inpatient and outpatients (n = 239,741) with n = 1,239,593 cumulative electrocardiograms (ECGs) obtained at the Montefiore Medical Center from January 1, 2000, to September 8, 2013. Patients were included if their age was >45 and <95 years. Patients were excluded if they had AF on their initial ECG, 1 ECG, or incomplete covariate data per FHS and CHARGE-AF risk equations (see list of necessary covariate data as mentioned subsequently, which is different between FHS and CHARGE-AF). See Figures 1 and 2 for cohort selection. Patients with atrial flutter were not excluded from this analysis.


Race/ethnicity was self-reported, and all race/ethnic categories were mutually exclusive. We used the term race/ethnicity as Hispanics are generally considered to be a multiracial group, composed largely of white and also African-American and other races.
Our validation population consists largely of an inner-city population in the Bronx County, New York. The Bronx County consists of ∼1.4 million subjects with a large minority population, consisting of a majority of Hispanics, followed by African-Americans and then non-Hispanic whites. The Bronx County is considered an underserved area with SES variables, such as high school graduation rates, higher education, and per capita income well below the national average.
The FHS prediction model was derived from a cohort of 4,764 subjects, aged 45 to 95 years. Multivariable Cox regression related clinical variables to 10-year AF incidence (c-statistic = 0.78; 95% confidence interval [CI] 0.76 to 0.80). See Table 1 for a list of summarizing and weighing of the different variables for the FHS prediction model.
| Framingham Heart Study | Recalibrated Cox Model | p-value | |||
|---|---|---|---|---|---|
| Estimated β | Standard Error | Estimated β | Standard Error | ||
| Age (year) | 0.151 | 0.058 | 0.071 | 0.011 | <0.01 |
| Body mass index (kg/m 2 ) | 0.019 | 0.011 | 0.009 | 0.003 | <0.01 |
| Male sex | 1.994 | 0.393 | 0.757 | 0.122 | <0.01 |
| PR interval (10ms) | 0.071 | 0.017 | 0.047 | 0.005 | <0.01 |
| Prevalent heart failure (yes) | 9.428 | 2.270 | 2.270 | 0.274 | <0.01 |
| Significant murmur (yes) | 3.796 | 1.335 | 0.213 | 1.231 | 0.82 |
| Systolic blood pressure (mmHg) | 0.006 | 0.002 | -0.002 | 0.001 | <0.01 |
| Treatment for hypertension (yes) | 0.424 | 0.101 | -0.314 | 0.043 | <0.01 |
| Age × prevalent heart failure | -0.123 | 0.033 | -0.023 | 0.004 | <0.01 |
| Age × significant murmur | -0.042 | 0.019 | 0.251 | 0.622 | 0.71 |
| Age 2 | 0.000 | 0.000 | 0.116 | 0.720 | 0.19 |
| Male sex × age 2 | 0.000 | 0.000 | -0.019 | 0.819 | <0.01 |
The CHARGE-AF was derived from participant-specific data pooled from 3 community-based cohorts in the United States (Atherosclerosis Risk in Communities, Cardiovascular Health Study, and Framingham Heart Study ), including 18,556 subjects aged 46 to 94 years (19% African-Americans and 81% whites), and validation of this score was performed in 2 additional cohorts in Europe (Age, Gene and Environment-Reykjavik study, and the Rotterdam Study ). Multivariable Cox regression related clinical variables to 5-year AF incidence (c-statistic = 0.767; 95% CI 0.750 to 0.783). See Table 2 for a list of summarizing and weighing of the different variables for the CHARGE-AF model.
| Variable | CHARGE-AF | Recalibrated Cox Model | p-value | ||
|---|---|---|---|---|---|
| Estimated β | Standard Error | Estimated β | Standard Error | ||
| Age (5 years) | 0.501 | 0.022 | 0.217 | 0.009 | <0.01 |
| Antihypertensive medication use | 0.341 | 0.063 | -0.169 | 0.045 | <0.01 |
| Diabetes | 0.242 | 0.073 | 0.063 | 0.049 | 0.20 |
| Diastolic blood pressure (10mmg Hg) | -0.098 | 0.032 | 0.000 | 0.019 | 0.99 |
| Heart Failure (yes) | 0.678 | 0.107 | 0.621 | 0.055 | <0.01 |
| Height (10cm) | 0.243 | 0.037 | 0.045 | 0.009 | <0.01 |
| Left ventricular hypertrophy by electrocardiogram | 0.401 | 0.129 | 0.110 | 0.044 | <0.01 |
| Myocardial infarction | 0.469 | 0.090 | -1.495 | 1.010 | 0.14 |
| PR Interval (<120 vs 120 to 199) | 0.645 | 0.200 | 0.084 | 0.118 | 0.48 |
| PR Interval (>199 vs 120 to 199) | 0.118 | 0.077 | 0.402 | 0.060 | <0.01 |
| White | 0.486 | 0.094 | 0.387 | 0.049 | <0.01 |
| Smoker | 0.365 | 0.091 | -0.098 | 0.293 | 0.74 |
| Systolic blood presssure (20 mmHg) | 0.186 | 0.033 | -0.029 | 0.011 | <0.01 |
| Weight (15kg) | 0.121 | 0.033 | 0.089 | 0.015 | <0.01 |
A SES variable was determined using the New York City Department of Health Standardized Score and was calculated for each subject in the cohort. Six socioeconomic variables for each neighborhood by Zip code (log of median household income, log of median value of housing units, the percentage of households receiving interest, dividend, or net rental income, education, the percentage of adults who completed college, and the percentage of employed subjects in executive, managerial, or professional positions) were normalized (Z scored) to the New York State average. A combined Z-score of the 6 was calculated for each patient and reported by racial/ethnic cohort. Z-scores were reported as opposed to percentages to maintain a continuous distribution relative to the New York State average and for easier visual discernment as most subjects were <1%.
Follow-up started from the initial ECG. For those who developed AF, days were counted from initial normal sinus ECG to the first ECG that demonstrated AF. For those who did not develop AF, survival days were counted from initial normal sinus ECG until the last normal sinus ECG.
Diagnosis of AF was determined by ECG. Montefiore Medical Center uses a computerized electrocardiographic system (GE Healthcare, Wauwatosa, Wisconsin) to collect, store, and analyze ECGs. This system is widely used and has been validated by the Food and Drug Administration and meets all applicable standards for computerized electrocardiographic analysis at rest. The computerized system includes the 12SL program for automated electrocardiographic interpretation, which was used in this study. To determine the presence of AF, the 12SL algorithm looks for an irregular rhythm or fibrillatory waves without the presence of particular concurrent abnormal rhythms. Specifically, this algorithm requires one of the following test statements to be true:
- 1.
An irregularly irregular ventricular response (range of RR intervals >15% of average RR interval and RR intervals not organized) and no regular atrial rhythm detected or
- 2.
Atrial rate >400.
The 12SL algorithm to detect AF has been validated in multiple studies with a reported sensitivity of 90.8% and a specificity of 98.9%. All ECGs were reviewed and diagnosis of AF confirmed by board-certified cardiologists for clinical purposes. Other clinical variables were extracted by searching the electronic medical records system.
Descriptive statistics were produced for each cohort considered separately. Estimates of AF rates were produced for each cohort—5 years in CHARGE-AF and 10 years in FHS. Unpaired 2-sided t tests were used for the comparisons of continuous variables, and the chi-square tests were used to compare dichotomous variables between patients. Analysis of variance was performed between continuous variables by race. Statistical significance was defined by p <0.05.
Risk equations were ascertained by the following equation per subject:
Stay updated, free articles. Join our Telegram channel

Full access? Get Clinical Tree


