Frailty has become high-priority theme in cardiovascular diseases because of aging and increasingly complex nature of patients. Low muscle mass is characteristic of frailty, in which invasive interventions are avoided if possible because of decreased physiological reserve. This study aimed to determine if the psoas muscle area (PMA) could predict mortality and to investigate its utility in patients who underwent transcatheter aortic valve replacement (TAVR). We retrospectively reviewed 232 consecutive patients who underwent TAVR. Cross-sectional areas of the psoas muscles at the level of fourth lumbar vertebra were measured by computed tomography and normalized to body surface area. Patients were divided into tertiles according to the normalized PMA for each gender (men: tertile 1, 1,708 to 1,178 mm 2 /m 2 ; tertile 2, 1,176 to 1,011 mm 2 /m 2 ; and tertile 3, 1,009 to 587 mm 2 /m 2 ; women: tertile 1, 1,436 to 962 mm 2 /m 2 ; tertile 2, 952 to 807 mm 2 /m 2 ; and tertile 3, 806 to 527 mm 2 /m 2 ). Smaller normalized PMA was independently correlated with women and higher New York Heart Association classification. After adjustment for multiple confounding factors, the normalized PMA tertile was independently associated with mortality at 6 months (adjusted hazard ratio 1.53, 95% confidence interval 1.06 to 2.21). Kaplan–Meier analysis showed that tertile 3 had higher mortality rates than tertile 1 at 6 months (14% and 31%, respectively, p = 0.029). Receiver-operating characteristic analysis showed that normalized PMA provided the increase of C -statistics for predicting mortality for a clinical model and gait speed. In conclusion, PMA is an independent predictor of mortality after TAVR and can complement a clinical model and gait speed.
In the Placement of Aortic Transcatheter Valve (PARTNER) trial and the Transcatheter Valve Therapy (STS/ACC TVT) registry, mortality was quite high, particularly for inoperable patients who had transcatheter aortic valve replacement (TAVR), and appropriate patient selection is required. Frailty has become high-priority theme in cardiovascular diseases because of aging and increasingly complex nature of patients. Low muscle mass is characteristic of frailty, in which invasive interventions are avoided if possible because of decreased physiological reserve and vulnerability to stressors. Recently, the psoas muscle area (PMA), as measured on computed tomography (CT), has been shown to be related to poor outcomes after TAVR. However, according to the European Working Group on Sarcopenia in Older People (EWGSOP), low muscle mass defined as sarcopenia should be assessed by muscle volume obtained by imaging study in combination of functional test such as gait speed, and its utility remains unclear in this population. The purpose of this study was to determine if PMA could predict mortality and to investigate its utility and relation between other frailty markers in patients undergoing TAVR.
Methods
The study population comprised 236 consecutive patients with severe aortic stenosis who underwent TAVR at the University of Virginia from March 2009 to May 2015. CT scans of the chest, abdomen, and pelvis were obtained for all patients to determine the appropriate method of access, and 232 of these were of sufficient quality to allow for comprehensive analysis of the PMA irrespective of the use of intravenous contrast. The treatment initially was determined according to the protocol defined by the PARTNER and PARTNER II trials. After the SAPIEN and SAPIEN XT valves (Edwards Lifesciences, Irvine, California) received the US commercial approval, treatment was performed with their use according to American Heart Association/American College of Cardiology (AHA/ACC) guidelines. Ninety patients received an experimental replacement valve as part of a trial; the other 142 received a commercially approved valve. After June 2012, gait speed was routinely evaluated before the procedure (n = 121) and evaluated in a subanalysis. All cases were reviewed by a multidisciplinary team consisting of cardiac surgeons, interventional cardiologists, and imaging specialists and deemed to be high risk (n = 115) or inoperable (n = 117). The Society of Thoracic Surgeons (STS) risk score was calculated in each patient. Our institutional review board approved the study. All information was retrospectively obtained from patients’ medical records. In addition, the Social Security Death Index was searched to confirm all deaths and to check for patients lost to follow-up.
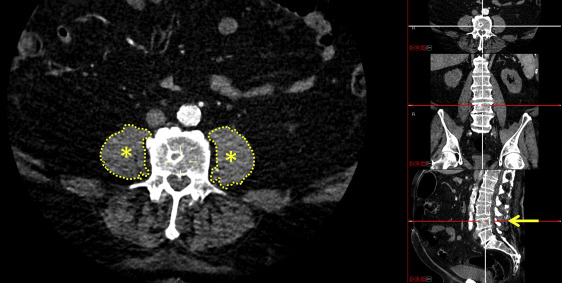
Data analyses were completed before the procedure using images collected by SOMATOM Definition Flash (Siemens Healthcare, Erlangen, Germany) or LightSpeed (GE Healthcare, Little Chalfont, United Kingdom) CT scanners. PMA was analyzed in a blinded fashion by 2 experienced assessors (M.S. and S.L.). Specifically, the cross-sectional areas of the right and left psoas muscles were measured at the level of the fourth lumbar vertebra (L4) ( Figure 1 ) ; the Carestream Vue Picture Archiving and Communication System radiology software program (version 11.3, Carestream Health, Rochester, New York) was used to manually outline the borders of the right and left psoas on individual CT image slices showing the superior aspect of the L4. The areas of the resulting enclosed regions were computed and summed to find the total cross-sectional area of the psoas muscles. To account for the potential inclusion of fat or other tissue within or around the PMA, density thresholds from −30 to 150 Hounsfield units, consistent with a previous study, were used. PMAs retrieved from 24 randomly selected data files were measured by another observer to determine the interobserver agreement and then again by the original observers (on a different day) to determine the intraobserver agreement; in both cases, the observers were blinded to the previous measurements.
Participants were instructed to walk at a comfortable pace in a well-lit, unobstructed hallway for a distance of 5 m. Patients were permitted to use assist devices such as walkers and canes. Gait speed was calculated by dividing 5 m by the time needed to walk this distance in seconds. Patients repeated the walk 3 times, if possible, and their mean speed was calculated. Patients unable to walk the distance due to shortness of breath or desaturation at rest were recorded as having a gait speed of 0 m/s.
The primary end points were all-cause mortality at 30 days and 6 months. Echocardiographic findings were analyzed by full-time academic echocardiographers using AHA/ACC guidelines. Co-morbidities were defined according to the STS criteria, and procedural complications were defined according to the Valve Academic Research Consortium 2 Criteria. Device success was defined as the absence of procedural mortality, correct positioning of a single prosthetic valve, and intended performance of the prosthetic valve. The early combined safety end-point at 30 days includes all-cause mortality, all stroke, life-threatening bleeding, acute kidney injury (stages 2 or 3), coronary obstruction requiring intervention, major vascular complications, and valve-related dysfunction requiring a repeat procedure. TAVR was performed as previously described.
Continuous variables were expressed as the mean ± standard deviation, and categorical variables as the number and percentage. Normality of distribution for continuous variables was tested using the Shapiro–Wilk test. Because measured PMA values (mm 2 ) were better correlated with body surface area (BSA; r = 0.699) than other body component measurements such as body mass index ( r = 0.363), the measured PMA values (mm 2 ) were normalized by dividing PMA by BSA (mm 2 /m 2 ) to measure the relative muscle mass. Additionally, because normalized PMA was related to gender (shown in results section), patients were divided into tertiles according to normalized PMA for each gender (men: tertile 1, 1,708 to 1,178 mm 2 /m 2 ; tertile 2, 1,176 to 1,011 mm 2 /m 2 ; and tertile 3, 1,009 to 587 mm 2 /m 2 ; women: and tertile 1, 1,436 to 962 mm 2 /m 2 ; tertile 2, 952 to 807 mm 2 /m 2 ; and tertile 3, 806 to 527 mm 2 /m 2 ). The 3 groups were compared using the chi-square test (categorical covariates) or one-way analysis of variance and the Kruskal–Wallis test (continuous covariates; Tables 1 and 2 . A 2-sided p value <0.05 was considered statistically significant. Associations between normalized PMA and all variables provided in Table 1 were assessed using univariate linear regression; variables with p values <0.15 on this analysis were entered into a multivariate regression model and further assessed to determine whether they were independently correlated with normalized PMA ( Table 3 ). To determine the influence on the relation between mortality, variables (provided in Table 1 ) with p values <0.05 on univariate analysis were entered into multivariate Cox proportional hazards model. Kaplan–Meier analysis was used to estimate the cumulative mortality in each PMA tertile. Receiver-operating characteristic (ROC) analysis was performed using mortality at 6 months, and the area under the curve ( C -statistic) was assessed using the clinical model and the DeLong method. The clinical model included the variables that were identified as independent predictors in multivariate analysis, provided in Table 4 . Because the characteristics of participants with gait speed were similar to those without gait speed ( Supplementary Tables 1 and 2 ), the same tertile criteria were applied for the subanalysis. Additionally, the patients were divided into 2 groups using a cutoff gait speed value of 0.5 m/s because the general cut-off value of 0.8 m/s was not validated in this study (best cut-off value: 0.5 m/s derived from ROC curve). Intraobserver and interobserver agreement values were evaluated by calculating the intraclass correlation coefficients (ICC), with excellent agreement defined as ICC >0.8. All analyses were performed using SPSS version 22.0 (IBM, Armonk, New York) and R version 2.13 (R Foundation for Statistical Computing).
| Characteristic | Overall (n = 232) | Normalized psoas muscle area | p-value | ||
|---|---|---|---|---|---|
| Tertile 1 (n = 77) | Tertile 2 (n = 78) | Tertile 3 (n = 77) | |||
| Age (years) | 80.1 ± 8.7 | 78.7 ± 9.2 | 81.6 ± 7.2 | 79.8 ± 9.4 | 0.148 |
| Men | 132 (57%) | 44 (57%) | 44 (56%) | 44 (57% | 0.994 |
| Body mass index (kg/m 2 ) | 28.1 ± 7.1 | 28.5 ± 7.5 | 28.2 ± 6.3 | 27.7 ± 7.7 | 0.473 |
| Normalized psoas muscle area (mm 2 /m 2 ) | 1016 ± 229 | 1237 ± 202 | 999 ± 115 | 813 ± 119 | <0.001 |
| NYHA classification III/IV | 154 (66%) | 47 (61%) | 49 (63%) | 58 (75%) | 0.123 |
| STS score (%) | 8.5 ± 4.6 | 8.2 ± 4.7 | 9.2 ± 5.2 | 8.2 ± 3.9 | 0.429 |
| Inoperable | 117 (50%) | 39 (51%) | 39 (50%) | 39 (51%) | 0.996 |
| Diabetes mellitus | 97 (42%) | 34 (44%) | 33 (42%) | 30 (39%) | 0.803 |
| Hypertension | 171 (74%) | 55 (71%) | 59 (76%) | 57 (74%) | 0.835 |
| Dyslipidemia | 136 (59%) | 43 (56%) | 51 (65%) | 42 (55%) | 0.326 |
| Coronary artery disease | 145 (63%) | 51 (66%) | 49 (63%) | 45 (58%) | 0.606 |
| Previous MI | 34 (15%) | 16 (21%) | 5 (6.4%) | 13 (17%) | 0.032 |
| Previous PCI | 56 (24%) | 22 (29%) | 13 (17%) | 21 (27%) | 0.164 |
| Previous cardiac surgery | 110 (47%) | 40 (52%) | 37 (47%) | 33 (43%) | 0.528 |
| Peripheral artery disease | 61 (26%) | 15 (19%) | 18 (23%) | 28 (36%) | 0.043 |
| Previous stroke | 23 (9.9%) | 6 (7.7%) | 9 (12%) | 8 (10%) | 0.727 |
| Previous pacemaker implantation | 35 (15%) | 11 (14%) | 11 (14%) | 13 (17%) | 0.864 |
| Atrial fibrillation | 97 (42%) | 30 (39%) | 33 (42%) | 34 (44%) | 0.803 |
| COPD (moderate/severe) | 47 (20%) | 18 (23%) | 18 (23%) | 11 (14%) | 0.280 |
| Hemoglobin level (g/dL) | 11.7 ± 1.74 | 11.8 ± 1.8 | 11.5 ± 1.5 | 11.8 ± 1.8 | 0.416 |
| eGFR (mL/min/1.73 m 2 ) | 56.5 ± 24.3 | 59.8 ± 24.5 | 51.8 ± 23.6 | 57.9 ± 24.5 | 0.087 |
| Albumin level (g/dL) | 3.7 ± 0.3 | 3.7 ± 0.4 | 3.7 ± 0.4 | 3.8 ± 0.4 | 0.648 |
| Gait speed (m/s) ∗ | 0.5 ± 0.3 | 0.5 ± 0.3 | 0.5 ± 0.3 | 0.5 ± 0.3 | 0.884 |
| Excluding patients who cannot walk † | 0.7 ± 0.2 | 0.7 ± 0.1 | 0.7 ± 0.2 | 0.7 ± 0.2 | 0.658 |
| Ejection fraction (%) | 48.3 ± 14.0 | 50.6 ± 13.1 | 48.4 ± 12.9 | 45.9 ± 15.7 | 0.156 |
| AVA (cm 2 ) | 0.66 ± 0.15 | 0.68 ± 0.15 | 0.62 ± 0.13 | 0.66 ± 0.16 | 0.066 |
| Mean gradient (mm Hg) | 44.7 ± 13.1 | 44.7 ± 12.8 | 45.0 ± 13.1 | 44.3 ± 13.7 | 0.912 |
| MR (moderate/severe) | 26 (11%) | 8 (10%) | 9 (12%) | 9 (12%) | 0.948 |
| Pulmonary artery pressure (mm Hg) | 43.6 ± 14.2 | 43.6 ± 15.0 | 45.3 ± 15.3 | 42.0 ± 12.0 | 0.648 |
∗ Tertile 1, n = 40, Tertile 2, n = 43, Tertile 3, n = 38 (total n = 121).
| Outcome | Overall (n = 232) | Psoas muscle area | p-value | ||
|---|---|---|---|---|---|
| Tertile 1 (n = 77) | Tertile 2 (n = 78) | Tertile 3 (n = 77) | |||
| Transfemoral approach | 141 (61%) | 45 (58%) | 50 (64%) | 46 (60%) | 0.751 |
| Valve size = 23 mm | 91 (39%) | 27 (35%) | 32 (41%) | 32 (42%) | 0.657 |
| Valve size = 26 mm | 120 (52%) | 44 (57%) | 34 (44%) | 42 (55%) | 0.201 |
| Valve size = 29 mm | 21 (9.0%) | 6 (7.7%) | 12 (15%) | 3 (3.8%) | 0.040 |
| Length of stay after TAVR (days) | 6.9 ± 7.0 | 7.0 ± 6.4 | 6.7 ± 7.1 | 7.1 ± 7.6 | 0.863 |
| Device success | 225 (97%) | 75 (97%) | 74 (95%) | 76 (99%) | 0.409 |
| Mortality at 30 days | 17 (7.3%) | 4 (5.1%) | 7 (8.9%) | 6 (7.7%) | 0.653 |
| Mortality at 6 months | 48 (21%) | 10 (13%) | 16 (21%) | 22 (29%) | 0.058 |
| Early combined safety endpoint at 30 days | 67 (29%) | 21 (27%) | 20 (26%) | 26 (34%) | 0.499 |
| All stroke | 11 (4.7%) | 2 (2.5%) | 3 (3.8%) | 6 (7.7%) | 0.093 |
| Life-threatening bleeding | 15 (6.4%) | 2 (2.5%) | 6 (7.6%) | 7 (9.0%) | 0.070 |
| Acute kidney injury (AKIN stage 2 or 3) | 35 (15%) | 12 (16%) | 9 (12%) | 14 (18%) | 0.507 |
| Coronary obstruction requiring intervention | 0 (0%) | 0 (0%) | 0 (0%) | 0 (0%) | 1.000 |
| Major vascular complication | 22 (9.4%) | 6 (7.7%) | 6 (7.6%) | 10 (13%) | 0.438 |
| Valve-related dysfunction requiring repeat procedure | 6 (2.5%) | 2 (2.5%) | 3 (3.8%) | 1 (1.2%) | 0.402 |
| Postprocedural AI (moderate/severe) | 14 (6.0%) | 3 (3.8%) | 6 (7.6%) | 5 (6.4%) | 0.308 |
Stay updated, free articles. Join our Telegram channel

Full access? Get Clinical Tree


