Patients with genetic cardiomyopathy that involves myocardial hypertrophy often develop clinically relevant arrhythmias that increase the risk of sudden death. Consequently, guidelines for medical device therapy were established for hypertrophic cardiomyopathy, but not for conditions with only anecdotal evidence of arrhythmias, like Fabry cardiomyopathy. Patients with Fabry cardiomyopathy progressively develop myocardial fibrosis, and sudden cardiac death occurs regularly. Because 24-hour Holter electrocardiograms (ECGs) might not detect clinically important arrhythmias, we tested an implanted loop recorder for continuous heart rhythm surveillance and determined its impact on therapy. This prospective study included 16 patients (12 men) with advanced Fabry cardiomyopathy, relevant hypertrophy, and replacement fibrosis in “loco typico.” No patients previously exhibited clinically relevant arrhythmias on Holter ECGs. Patients received an implantable loop recorder and were prospectively followed with telemedicine for a median of 1.2 years (range 0.3 to 2.0 years). The primary end point was a clinically meaningful event, which required a therapy change, captured with the loop recorder. Patients submitted data regularly (14 ± 11 times per month). During follow-up, 21 events were detected (including 4 asystole, i.e., ECG pauses ≥3 seconds) and 7 bradycardia events; 5 episodes of intermittent atrial fibrillation (>3 minutes) and 5 episodes of ventricular tachycardia (3 sustained and 2 nonsustained). Subsequently, as defined in the primary end point, 15 events leaded to a change of therapy. These patients required therapy with a pacemaker or cardioverter–defibrillator implantation and/or anticoagulation therapy for atrial fibrillation. In conclusion, clinically relevant arrhythmias that require further device and/or medical therapy are often missed with Holter ECGs in patients with advanced stage Fabry cardiomyopathy, but they can be detected by telemonitoring with an implantable loop recorder.
Fabry disease is an X-linked lysosomal storage disorder that results from a deficiency in alpha-galactosidase A. The cardiac pathogenetic correlate is the accumulation of globotriaosylceramides in cells, which causes left ventricular (LV) hypertrophy and finally leads to myocardial replacement fibrosis. In these fibrotic hearts, life-threatening arrhythmias can develop. Thus, patients at risk should be evaluated regularly for potential arrhythmia treatments. The current recommendations for managing patients with confirmed Fabry disease include an annual Holter electrocardiogram (ECG) assessment to detect different types of advanced arrhythmias that indicate a potential need to switch therapy. The Holter ECG covers only a relatively short period; therefore, it might be beneficial to implement continuous surveillance for potential arrhythmias in patients at high risk for severe arrhythmias. Several implantable devices are available for continuous rhythm surveillance, such as the Reveal XT device (Medtronic, Minneapolis, Minnesota). These devices reliably facilitate the detection of cardiac arrhythmias in routine clinical care. However, the role of these devices in improving the detection of relevant cardiac arrhythmias that require a change in clinical management, such as ventricular tachycardia (VT), bradycardia, and atrial fibrillation (AF), remains to be determined in patients with Fabry disease. Therefore, the present study aimed to investigate whether an implantable loop recorder with telemonitoring capabilities could reveal events that required a change in clinical management in patients at risk of developing clinically relevant arrhythmias associated with advanced Fabry cardiomyopathy.
Methods
Study recruitment started in June 2012 and ended in September 2014. A total of 120 consecutive patients with Fabry cardiomyopathy were screened in the Fabry centers in Würzburg and Berlin. Criteria for inclusion were (1) genetically proved Fabry disease, (2) signs of severe LV fibrosis (defined in the following section), (3) no previous detectable clinically relevant arrhythmia (defined in the following section) on Holter ECG, (4) stable treatment with enzyme replacement therapy for at least 12 months, and (5) informed consent for examinations and participation in the study. All these criteria had to be met for enrollment in the study. Exclusion criteria were (1) anticoagulation treatment due to AF, (2) an implanted pacemaker or cardioverter–defibrillator (ICD), and (3) signs of AF or VT in the past.
Severe fibrosis was defined as the presence of at least 2 segments of late enhancement (LE) during cardiac magnetic resonance imaging (cMRI) or wall motion abnormalities combined with wall thinning in at least 2 LV segments after exclusion of coronary artery disease (CAD) with heart catheterization. In all patients with signs or symptoms of CAD (i.e., by a stress test), a heart catheterization was performed to rule out CAD. We defined a clinically relevant arrhythmia as (1) bradycardia with a heart rate ≤40 beats/min during the day, which indicated a need for pacing therapy; (2) an electrical ventricular pause ≥3 seconds during the day, which indicated a need for pacing therapy; (3) sustained (>30 seconds) or symptomatic nonsustained (<30 seconds) VT, which indicated a need for an ICD; or (4) AF that lasted at least 3 minutes, which indicated a need for anticoagulation.
Of the 120 patients screened, 22 fulfilled the inclusion criteria, and 6 refused to participate. Consequently, this prospective study included 16 consecutive patients (4 women) who were considered “at risk” of developing clinically relevant arrhythmias. At baseline, before loop recorder implantation, an echocardiography, cMRI (when not contraindicated), Holter ECG, and clinical assessment were performed in all patients. A yearly follow-up was conducted with the same assessments performed in the baseline visit. All patients were asked to transmit data from the loop recorder by telephone as often as possible. The loop recorder was explanted when a patient required implantation of an ICD or pacemaker. According to the Declaration of Helsinki, we obtained written informed consent for all patients or their guardians. The local institutional ethics board approved the study protocol.
We performed LV parasternal long-axis imaging with M-Mode echocardiography (Vivid 7, GE Vingmed Ultrasound AS, Horten, Norway) to determine the end-diastolic septal (interventricular septal wall thickness at end diastole [IVSd]) and posterior wall thicknesses. In addition, we measured the left atrial (LA) diameter, and we calculated the LV ejection fraction with Simpson’s formula. We used blood pool pulsed Doppler of the mitral valve inflow to quantify the ratio of early-to-late (E/A) diastolic flow velocity and the deceleration time. The transmitral flow was determined by placing the Doppler window between the tips of the mitral valve leaflets; we measured the peak flow velocities in early (E wave) and late (A wave) systole. In addition, tissue Doppler was performed for measuring the ratio between early transmitral flow and peak early tissue Doppler velocity (E/E′). Measurements were averaged over 3 cycles.
We performed 2-dimensional speckle tracking with an EchoPAC (GE Vingmed Ultrasound AS, Horten, Norway) to acquire standard apical views of the LV for off-line quantification of myocardial deformation. After manually selecting the Region of Interest, speckles were applied automatically and then confirmed by the user. We used semiautomatic postprocessing to extract the longitudinal systolic strain of the 17 LV segments.
We performed cMRI to quantify myocardial mass and cardiac volumes with standard, steady state free precession cine imaging sequences on a 1.5 T whole body scanner (Magnetom Avanto, Siemens Medical Systems, Erlangen, Germany). To detect myocardial fibrosis, we acquired delayed enhancement images after an intravenous injection of gadopentetate dimeglumine (0.2 mmol/kg; Magnevist, Schering AG, Berlin, Germany). We used a T1-weighted inversion recovery sequence with the breath hold technique (field of view 240 × 320 mm 2 , matrix size 165 × 256, slice thickness 8 mm, repetition time 7.5 ms, echo time 3.4 ms, and flip angle 25°). Care was taken to use identical settings in the baseline and follow-up examinations for a given patient. All consecutive, short-axis slices covering the whole heart were used to measure the area with pathological LE. The sum of areas that showed LE was multiplied by the slice thickness, and then expressed as a percentage of the LV myocardium volume.
Twelve-lead surface resting ECGs were recorded at a sweep of 50 mm/s. ECGs were measured manually and analyzed by a reader who was blinded to the disease stage. Standard criteria for ECG findings were applied, as follows: A normal PR interval was defined as 120 to 200 ms. A normal QRS duration was defined as 70 to 110 ms. LV hypertrophy was assessed with the Sokolow–Lyon index, where the S wave in lead V1 or V2 (whichever was larger) was added to the R wave in lead V5 or V6 (whichever was larger), with a minimum cutoff of 3.5 mV. The QT interval (normal 300 to 440 ms) was measured from the beginning of the QRS complex to the end of the T wave, which was defined as the point where the tangent to the downslope of the T wave intersected the isoelectric line. The corrected QT duration (normal <440 ms) was calculated with the Bazett’s formula. For negative or biphasic T waves, the peak was measured from the nadir of the T wave. ST-segment elevation was defined as a J point elevation that was ≥2 mm in the precordial leads and ≥1 mm in the limb leads. ST-segment decrease was defined as a J point decrease that was ≥1.5 mm in the precordial leads and ≥1 mm in the limb leads.
The Holter ECG was started between 8 a.m. and 10 a.m. and continued for a mean of 22.3 hours. The data were analyzed by a reader blinded to the disease stage. Premature ventricular beats (PVBs) were counted automatically, with manual correction. All counts were then corrected to a fictive duration of exactly 24 hours. PVB were classified as ventricular or supraventricular in origin, and they were ranked as a singlet, couplet, triplet, or run. A run was defined as more than 3 PVBs in a row.
All patients received identical loop recorders with telemedicine capabilities (Reveal XT; Medtronic). Immediately before the surgical procedure, patients were screened for an eligible implant position in the body with the vendor-supplied dermal ECG vector measurement tool. All patients showed good signal quality at the parasternal left position. After aseptic preparation and local anesthesia, an incision approximately 3 cm long was made parasternal left. Then, a subfascial pouch 8 to 10 cm long in the caudal direction was prepared with blunt dissection. The Reveal device was inserted and fixed by muscular ligation with Mersilene. The incision was closed with Vicryl subcutan and Prolene intracutan. Then, the device was interrogated and activated with the external programmer. Directly after the implantation procedure, the settings were programmed according to the study specifications (fast ventricular tachycardia: detection: on; ECG recording: on; interval: 290 ms, 30/40 beats; VT: detection: on; ECG recording: on; interval: 370 ms, 16 beats; asystole: detection: on; ECG recording: on; bradycardia: detection: on; ECG recording: on; interval: 1,500 ms, 4 beats; symptoms: detection: on; ECG recording: 3 episodes – 7.5 minutes; atrial tachycardia/AF: detection: on; ECG recording: on – all episodes). All patients received a corresponding transmitter. We requested that they should transfer data daily, whenever possible. Transmitted data were interrogated at the study center daily (on workdays) through an electronic internet platform.
Continuous data are presented as the mean (SD); categorical variables are presented as numbers (percentages). Categorical data were compared across groups with the chi-square test. A 2-tailed probability value <0.05 was considered significant. Statistical analysis was performed with IBM SPSS, version 22 for Windows (SPSS, IBM, Chicago, Illinois).
Results
Table 1 lists the genetic and clinical data for every individual patient and information about their typical Fabry organ involvement. Fifteen patients had a classical mutation, and one patient had a late-onset mutation, which typically presents as a cardiac variant. Most patients were men (75%), and all had markedly elevated levels of globotriaosylsphingosine (Lyso-Gb3; mean 36.3 ± 32 ng/ml). The mean age was 52 ± 11 years, and all were on enzyme replacement therapy for at least 2 years. All patients submitted the data regularly, at a rate of 14 ± 11 times per month. After device implantation, patients were prospectively followed with telemedicine for a median of 1.2 years (range 0.3 to 2.0 years), and no patient died during follow-up.
| Patient number | Genetics | Age (years) | Sex | Height (cm) | Weight (kg) | Gal-A activation (nmol/min/mg) | lysoGb3 (ng/ml) | ERT for (years) | Kidney TX | Dialysis | GFR (MDRD) (ml/min/1.73 m 2 ) | TIA/Stroke ∗ | Dyshidrosis | Angiokeratoma |
|---|---|---|---|---|---|---|---|---|---|---|---|---|---|---|
| 1 | Exon7. Mutation E341 K | 53 | M | 185 | 57 | 0.03 | 63.1 | 10 | 0 | 0 | 83 | + | + | + |
| 2 | Exon 7. Del c.1221 delA | 58 | F | 163 | 56 | 0.14 | 18.7 | 3 | 0 | 0 | 55 | 0 | 0 | 0 |
| 3 | Exon3. Mutation D136 E | 70 | F | 165 | 71 | 0.15 | 11.2 | 10 | 0 | 0 | 76 | 0 | 0 | 0 |
| 4 | Intron 3. IVS3+1 G > A | 45 | M | 184 | 75 | 0.04 | 21.2 | 12 | + | 0 | 47 | 0 | + | 0 |
| 5 | Exon 7. Mutation E341 K | 49 | M | 180 | 72 | 0.02 | 65.7 | 11 | 0 | 0 | 110 | 0 | + | 0 |
| 6 | Exon7. Mutation c.1208.del | 45 | M | 184 | 84 | 0.02 | 15.0 | 11 | + | + | 58 | 0 | + | + |
| 7 | Exon 7. Deletion 354 fs Del 15 bp | 54 | F | 165 | 64 | 0.19 | 10.1 | 9 | 0 | 0 | 82 | 0 | + | + |
| 8 | Transition c664A > G; Mutation N215S | 67 | M | 170 | 63 | 0.13 | 6.0 | 2 | 0 | 0 | 103 | 0 | + | + |
| 9 | Exon 1. c.162 del T | 54 | M | 177 | 78 | 0.08 | 30.6 | 13 | + | 0 | 40 | + | + | + |
| 10 | Exon 7. Mutation c.1208 del | 49 | M | 178 | 72 | 0.03 | 28.1 | 12 | 0 | 0 | 85 | 0 | + | 0 |
| 11 | Exon 1. C134T > C [L45P] | 36 | M | 193 | 83 | 0 | 63.4 | 3 | 0 | 0 | 100 | + | + | 0 |
| 12 | Exon 3. Mutation D136 E | 48 | M | 182 | 83 | 0.02 | 15.1 | 11 | + | 0 | 74 | 0 | + | 0 |
| 13 | Intron 6 Trans IVS6-10G > A Splice-Site-Mutation Mut c.1000-10G > A | 36 | M | 187 | 86 | 0.04 | 30.3 | 2 | 0 | 0 | 80 | 0 | 0 | + |
| 14 | Exon 6. c. 973 G > A Mutation G325S | 73 | F | 156 | 52 | 0.23 | 7.2 | 3 | 0 | 0 | 39 | 0 | 0 | 0 |
| 15 | c.747A > G | 56 | M | 170 | 60 | 0.03 | 74.7 | 2 | 0 | 0 | 102 | 0 | 0 | + |
| 16 | c.982 G > C | 43 | M | 148 | 68 | 0.02 | 114 | 4 | 0 | 0 | 116 | 0 | 0 | + |
∗ All TIA and stroke were not due to documented atrial fibrillation.
In Table 2 , all individual echocardiographic and cMRI data are shown with the average values. All patients showed LV hypertrophy (IVSd ≥11 mm), and all but one had visible papillary muscle thickening. One patient had a reduced ejection fraction. Seven patients had an E/E′ above 15, which suggested elevated diastolic filling pressure. The global systolic strain averaged −13 ± 5%, and systolic strain in the basal lateral wall was markedly reduced to −9±6%, a sign of both reduced regional LV function and replacement fibrosis in loco typico.
| Patient number | Echocardiography | Magnetic Resonance Imaging | ||||||||||||||||
|---|---|---|---|---|---|---|---|---|---|---|---|---|---|---|---|---|---|---|
| LVDd (mm) | LVDs (mm) | IVSd (mm) | LVPWd (mm) | EF (%) | LA (mm) | DT (ms) | E/E′ | AO root (mm) | LV hypertrophy | Thick papillary muscle | Posterior wall thinning | LVMI (g/m 2 ) | LVED Vol. (ml) | LVES Vol. (ml) | Stroke Vol. (ml) | Cardiac output (l/min) | Fibrosis (%) | |
| 1 | 45 | 27 | 12 | 12 | 59 | 38 | 283 | 15 | 39 | + | + | 0 | 146 | 152 | 37 | 115 | 6.9 | 1.23 |
| 2 | 39 | 20 | 18 | 16 | 63 | 41 | 160 | 12 | 32 | + | + | 0 | 205 | 115 | 34 | 81 | 4.6 | 1.21 |
| 3 | 46 | 35 | 11 | 7 | 61 | 37 | 228 | 19 | 35 | + | + | + | NA | NA | NA | NA | NA | NA |
| 4 | 54 | 36 | 12 | 13 | 55 | 36 | 197 | 12 | 43 | + | + | 0 | 127 | 179 | 77 | 102 | 5.9 | 2.14 |
| 5 | 45 | 29 | 11 | 11 | 73 | 36 | 224 | 13 | 37 | + | + | 0 | 77 | 135 | 35 | 100 | 6.6 | 0.74 |
| 6 | 60 | 31 | 11 | 10 | 76 | 41 | 187 | 11 | 33 | + | + | 0 | 109 | 198 | 36 | 162 | 9 | 1.12 |
| 7 | 47 | 28 | 12 | 10 | 54 | 40 | 195 | 18 | 32 | + | + | 0 | 117 | 130 | 39 | 91 | 5.6 | 2.8 |
| 8 | 55 | 42 | 13 | 7 | 59 | 42 | 181 | 10 | 42 | + | + | + | NA | NA | NA | NA | NA | NA |
| 9 | 51 | 24 | 13 | 13 | 55 | 36 | 275 | 14 | 35 | + | + | 0 | 131 | 117 | 36 | 81 | 6.1 | 4.27 |
| 10 | 39 | 24 | 13 | 11 | 68 | 37 | 301 | 14 | 34 | + | + | + | NA | NA | NA | NA | NA | NA |
| 11 | 64 | 50 | 11 | 11 | 51 | 40 | 135 | 12 | 41 | + | 0 | 0 | 107 | 263 | 140 | 123 | 6.6 | 0.65 |
| 12 | 50 | 32 | 12 | 9 | 71 | 38 | 352 | 20 | 39 | + | + | + | 111 | 180 | 58 | 122 | 6.3 | 3.92 |
| 13 | 42 | 27 | 12 | 13 | 67 | 28 | 268 | 10 | 32 | + | + | 0 | 85 | 156 | 53 | 103 | 7.7 | 1.03 |
| 14 | 47 | 23 | 14 | 13 | 70 | 41 | 181 | 16 | 28 | + | + | 0 | 133 | 110 | 26 | 84 | 5.9 | 1.86 |
| 15 | 37 | 23 | 20 | 15 | 60 | 38 | 208 | 16 | 31 | + | + | + | NA | NA | NA | NA | NA | NA |
| 16 | 39 | 25 | 17 | 18 | 63 | 36 | 256 | 19 | 34 | + | + | 0 | 183 | 107 | 33 | 70 | 4.8 | 3.21 |
| Mean | 48 ±8 | 30 ±8 | 13 ±3 | 12 ±3 | 63 ±7 | 38 ±3 | 233 ±58 | 14 ±3 | 35 ±4 | +=16 (100%) | +=15 (64%) | +=5 (31%) | 124 ±36 | 149 ±44 | 49 ±30 | 101 ±24 | 6.5 ±1.2 | 1.86 ±1.33 |
Three patients did not receive cMRIs, due to claustrophobia; one was not eligible due to terminal renal insufficiency/dialysis. All patients with cMRIs (n = 12) showed replacement fibrosis in loco typico. All patients who did not receive cMRIs had visible and quantifiable thinning of the posterior wall (defined as LV posterior wall thickness at end diastole ≥2 mm thinner than the IVSd). Figure 1 shows representative examples of echocardiography and cMRI.
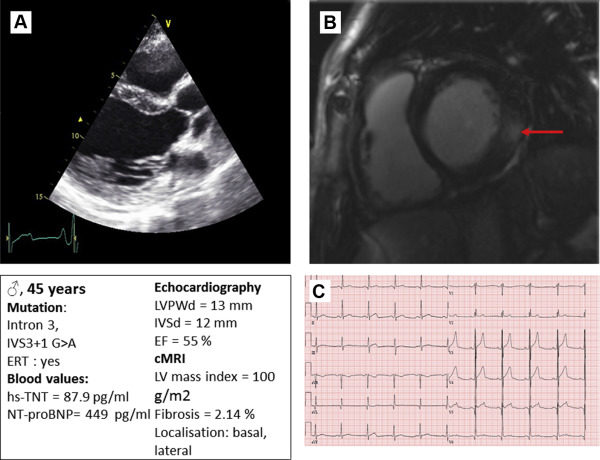
Table 3 lists the results from the ECGs at rest. Only 2 patients had a prolonged QTc interval. Seven patients had a positive LV Sokolov index for LV hypertrophy, and 11 patients had T negativities in V5 and V6. Figure 1 shows a typical ECG at rest.
| Patient number | Heart rhythm | Heart axis | Heart rate (min −1 ) | P- dur. time (ms) | PQ dur. (ms) | QRS dur. (ms) | QTc dur. (ms) | Sokolow index (+/0) | T-wave negativity (+/0) | ST elevation (+/0) |
|---|---|---|---|---|---|---|---|---|---|---|
| 1 | SR | Vertical | 56 | 100 | 120 | 130 | 425 | + | + | 0 |
| 2 | SR | Intermediate | 54 | 80 | 100 | 100 | 588 | + | + | 0 |
| 3 | SR | Intermediate | 68 | 80 | 120 | 80 | 383 | 0 | + | 0 |
| 4 | SR | Intermediate | 64 | 100 | 150 | 100 | 427 | + | 0 | 0 |
| 5 | SR | Intermediate | 64 | 100 | 120 | 100 | 392 | 0 | 0 | 0 |
| 6 | SR | Intermediate | 52 | 100 | 140 | 90 | 400 | + | 0 | 0 |
| 7 | SR | Intermediate | 50 | 110 | 140 | 120 | 420 | + | + | 0 |
| 8 | SR | Left | 52 | 80 | 160 | 130 | 437 | 0 | + | 0 |
| 9 | SR | Intermediate | 91 | 90 | 110 | 100 | 394 | + | + | 0 |
| 10 | SR | Intermediate | 78 | 80 | 80 | 100 | 388 | 0 | 0 | 0 |
| 11 | SR | Intermediate | 52 | 110 | 180 | 120 | 382 | + | 0 | 0 |
| 12 | SR | Left | 72 | 100 | 110 | 110 | 427 | 0 | + | 0 |
| 13 | SR | Left | 54 | 100 | 110 | 100 | 379 | 0 | + | 0 |
| 14 | SR | Left | 58 | 100 | 160 | 160 | 492 | 0 | + | 0 |
| 15 | SR | Intermediate | 64 | 90 | 150 | 110 | 434 | 0 | + | 0 |
| 16 | SR | Intermediate | 80 | 80 | 130 | 100 | 439 | 0 | + | 0 |
| Mean | 63±12 | 95±11 | 130±26 | 109±19 | 426±53 | +=7(44%) | +=11(67%) | +=0 (0%) |
Stay updated, free articles. Join our Telegram channel

Full access? Get Clinical Tree


