The lack of practical method for quantifying myocardial territories has made it difficult to link anatomic lesion morphology to the hemodynamic significance of coronary artery stenosis. The aim of this study was to develop and validate mathematically derived morphologic criteria for predicting fractional flow reserve (FFR) <0.80 using intravascular ultrasound (IVUS) parameters and a coronary artery–based myocardial segmentation (CAMS) of the affected myocardial territory. Coronary computed tomography angiography, IVUS, and FFR data were analyzed in 103 non–left main intermediate coronary artery lesions (30% to 80% of angiographic stenosis). Using CAMS method, the total left ventricular myocardial volume and the myocardial volume subtended by a stenotic coronary segment ( V sub ) were assessed. The morphologic criteria for detecting an FFR <0.80 using the IVUS and CAMS parameters were mathematically derived. Overall, an IVUS-measured minimal lumen area (MLA) <2.79 mm 2 predicted an FFR <0.80 with sensitivity of 76%, specificity of 78%, positive predictive value of 71%, and negative predictive value of 82%. A V sub /MLA 2 >4.04 best predicted an FFR <0.80 (sensitivity 88%, specificity 90%, positive predictive value 86%, and negative predictive value 92%, area under curve = 0.944). There was a significant difference in the areas under the curves between IVUS-MLA versus V sub /MLA 2 (difference = 0.068, p = 0.005). Conversely, adjusting for body or vessel size did not improve the diagnostic accuracy.
Because revascularization treatment based on objective evaluation of ischemia improves clinical outcomes, fractional flow reserve (FFR), a standard tool for lesion-specific physiologic assessment has been used to decide whether to treat intermediate coronary artery lesions or not. Intravascular ultrasound (IVUS) is useful for assessing lesion morphology and optimizing stent procedures, but integrating both anatomic and physiologic measurements remains challenging. The IVUS-measured minimal lumen area (IVUS-MLA), one of many clinical and local determinants of functional significance, cannot accurately predict an FFR of less than 0.75 to 0.80. One of the main reasons is that supplied myocardial territories are variable, and there is no reliable method to quantify the amount of myocardium subtended by a specific stenosis. Previous approaches using subgroup-specific IVUS-MLA criteria (based on vessel size and lesion location) and adjusting for body surface area or overall left ventricular mass failed to improve the accuracy for predicting an FFR <0.80. Recently, a semiautomated, coronary artery–based myocardial segmentation (CAMS) method using coronary computed tomography angiography was developed to quantify the myocardium subtended to a specific coronary segment. The aim of the present study was to develop and validate mathematically derived morphologic criteria for predicting FFR <0.80 using IVUS parameters and CAMS-derived assessments of the affected myocardial territory in patients with intermediate non–left main coronary artery disease.
Methods
From February 2012 to September 2014, 130 consecutive patients underwent coronary computed tomography angiography, invasive coronary angiography, IVUS, and FFR assessment before intervention at Asan Medical Center (Seoul, Korea) and were enrolled in a prospective cohort study registered with the Perfusion CT Registry ( ClinicalTrials.gov , number NCT 1696006). Patients with at least one intermediate coronary lesion (angiographic diameter stenosis of 30% to 80% on visual estimation) were included. The exclusion criteria comprised in-stent restenosis, left main coronary artery or side branch lesions, Thrombolysis In Myocardial Infarction flow <3, thrombus-containing lesions, small vessel (<2.5 mm on angiography), tandem lesions, and cases in which the IVUS imaging catheter or FFR guidewire failed to cross the lesion. In addition, patients with myocardial infarction, scarred myocardium, regional wall motion abnormality, left ventricular hypertrophy, or a left main coronary artery stenosis >30% (by visual estimation) and those with poor quality images were also excluded. Thus, the final analysis included 69 patients with 103 intermediate lesions assessed by coronary computed tomography angiography, invasive coronary angiography, IVUS, and FFR.
“Equalizing” was performed with the guidewire sensor positioned at the guiding catheter tip. A 0.014-inch FFR pressure guidewire (Radi; St. Jude Medical, Uppsala, Sweden) was then advanced distal to the stenosis. The FFR was measured at the maximum hyperemia induced by an intravenous infusion administered through a central vein of adenosine at 140 μg/kg/min and increased to 200 μg/kg/min to enhance detection of hemodynamically relevant stenoses. Hyperemic pressure pullback recordings were performed as described previously. The stenosis was considered functionally significant when the FFR was <0.80.
Quantitative coronary angiography (QCA) was performed using standard techniques with automated edge detection algorithms (CAAS-5; Pie Medical, Maastricht, the Netherlands). Angiographic diameter stenosis, minimal lumen diameter (MLD), lesion length, and the lumen diameters of the proximal and distal reference segments were measured.
After FFR assessment and intracoronary administration of 0.2 mg nitroglycerin, IVUS imaging was performed using motorized transducer pullback (0.5 mm/s) and a commercial scanner (Boston Scientific Scimed, Inc., Minneapolis, Minnesota) with a rotating, 40-MHz transducer within a 3.2-French imaging sheath. Using computerized planimetry (EchoPlaque 3.0; Indec Systems, Mountain View, California), offline quantitative IVUS analysis was performed as previously described. The proximal and distal reference segments were within 5 mm of the lesion. The proximal and distal reference external elastic membrane (EEM) and lumen areas were measured and averaged along with the MLA and the EEM area at the MLA site. They were then used to calculate the plaque burden at the MLA site as (EEM area − lumen area) divided by EEM area. Percent area stenosis was calculated as (reference lumen area − MLA) divided by reference lumen area.
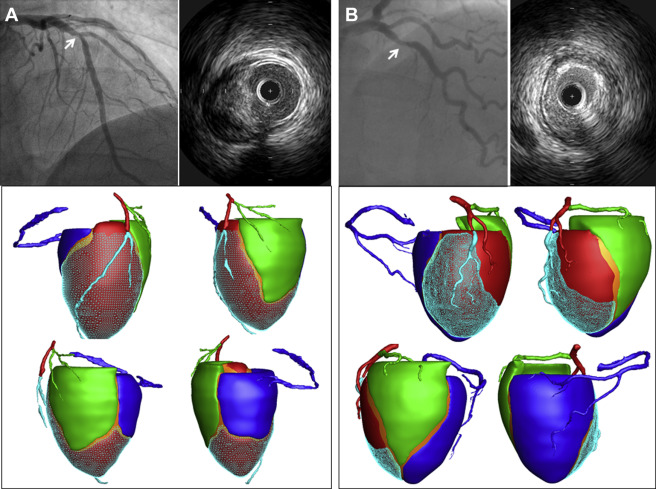
Perfusion computed tomography imaging including coronary computed tomography angiography was performed using second generation dual-source computed tomography (Definition Flash, Siemens, Germany). Coronary computed tomography angiography data with fewest motion artifacts and clearest demarcation of the coronary artery were transferred to customized software for CAMS analysis (A-Veiw Cardiac, Asan Medical Center, Korea). After extracting the centerline of each coronary artery and left ventricular myocardium on the computed tomographic images, the 3-dimensional Voronoi algorithm was used to assign the myocardial territories of the 3 major epicardial coronary arteries. In brief, the Voronoi algorithm is a mathematical algorithm that divides the area or space between predetermined points or lines according to the shortest distances from those points or lines. The left ventricular myocardial volume ( V total ) was divided into 3 major epicardial coronary artery territories based on the shortest distance from the coronary artery. The V sub was defined as the volume of the myocardium subtended by the stenotic coronary segment. The V ratio was defined as the ratio of the V sub to the V total . Figure 1 shows examples of CAMS analysis.
FFR is defined as the ratio of the distal coronary pressure ( P d ) to the aortic pressure ( P a ) at maximum hyperemia. Using the pressure gradient across the stenosis (Δ P ), FFR is alternatively expressed as FFR = P d / P a = 1 − Δ P / P a . Based on the morphologic and hydrodynamic similarities of stenotic lesions, it was hypothesized that Δ P could be modeled with the pressure decrease in laminar flow through a circular tube, which was proportional to the flow rate ( Q ) divided by the square of cross-sectional area ( A ) or by the diameter ( d ) to the fourth power (Poiseuille’s law). To validate this hypothesis, Q / A 2 and Q / d 4 were estimated using clinical measurements; and their correlations with FFR were evaluated. The flow rate over the stenosis was roughly assessed using body mass index and body surface area on the basis of the proportionality with cardiac output. In addition, the allometric scaling law for estimating the ratio of flow rates to vessel branches was applied, such as Q is approximately EEM 3/2 or RLD 3 , where EEM is the IVUS-measured cross-sectional area of EEM and the RLD is the average reference lumen diameter measured by QCA. Assessed using the CAMS method, the V sub , V ratio , and V total were also taken into account. For A and d , the IVUS-measured MLA and QCA-measured minimum lumen diameter were used, respectively.
All statistical analyses were performed using SPSS (version 10.0, SPSS Inc., Chicago, Illinois). All values are expressed as means ± 1 SD (continuous variables) or as counts and percentages (categorical variables). Continuous variables were compared using unpaired t tests; categorical variables were compared using the chi-square statistics or Fisher’s exact test. Receiver-operating characteristic curves were analyzed using MedCalc Software (Mariakerke, Belgium) to assess the best cut-off values for morphologic parameters to predict FFR <0.80 with maximal accuracy. The sensitivity, specificity, positive predictive value (PPV), and negative predictive value (NPV), with their 95% CIs, were determined.
Results
The baseline characteristics of 69 patients with 103 intermediate lesions are summarized in Table 1 . Quantitative angiographic and IVUS data are summarized in Table 2 . The FFR was 0.81 T0.13, and 42 (41%) lesions had an FFR <0.80.
| Variable | Patients |
|---|---|
| Age (years) | 62.7±9.1 |
| Men | 61 (88%) |
| Diabetes mellitus | 24 (35%) |
| Hypertension | 33 (48%) |
| Current smoker | 29 (42%) |
| Hyperlipidemia | 24 (35%) |
| Body mass index (kg/m 2 ) | 24.8±2.6 |
| Body surface are (m 2 ) | 1.78±0.16 |
| Acute coronary syndrome | 5 (7%) |
| CAMS data | |
| Left ventricular myocardial volume (cc) | 121.2±32.6 |
| Myocardial volume of RCA territory (cc) | 32.6±14.3 |
| Myocardial volume of LAD territory (cc) | 51.9±15.2 |
| Myocardial volume of LCX territory (cc) | 34.7±13.4 |
| %Myocardium of RCA territory (%) | 27.3±8.3 |
| %Myocardium of LAD territory (%) | 43.6±7.1 |
| %Myocardium of LCX territory (%) | 29.1±8.0 |
| Involved vessel | |
| Left anterior descending | 53 (51%) |
| Left circumflex | 17 (17%) |
| Right coronary | 33 (32%) |
| Lesion location | |
| Proximal segment | 51 (50%) |
| Mid segment | 42 (41%) |
| Distal segment | 18 (9%) |
| Quantitative coronary angiographic data | |
| Proximal reference lumen diameter (mm) | 3.3±0.6 |
| Distal reference lumen diameter (mm) | 2.9±0.5 |
| Averaged reference lumen diameter (mm) | 3.1±0.5 |
| Minimal lumen diameter (mm) | 1.7±0.6 |
| Diameter stenosis (%) | 44.9±16.2 |
| Lesion length (mm) | 16.5±8.4 |
| Intravascular ultrasound data | |
| Proximal reference lumen (mm 2 ) | 10.6±4.6 |
| Proximal reference external elastic membrane (mm 2 ) | 19.0±6.4 |
| Minimal lumen area (mm 2 ) | 3.6±2.2 |
| external elastic membrane at minimal lumen area site (mm 2 ) | 13.3±4.6 |
| Plaque + Media at the minimal lumen area site (mm 2 ) | 9.7±4.5 |
| Plaque burden at the minimal lumen area site (%) | 71.2±14.3 |
| Distal reference lumen (mm 2 ) | 7.1±3.4 |
| Distal reference external elastic membrane (mm 2 ) | 12.1±5.1 |
| Coronary artery-based myocardial segmentation data | |
| V sub , (cc) ∗ | 33.3±16.3 |
| V ratio , (%) † | 28.3±11.2 |
∗ V sub = the volume of the myocardium subtended by the stenotic coronary segment.
† V ratio = the ratio of the V sub to the total left ventricular myocardial volume.
The myocardial volume subtended to the stenotic segment ( V sub ) showed modest correlations with body surface area ( r = 0.42, p <0.001), EEM area at the MLA site ( r = 0.35, p <0.001), averaged reference segment EEM area ( r = 0.23, p = 0.019), plaque burden at the MLA site ( r = −0.32, p <0.001), and averaged reference diameter ( r = 0.33, p <0.001). Although body mass index was related to the total left ventricular volume ( r = 0.25, p = 0.037), it did not correlate with V sub (p >0.05).
The accuracies based on receiver-operating characteristic curves analyses of the clinical and morphologic criteria to predict an FFR <0.80 are presented in Table 3 . An IVUS-MLA <2.79 mm 2 predicted an FFR <0.80 with a sensitivity of 76% and a specificity of 78% (area under curve = 0.86), whereas V sub /MLA 2 >4.04 showed a sensitivity of 88% and a specificity of 90% (area under curve = 0.94; Figure 2 ). The difference in the areas under the curves between the IVUS-MLA and V sub /MLA 2 was 0.068 (95% CIs = 0.020 to 0.109, p = 0.005; Figure 2 ). For the prediction of FFR <0.80, thresholds of IVUS-MLA corresponding to V sub are shown as a line on which V sub /MLA 2 is 4.04 ( Figure 3 ). Figure 3 also demonstrates the line on which V sub /MLD 4 is 6.26. A lesion with IVUS – MLA < V sub / 4.04 was likely to have functional significance. Table 4 lists the accuracies of the QCA and IVUS parameters adjusted by body mass index, body surface area, vessel size, and the CAMS-derived myocardial volume indexes that predicted the size of the supplied myocardium.
| Criterion | Sensitivity | Specificity | Positive predictive value | Negative predictive value | Diagnostic accuracy | Area under curve | 95% confidence intervals | |
|---|---|---|---|---|---|---|---|---|
| Quantitative coronary angiographic parameters | ||||||||
| Diameter stenosis | >52% | 69.0% | 86.9% | 78.4% | 80.3% | 79.6% | 0.81 | 0.75 – 0.89 |
| Minimal lumen diameter | <1.59mm | 73.8% | 82.0% | 73.8 % | 82.0% | 77.6% | 0.84 | 0.74 – 0.89 |
| Lesion length | >13.8mm | 50.0% | 63.1% | 48.8% | 65.0% | 58.3% | 0.52 | 0.42 – 0.62 |
| Intravascular ultrasound parameters | ||||||||
| Minimal lumen area | <2.79mm 2 | 76.2% | 78.5% | 71.4% | 82.4% | 77.4% | 0.86 | 0.79 – 0.93 |
| Plaque burden | >77% | 76.2% | 83.6% | 76.2% | 83.6% | 79.4% | 0.86 | 0.77 – 0.92 |
| Lesion length | >28.7mm | 66.7% | 45.3% | 45.9% | 66.7% | 53.4% | 0.52 | 0.43 – 0.62 |
Stay updated, free articles. Join our Telegram channel

Full access? Get Clinical Tree


