Changes in left atrial (LA) strain in patients treated with cardiac resynchronization therapy (CRT) remain not entirely explored. We prospectively evaluated long-term changes in LA size and function and their relation with left ventricular (LV) reverse remodeling and noninvasive hemodynamic variables in patients treated with CRT by 2-dimensional speckle tracking echocardiography. Thirty patients (62 ± 11 years, 63% men) underwent 2-dimensional speckle tracking echocardiography before implant and after 12 months. LA area, global and regional LA strains, LV ejection fraction (LVEF) and longitudinal strain, mitral regurgitation (MR), and diastolic variables were evaluated. At 12 months, CRT responders (60%) exhibited an increase in LA strain (11.4 ± 6.5% vs 16.5 ± 7.9%, p <0.001) and a reduction in LA area (p = 0.002), which were associated with an improvement in MR, E/E′ ratio, LVEF, and LV longitudinal strain. In nonresponders, a worsening in LA strain (11.4 ± 6.8% vs 8.7 ± 4.6%, p = 0.017) and LA area (p = 0.002) occurred in parallel with an increase in E/E′, whereas LVEF and LV longitudinal strain were unchanged. In conclusion, over long-term follow-up, LA size and strain improved in CRT responders, while worsening in nonresponders. Changes in LV function, filling pressures, and MR seem to be related to LA reverse remodeling, giving a feedback loop.
To date, the contribution of left atrial (LA) strain to cardiac reverse remodeling induced by cardiac resynchronization therapy (CRT) is not fully established. Moreover, long-term follow-up data on LA function in patients treated with CRT are missing. The aim of this prospective study was therefore to evaluate CRT-induced changes in LA size and strain over long-term follow-up and to investigate their relation with left ventricular (LV) remodeling and function and noninvasive hemodynamic variables.
Methods
Thirty heart failure patients, with indication for CRT according to current guidelines and adequate echocardiographic image quality, were enrolled in this prospective study. All patients underwent CRT implantation at the Karolinska University Hospital. The LV lead was placed in a lateral or posterolateral position. After implantation, the atrioventricular and interventricular delays were echo-optimized according to maximum aortic flow, and they were kept constant during follow-up. CRT devices were programmed to achieve spontaneous atrial-synchronized ventricular pacing, which was shown to be the most favorable pacing mode in patients treated with CRT. All patients were assessed by transthoracic Doppler echocardiography before implantation (baseline) and after 12 months. CRT response was defined by a >15% decrease in LV end-systolic volume (LVESV) at 12 months compared with baseline. Survival data were obtained from the Swedish Pacemaker and Implantable Cardioverter Defibrillator (ICD) Registry. The investigation conformed to the principles outlined in the Declaration of Helsinki. The local ethics committee approved the study protocol, and all patients provided written informed consent to participation.
Transthoracic Doppler echocardiography was performed using a Vivid 7 system (Vingmed-General Electric, Horten, Norway) equipped with a phased array 3.5 MHz transducer (Doppler frequency 5.0 to 3.5 MHz). Images were digitally stored on a dedicated server, and data analysis was performed offline on the EchoPAC workstation (GE EchoPAC sw only, version 5.1.0; Horten, Norway) by one investigator. The mean value of 3 cardiac cycles was calculated for each variable. In the event of atrial fibrillation, measurements were averaged over 5 cardiac cycles. Baseline and 12-month images were analyzed at random. LV and LA images were acquired with a frame rate of 60 to 80 second −1 . LV end-diastolic volume and LVESV were measured from the apical 4-chamber view according to Simpson’s equation, and LV ejection fraction (LVEF) was derived. LA area was measured at ventricular end systole from the apical 4-chamber view. Mitral regurgitation (MR) was assessed using color Doppler. The ratio of the MR color Doppler area was related to the LA area in the same cardiac cycle. The transmitral inflow velocity was used to assess LV diastolic function, and E/E′ ratio was calculated by measuring the early diastolic velocity (E′) at the septal border of the mitral annulus by pulsed wave Tissue Doppler Imaging. LV filling pressure was estimated from the E/E′ ratio using a regression equation previously proposed : pulmonary capillary wedge pressure (PCWP) = 1.91 + (1.24 E/E′). Right ventricular (RV) systolic function was expressed as tricuspid annular plane systolic excursion (TAPSE), measured by M-mode at the apical 4-chamber view. Right atrial (RA) area was measured at ventricular end systole from the same view. When possible, the tricuspid regurgitant jet velocity was measured.
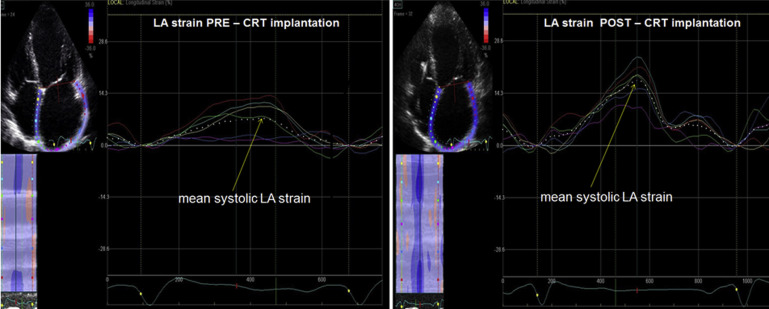
Off-line analysis using 2-dimensional speckle tracking echocardiography (2D STE) package was applied to gray-scale 2D LV images from the apical 4-chamber view to assess LV longitudinal strain, as previously described. LV longitudinal strain was calculated automatically for the entire LV myocardium and expressed as negative value; the larger the LV systolic longitudinal deformation, the more negative the value reported. The reproducibility of LV longitudinal strain in our patients was previously determined. LA strain was assessed from the apical 4-chamber view using 2D STE. An endocardial LA tracing was derived manually from a gray-scale digital cine loop at end systole, and after quality approval, tracked automatically during the cardiac cycle. Six LA segments, corresponding to the basal, mid, and apical parts of LA septum and lateral wall, were identified by the software. Global LA strain was calculated as the average of 6 segmental values assessed from the 4-chamber view and expressed as positive value ( Figure 1 ). The strain values of the 2 apical LA segments were included in the calculation of global LA strain. Because we wanted to study the differences in septal versus lateral LA strain, the apical LA segments were not analyzed in detail in our study. The intraobserver variability of LA strain, calculated in 10 patients and expressed as the coefficient of variation between 2 separate measurements, was 7.5%.
Data were analyzed using IBM SPSS Statistics 22. All continuous variables were tested for normal distribution using the Kolmogorov–Smirnov test and presented as mean ± SD. Analysis of variance for repeated measures and 2-sided paired t test were performed for comparisons of continuous variables between baseline and follow-up, and between responders and nonresponders. Relations between variables were assessed using Pearson correlation coefficient. Fisher’s exact test was used to compare proportions of nominal variables. p Values ≤0.05 were considered statistically significant.
Results
At baseline, mean age of the entire study population was 63 ± 11 years. Male (63%) and nonischemic (77%) patients were prevalent. Twenty-eight patients (93%) were in New York Heart Association class III. Preimplant LVEF was 28 ± 7%. All patients were in sinus rhythm, except for 2 (7%) of them, with permanent atrial fibrillation. Mean QRS duration was 160 ± 23 ms. Twenty-five patients (83%) received a CRT-D (CRT device with defibrillation capabilities) device, 5 patients (17%) a CRT-P (CRT device with pacing capabilities) device. All patients completed the study protocol. LA strain analysis for the entire LA and for the 4 selected LA regions could be performed in each patient.
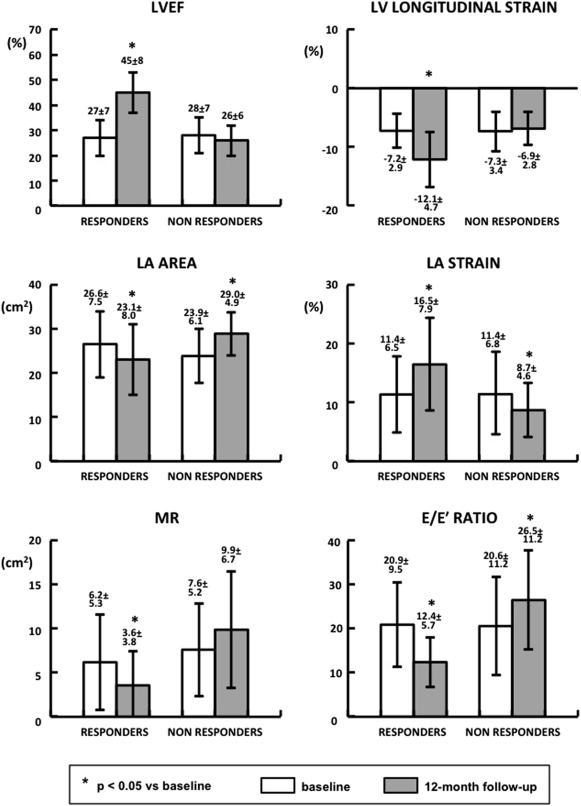
Over 12-month follow-up, in the entire population, there was a significant decrease in LV end-diastolic volume (from 177 ± 63 to 151 ± 61 ml, p = 0.002) and LVESV (from 129 ± 49 to 97 ± 49 ml, p <0.001). An improvement in LVEF (from 28 ± 7% to 38 ± 12%, p <0.001), and in LV longitudinal strain (from −7.3 ± 3.1% to −10.0 ± 4.8%, p <0.001) was observed. There was a trend toward an increase in LA strain (11.4 ± 6.5% vs 13.4 ± 7.7%, p = 0.06). No significant changes were detected in LA area (25.5 ± 7.0 vs 25.5 ± 7.4 cm 2 ). MR area showed no significant variations between baseline and 12-month follow-up (6.8 ± 5.3 vs 6.1 ± 5.9 cm 2 , p = 0.48). E/E′ ratio decreased from 21 ± 10 to 18 ± 11 (p = 0.005). Accordingly, estimated PWCP decreased from 28 ± 12 to 25 ± 14 mm Hg (p = 0.005). No significant variations were observed in RA area, TAPSE, and RV-RA pressure gradient. According to LVESV changes, at 12 months, 18 patients (60%) were identified as CRT responders and 12 (40%) as nonresponders.
At baseline, clinical characteristics ( Table 1 ) and echocardiographic parameters ( Table 2 and Figure 2 ) did not differ between CRT responders and nonresponders. Over 12-month follow-up, responders showed an improvement in LVEF, LV longitudinal strain, and LA strain (p <0.001; Figure 2 ). As presented in Table 2 , regional LA strain increased at the level of mid-atrial septum, basal, and mid-LA lateral wall (p <0.05). This was associated with a decrease in LA area and MR degree (p = 0.002 for both; Figure 2 ). E/E′ ratio and estimated PCWP decreased (p <0.001). An improvement in RV function, as expressed by TAPSE (p = 0.002), and a decrease in RV-RA gradient (p = 0.04) occurred ( Table 2 ). In nonresponders, no significant changes in LVEF and LV longitudinal strain were observed between baseline and follow-up ( Figure 2 ). LA strain worsened (p = 0.017), and LA area increased (p = 0.002). Changes in regional LA strain did not reach statistical significance ( Table 2 ). There was no significant change in MR degree. E/E′ ratio and estimated PCWP worsened (p = 0.04 for both). This was associated with an increase in E/A ratio (p = 0.05) and a reduction in deceleration time (p = 0.019), reflecting a trend toward a restrictive LV filling pattern ( Table 2 ). An increase in RA area (p = 0.005) and RV-RA gradient (p = 0.019) was observed.
| Characteristic | CRT responders | Non CRT responders |
|---|---|---|
| Age (years) | 61 ± 13 | 67 ± 8 |
| Male/Female | 11/7 | 8/4 |
| Non ischemic/ischemic cardiomyopathy | 15/3 | 8/4 |
| New York Heart Association class | 2.9 ± 0.2 | 3.1 ± 0.3 |
| QRS duration (ms) | 160 ± 24 | 159 ± 23 |
| Left ventricular ejection fraction (%) | 27 ± 7 | 28 ± 7 |
| Optimized atrioventricular delay (ms) | 134 ± 18 | 137 ± 24 |
| Optimized interventricular delay (ms) | -21 ± 19 | -11 ± 22 |
| Variable | CRT responders | Non CRT responders | ||
|---|---|---|---|---|
| Baseline | Follow-up | Baseline | Follow-up | |
| Left ventricular end-diastolic volume (ml) | 177 ± 60 | 138 ± 56 ∗ | 178 ± 69 | 170 ± 66 |
| Left ventricular end-systolic volume (ml) | 129 ± 47 | 77 ± 38 ∗ | 128 ± 53 | 126 ± 51 |
| Left atrial strain (%) | 11.4 ± 6.5 | 16.5 ± 7.9 ∗ | 11.4 ± 6.8 | 8.7 ± 4.6 ∗ |
| Regional left atrial strain (%) | ||||
| Left atrial basal septum wall | 13.9 ± 12.1 | 16.7 ± 12.1 | 13.1 ± 8.4 | 7.5 ± 4.4 |
| Left atrial mid septum wall | 13.5 ± 10.2 | 19.1 ± 9.6 ∗ | 13.8 ± 8.5 | 10.2 ± 5.5 |
| Left atrial basal lateral wall | 16.3 ± 10.7 | 25.8 ± 13.0 ∗ | 20.8 ± 14.2 | 15.4 ± 7.0 |
| Left atrial mid lateral wall | 11.7 ± 7.6 | 15.8 ± 9.4 ∗ | 11.5 ± 6.5 | 8.0 ± 5.0 |
| Mitral regurgitation/Left atrial area ratio | 0.22 ± 0.16 | 0.14 ± 0.14 ∗ | 0.32 ± 0.18 | 0.34 ± 0.22 |
| Estimated pulmonary capillary wedge pressure (mm Hg) | 28 ± 12 | 17 ± 7 ∗ | 27 ± 14 | 35 ± 14 ∗ |
| Left ventricular diastolic function | ||||
| E wave (m/s) | 0.79 ± 0.26 | 0.66 ± 0.23 ∗ | 0.75 ± 0.29 | 0.81 ± 0.21 |
| A wave (m/s) | 0.61 ± 0.32 | 0.64 ± 0.20 | 0.48 ± 0.24 | 0.38 ± 0.26 |
| E/A ratio | 1.8 ± 1.3 | 1.1 ± 0.6 ∗ | 1.9 ± 1.2 | 2.6 ± 1.0 ∗ |
| Deceleration time (ms) | 206 ± 64 | 229 ± 51 | 219 ± 76 | 168 ± 38 ∗ |
| Filling time/cycle length | 0.49 ± 0.11 | 0.50 ± 0.07 | 0.46 ± 0.07 | 0.46 ± 0.08 |
| Right atrial and right ventricular function | ||||
| Right atrial area (cm 2 ) | 20.1 ± 7.2 | 19.8 ± 12.5 | 19.7 ± 7.4 | 26.0 ± 9.0 ∗ |
| Tricuspid annular plane systolic excursion (cm) | 1.4 ± 0.4 | 1.7 ± 0.3 ∗ | 1.3 ± 0.5 | 1.2 ± 0.3 |
| Right ventricular-right atrial gradient (mm Hg) | 30 ± 14 | 23 ± 8 ∗ | 28 ± 12 | 35 ± 12 ∗ |
As presented in Table 3 , at baseline in the entire study population, there was a correlation between LA strain and LV longitudinal strain and A-wave velocity. LA strain was inversely correlated to LA area. Over 12-month follow-up, in the entire population, the increase in LA strain was correlated with the decrease in LVESV, and with the improvement in LVEF and LV longitudinal strain. There was a weak but significant correlation between percentage increase in LA strain and percentage decrease in MR. An inverse correlation was found between the change in LA strain and the change in LA area, E/E′ ratio, and PCWP. LA strain was correlated positively with TAPSE and inversely with RA area both at baseline and follow-up. Correlations between LA strain and functional variables at baseline in CRT responders and nonresponders are presented in Table 4 . LA strain was found to correlate with LV longitudinal strain, A-wave velocity, and TAPSE only in responders. In these patients, percentage increase in LA strain over 12 months correlated with percentage increase in A-wave velocity ( r = 0.51, p = 0.041).
| Variables | Correlation | |
|---|---|---|
| r value | p value | |
| Baseline | ||
| Left atrial strain versus | ||
| Left ventricular end-systolic volume | NS | |
| Left ventricular ejection fraction | NS | |
| Left ventricular longitudinal strain | -0.41 | 0.026 |
| A wave velocity | 0.46 | 0.013 |
| Left atrial area | -0.55 | 0.002 |
| E/E’ ratio | NS | |
| Tricuspid annular plane systolic excursion | 0.59 | <0.001 |
| Right atrial area | -0.62 | < 0.001 |
| Right ventricular-right atrial gradient | NS | |
| Mitral regurgitation area | NS | |
| Deceleration time | NS | |
| Twelve-month follow-up | ||
| Δ Left atrial strain versus | ||
| Δ Left ventricular end-systolic volume | -0.52 | 0.003 |
| Δ Left ventricular ejection fraction | 0.69 | <0.001 |
| Δ Left ventricular longitudinal strain | -0.51 | 0.003 |
| Δ A wave velocity | NS | |
| Δ Left atrial area | -0.55 | 0.001 |
| Δ E/E’ ratio | -0.53 | 0.019 |
| Δ Tricuspid annular plane systolic excursion | 0.48 | 0.007 |
| Δ Right atrial area | -0.45 | 0.011 |
| Δ Right ventricular-right atrial gradient | -0.49 | 0.011 |
| % Δ Mitral regurgitation area | -0.38 | 0.035 |
| % Δ Deceleration time | 0.51 | 0.005 |
Stay updated, free articles. Join our Telegram channel

Full access? Get Clinical Tree


