Tissue Characterization in the Heart
An important application of cardiac MRI is to characterize tissues using special pulse sequences. Tissue characterization can be useful for subjects with cardiac masses and pericardial disease, as well as intrinsic myocardial diseases such as ischemic heart disease and cardiomyopathies. The most widely used tools are T1- and T2-weighted imaging, fat suppression, and gadolinium contrast enhancement in both the early (less than 5 min) and delayed (greater than 10-15 min) phases. Each of these tools is reviewed in this chapter. Examples of how different tissue characterization methods can be used to assess cardiac masses, myocardial viability, and arrhythmogenic right ventricular displasia are then considered (with full protocols provided at the end of the chapter). The assessment of ischemic myocardium is discussed in more detail in Chapter III-7.
KEY CONCEPTS
[right half black circle] T1-weighted imaging can be achieved with spin echo or spoiled gradient echo imaging.
[right half black circle] T2-weighted imaging can be achieved with spin echo imaging; T2-like weighting is produced with steady-state free precession gradient echo imaging.
[right half black circle] T2*-weighted imaging can be achieved with spoiled gradient echo imaging with relatively long TE.
[right half black circle] Fat suppression using frequency-selective saturation pulses is more specific for characterizing fat than inversion recovery techniques.
[right half black circle] Cystic masses and bland thrombus are diagnosed based on the absence of gadolinium enhancement.
[right half black circle] Delayed enhancement with gadolinium contrast is associated with infarcted myocardium. Other cardiomyopathies can also have delayed enhancement.
[right half black circle] Nulling of uninfarcted myocardium with an inversion recovery sequence provides optimal conspicuity of infarcted tissue.
[right half black circle] Clinical Protocols:
[right half black circle] Cardiac mass
[right half black circle] Cardiac viability
[right half black circle] Arrhythmogenic right ventricular dysplasia
T1-WEIGHTED IMAGING
T1-weighted images provide anatomic assessment of the myocardium and great vessels, help characterize lesions with short T1 relaxation times, and assess contrast enhancement. T1 weighting can be achieved using spin echo or spoiled gradient echo sequences. To improve conspicuity of myocardial and pericardial anatomy and pathology, black-blood images are often desired. Consequently, spin echo or fast spin echo (FSE) sequences with blood-nulling pulses are usually preferred over bright blood spoiled gradient echo sequences (Figure III5-1).
In addition to providing anatomic images of the heart and chest, T1-weighted sequences may also help to characterize some tissues, particularly those that have short T1 relaxation times and are therefore hyperintense on T1-weighted images. Tissues with short Tl times are listed in Table III5-1. With respect to detecting cardiac masses, the most common sources of confounding signal are fat and hemorrhage. It is important to recall that time-of-flight effects can also give rise to high signal on T1-weighted imaging and can result in a potential pitfall of interpretation.
For cardiac diagnoses, Tl-weighted spin echo or fast spin echo sequences are ECG-gated. Since the TR must be set to one R-R interval, image contrast depends on the subject’s heart rate. If the heart rate is slow, the TR may approach or exceed 1000 msec, reducing Tl weighting. The TE should be as short as possible for T1 weighting, typically under 50 msec.
 |
[right half black circle] TABLE III5-1 | ||||||||
|---|---|---|---|---|---|---|---|---|
|
IMPORTANT CONCEPTS:
T1-weighting with spin echo imaging is reduced if the subject’s heart rate is slow and the TR exceeds 800-1000 msec. Spoiled gradient echo sequences provide alternative methods for T1-weighted imaging but have the disadvantage of high signal intensity of the blood pool.
T2-WEIGHTED AND T2*-WEIGHTED IMAGING
T2-weighted images of the heart are valuable in the detection and characterization of pathology with long T2 times, which yield high signal intensity on these images. They are generally performed with spin echo or fast spin echo sequences. Depending on the subject’s heart rate, the TR is usually defined to be at least 2 R-R intervals with a TE of 80-100 msec. To detect high signal intensity pathology, blood nulling is desirable. With fast spin echo sequences, fat is high in signal intensity, so fat suppression will improve lesion conspicuity.
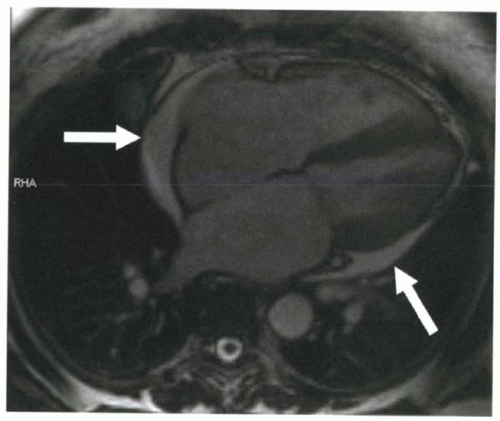 FIGURE III5-2. Pericardial effusion (arrows) is high in signal intensity on a steady-state free precession gradient echo sequence because of its high T2/T1 ratio. |
For steady-state free precession gradient echo sequences, as discussed in Chapter III-4, image contrast is T2/T1 weighted, which means that both tissues with high water content and fatty tissue are high in signal intensity (Figure III5-2).
Occasionally, it may be desirable to obtain T2*-weighted images that are sensitive to susceptibility effects.
For example, for the diagnosis of hemochromatosis, a long-TE spoiled gradient echo sequence will demonstrate decreased signal intensity because of the susceptibility effects of iron in the myocardium (Figure III5-3).
For example, for the diagnosis of hemochromatosis, a long-TE spoiled gradient echo sequence will demonstrate decreased signal intensity because of the susceptibility effects of iron in the myocardium (Figure III5-3).
IMPORTANT CONCEPT:
T2-weighting or T2-like-weighting can be achieved with black-blood spin echo methods or with bright-blood steady-state free precession gradient echo imaging. T2*-weighted imaging is particularly useful as an ironsensitive sequence for the evaluation of hemochromatosis.
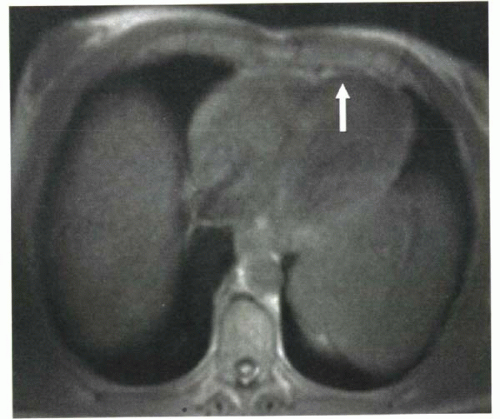 FIGURE III5-3. Low signal intensity in the myocardium on spoiled gradient echo imaging, caused by iron deposition that is due to primary hemochromatosis. |
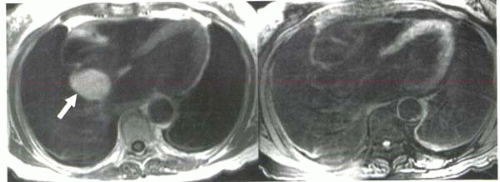 FIGURE III5-4. A mass in the interatrial septum has high signal intensity on Tl-weighted imaging (left, arrow). With a frequency-selective fat-suppression pulse (right), the mass becomes uniformly hypointense, indicating that the lesion is a lipoma. |
FAT SUPPRESSION
Fat suppression may be useful in cardiac MRI to help distinguish whether lesions that are high in signal intensity on Tl-weighted images contain fat. It is also used to improve lesion conspicuity on T2-weighted fast spin echo images, where fat has high signal intensity (Chapter I-4).
Two approaches can be employed to achieve fat suppression: a frequency-selective fat suppression prepulse or an inversion recovery prepulse with short inversion time set to null tissues with short T1, such as fat (Figure III5-4). For tissue characterization, the frequency-selective method is more specific.
CHALLENGE QUESTION: Why is frequency-selective fat suppression preferred over short-inversion-time inversion recovery (STIR) imaging for characterizing tissues with high signal on T1-weighted images?
When fat suppression is needed to enhance lesion conspicuity with T2-weighted images, inversion recovery sequences are frequently used. To ensure blood nulling as well as fat suppression on T2-weighted FSE images, triple inversion recovery sequences may be used, as described in Chapter III-3.
View Answer
Answer: The STIR approach is a more robust method for suppressing fat, particularly in the chest, where field
inhomogeneities can result in suboptimal frequency-selective fat suppression (see discussion in Chapter I-9). Field inhomogeneities have no significant effect on T1 relaxation times, and hence fat is reliably suppressed with STIR.
inhomogeneities can result in suboptimal frequency-selective fat suppression (see discussion in Chapter I-9). Field inhomogeneities have no significant effect on T1 relaxation times, and hence fat is reliably suppressed with STIR.
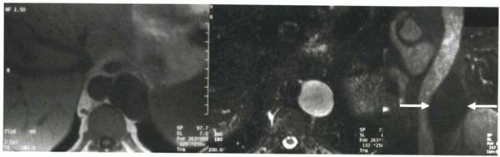 FIGURE III5-5. Periaortic cystic lymphangioma in the retroperitoneum shows uniform low signal intensity on T1-weighted gradient echo image (left) and high signal intensity on T2-weighted fast spin echo image (middle). Following contrast administration, no enhancement is seen in the cyst on a coronal fat-suppressed T1-weighted gradient echo image (arrows, right). |
IMPORTANT CONCEPTS:
Frequency-selective fat suppression provides more specific characterization of fat-containing lesions, whereas STIR imaging suppresses tissues based only on their short T1 relaxation times. However, frequency-selective fat suppression requires good field homogeneity, which may be difficult to achieve in the chest.
CONTRAST ENHANCEMENT
Contrast-enhanced Tl-weighted imaging can also help to characterize pathology in the heart and pericardium. Most commonly, contrast material is useful to differentiate enhancing masses, such as cardiac tumors, from nonenhancing pathology, such as cysts (Figure III5-5) and thrombi. To assess the vascularity of a lesion, the delay time between injection and imaging is typically less than 5 minutes.
Contrast enhancement is assessed with black-blood ECG-gated T1-weighted spin echo sequences. Alternatively, fat-suppressed T1-weighted spoiled gradient echo imaging can be used (Figure III5-5).
DELAYED CONTRAST ENHANCEMENT
One of the most active and still growing areas of cardiac MRI is the use of delayed contrast-enhanced MRI to characterize myocardial infarction or, alternatively, to assess myocardial viability. Following intravenous injection of extracellular contrast agents such as gadolinium chelates, areas of infarct and fibrosis in subacute and chronic infarcts demonstrate delayed enhancement and delayed washout relative to viable myocardium. Delayed enhancement has also been demonstrated in acute infarcts and other diseases listed in Table III5-2, although its patterns of distribution vary for different etiologies.
[right half black circle] TABLE III5-2 | |||||||
|---|---|---|---|---|---|---|---|
|
About 10-30 min after injection, delayed washout of contrast material from infarcted myocardium will cause it to appear slightly hyperintense relative to uninfarcted myocardium. However, this difference may be difficult to detect on routine Tl-weighted imaging (and with other modalities such as contrast-enhanced computed tomography, CT). To enhance the conspicuity of infarcted tissue, an inversion-recovery gradient echo sequence is used whereby the inversion time is selected to null signal from uninfarcted myocardium (Figure III5-6). When the uninfarcted myocardium is nulled, hyperintense signal from the infarcted or abnormal myocardium becomes dramatically more obvious.
The pulse sequence is illustrated in Figure III5-7. With this ECG-triggered inversion recovery sequence, the 180° inversion pulse is applied about 150-200 msec after the R wave so that imaging occurs during diastole. Then after an appropriate inversion time, when the uninfarcted myocardium is crossing its null point, the gradient echo acquisition is performed. Either a spoiled gradient echo sequence or a steady-state free precession sequence can be used with k-space segmentation. The inversion time varies across subjects and also depends on factors such as contrast agent dose and time after injection. Selection of the optimal inversion time is critical to image quality.
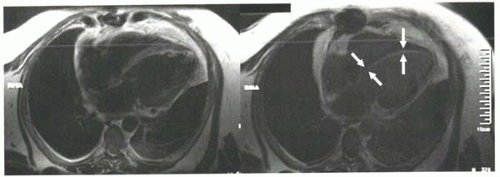 FIGURE III5-6. Improved conspicuity of delayed enhancement of subendocardial myocardial infarct (arrows) with inversion recovery methods (right) compared with T1-weighted fast spin imaging (left). Both images were obtained 10 min following intravenous contrast material, but the inversion recovery sequence was performed using an inversion time selected to null uninfarcted myocardium. |
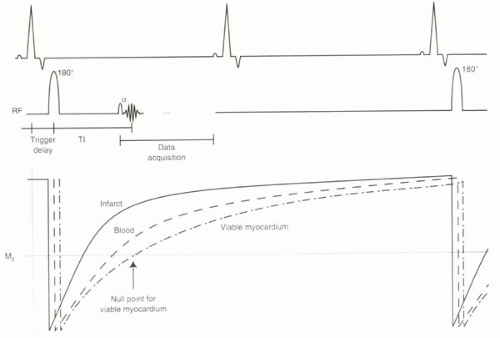 FIGURE III5-7. Inversion recovery sequence achieves nulling of viable myocardium by careful selection of the inversion time centric filling of k-space ensures optimal suppression. Data are acquired every other heartbeat to allow recovery of longitudinal magnetization. |
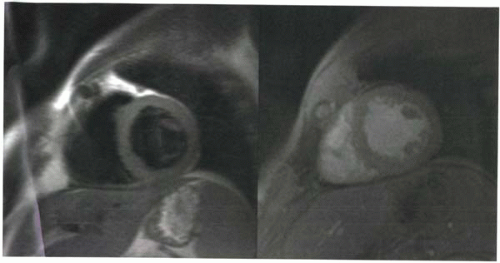
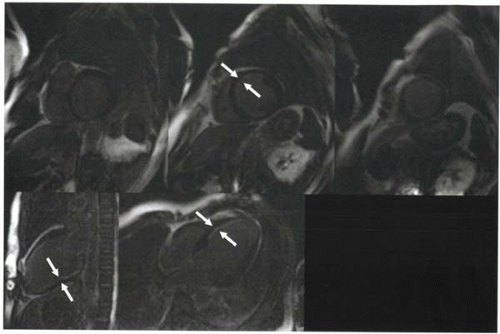 FIGURE III5-8. Selected short (top row) and long axis (bottom row) views of the left ventricle to assess myocardial viability show extensive subendocardial infarction (some, but not all regions are marked with arrows). |
To assess left ventricular viability or infarct, the inversion recovery sequence is performed for a series of short axis images from the left ventricular base to the apex. Horizontal and vertical long axis planes confirm short axis findings (Figure III5-8).
IMPORTANT CONCEPT:
Myocardial infarcts and other cardiomyopathies can demonstrate delayed contrast enhancement and washout. To enhance conspicuity of areas of abnormal enhancement, inversion recovery sequences are applied with inversion times selected to null normal myocardium.
Choosing an Inversion Time
The selection of inversion time to null the uninfarcted myocardium can critically affect the diagnostic value of the infarct images. To understand why, recall from Chapter I-7 (Figure I9-11) that most MR images are magnitude images. Magnitude images do not distinguish between signal from protons that are flipped below the xy plane and signal from protons that have recovered above the xy plane. By relying on magnitude data alone, patterns of tissue contrast vary dramatically with different inversion times (Figure III5-9). For example, at the null point of viable myocardium, infarct will have signal intensity that
is higher than that of blood. However, at the inversion time of the infarcted myocardium, image contrast will be inverted, and the viable myocardium will have the greatest signal intensity.
is higher than that of blood. However, at the inversion time of the infarcted myocardium, image contrast will be inverted, and the viable myocardium will have the greatest signal intensity.
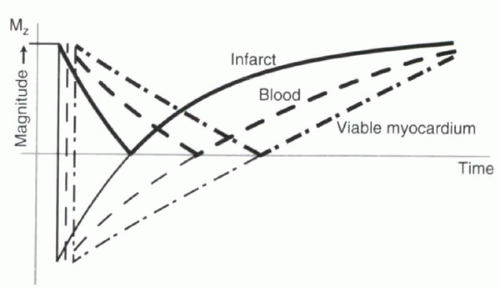 FIGURE III5-9. Signal intensity of cardiac tissues following an inversion pulse, with darker lines depicting the magnitude or absolute value of the magnetization. Image contrast at time points preceding the null point can be confusing. |
Selection of the inversion time that nulls normal myocardium is commonly performed by successive approximations. Inversion times range from 200 to 350 msec for most subjects when imaged 10-20 minutes after administration of about 0.1 to 0.2 mmol per kg of body weight of gadolinium chelate. It is common for the nulling inversion time to change slightly over the course of the examination.
CHALLENGE QUESTION: Why does inversion time change during the examination? Would it become shorter or longer with time?
View Answer
Answer: Over time, more of the gadolinium contrast material washes out of the uninfarcted myocardium. With less gadolinium contrast, the T1 time lengthens, and consequently the inversion time is also longer (Figure III5-10). During the 10-15 min of viability imaging, the T1 time usually increases by about 25-50 msec.
Inversion Time Mapping Sequence
Stay updated, free articles. Join our Telegram channel

Full access? Get Clinical Tree


