More k-Space: The Relationship between k-Space and the Image
The previous chapter concentrated on how the pulse sequence diagram defines the k-space trajectory. This chapter focuses in more detail on specific properties and characteristics of k-space and their relationship to the quality of the image. With the ability to understand their consequences, some ways to “shortcut” k-space are introduced in this chapter. The next chapter then focuses on how these and other strategies are routinely used to reduce acquisition times in clinical cardiovascular MR imaging.
KEY CONCEPTS
[right half black circle] k-space is the Fourier transform of the image: the center of k-space holds low-spatial-frequency information (image contrast), whereas the periphery of k-space holds high-spatial-frequency information (image details).
[right half black circle] The real and imaginary components of k-space reflect symmetric and asymmetric components of the image, respectively, and MR images are generated using both.
[right half black circle] The symmetric properties of k-space facilitate shortcuts in data collection.
[right half black circle] Asymmetry or truncated sampling of echoes creates Gibbs ringing artifacts in the image.
[right half black circle] Zero filling of k-space increases the apparent spatial resolution of the image but not the true resolution.
[right half black circle] The dimensions of k-space and field of view (FOV) of the image are inversely related; the spacing of k-space data is inversely related to image size or FOV.
[right half black circle] Rectangular FOV manipulates the spacing of k-space data to generate images in reduced acquisition times without sacrificing spatial resolution.
[right half black circle] Oversampling of k-space can prevent wraparound artifacts associated with fields of view that are smaller than the imaged object.
k-SPACE AS THE FOURIER TRANSFORM OF THE IMAGE: A REVIEW
As discussed extensively in Chapters I-1 and I-6, k-space is the Fourier transform, or spatial frequency histogram, of the tissue slice or volume. The center of k-space consists of information about the lowest spatial frequencies in the image, while the periphery contains the high-spatial-frequency data. It may be obvious, but is probably still worth stating:
The low-spatial-frequency data in the center of k-space reflect the overall shades of white, gray, or black in the image. If the image overall is bright or has a lot of high signal, then the center of k-space will have high amplitude. The high-spatial-frequency data at the edges of k-space contain information about fine details in the image including high-resolution definition of edges of large and small structures. Figure I7-1 illustrates this point with an MR image of the heart shown together with its k-space map. To highlight their contributions to the image, various amounts of the central and peripheral portions of k-space are extracted and their corresponding images shown. From the figure, it is apparent that most of the image information is in the central-most portion of k-space.
SYMMETRIC AND ASYMMETRIC COMPONENTS OF k-SPACE
In the preceding chapters, k-space and the definitions of the Fourier transform are expressed in terms of cosine functions. However, that story is incomplete. Because cosine
functions are symmetric functions (see Figure I1-14)—that is, they are the mirror images of themselves—they can describe only the symmetric components of images. Real medical images are asymmetric, so cosine functions alone are not sufficient to describe them. To complement the cosine functions, sine functions are needed. As asymmetric functions, sine functions can be used to describe asymmetric parts of the image (see Figure I1-14). Using the full complement of sine and cosine functions, images can be completely represented in terms of spatial frequencies.
functions are symmetric functions (see Figure I1-14)—that is, they are the mirror images of themselves—they can describe only the symmetric components of images. Real medical images are asymmetric, so cosine functions alone are not sufficient to describe them. To complement the cosine functions, sine functions are needed. As asymmetric functions, sine functions can be used to describe asymmetric parts of the image (see Figure I1-14). Using the full complement of sine and cosine functions, images can be completely represented in terms of spatial frequencies.
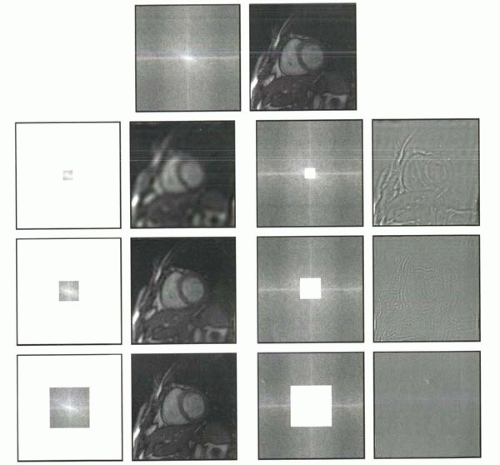 FIGURE I7-1. k-space contribution to an MR image of the heart. At top, the full k-space map and original image are shown. Below, k-space is divided into the central 1% (left)/peripheral 99% (right) at top, central 4% (left)/peripheral 96% (right) in the middle, and central 15% (left)/peripheral 85% (right) portions at bottom, along with the corresponding images for each subset of k-space. The peripheral portions of k-space (right two columns) primarily provide information about fine details and edges, while the overall image contrast information is contained in the central portions of k-space (left two columns). |
How can both the sine and cosine frequency maps be expressed in k-space? To make it possible to record both sine and cosine frequency information, k-space must consist of two sets of numbers—one representing the cosine spatial frequency component, and another the sine spatial
frequency component. These two numbers can be expressed together as a complex number. Complex numbers are numbers that have two components, typically written as
frequency component. These two numbers can be expressed together as a complex number. Complex numbers are numbers that have two components, typically written as
a + ib
where a and b are real numbers, and b represents the coefficient of the imaginary component, i, defined as the square root of −1 ( ). Recall the full Fourier transform definition given in Chapter I-6:
). Recall the full Fourier transform definition given in Chapter I-6: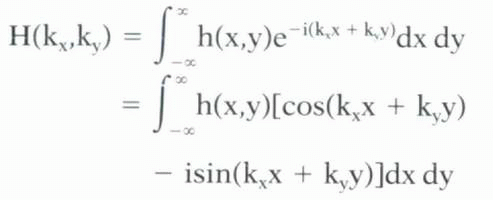
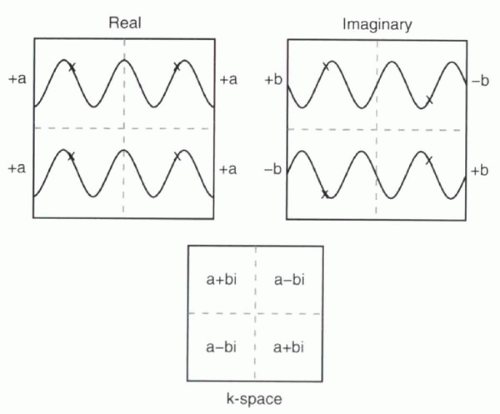
That is, the Fourier transform is a complex number in which the real term contains the cosine frequencies and the imaginary term contains the sine frequencies. The real and imaginary terms for each pair of k-space coordinates (kx,ky) is stored in separate maps. The cosine frequency map is referred to as the real component of k-space, while the sine frequency map is the imaginary component of k-space (Figure I7-2). The imaginary component is necessary to specify asymmetries in the image and is critical for localizing objects in the image, differentiating left, right, superior, or inferior.
Real, Imaginary, Magnitude (Modulus), and Phase Images
Taking the Fourier transform of the real component of k-space generates a real image, which is symmetric. Taking the Fourier transform of the imaginary component generates an imaginary image, which is asymmetric.
 |
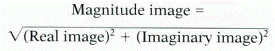
Most commonly, the MR images that are used clinically are combinations of the real and imaginary data and are referred to as magnitude (modulus) images:
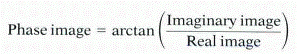
The complement to the magnitude or modulus image is the phase image. The phase image reflects the relationship between the real and imaginary images and is defined mathematically as
Symmetry in k-Space
As illustrated in Figure I7-2, k-space has a particular symmetry that reflects the relationship between the real and imaginary components. This pattern of symmetry is referred to as Hermitian conjugate symmetry, in which the upper right and lower left quadrants of k-space are theoretically identical, while the upper left and lower right are also theoretically identical. An important consequence of this symmetry is that it is not always necessary to sample k-space fully to make an image. If only part of k-space is collected, the other portion can be inferred based on the symmetry of k-space. Note that the symmetry of k-space assumes a perfectly homogeneous magnetic field. Inhomogeneities lead to phase errors so that symmetry is no longer perfect.
ASYMMETRIC k-SPACE
Many fast imaging strategies in MRI take advantage of the Hermitian conjugate symmetry of k-space to reduce acquisition times. Half-Fourier acquisition single-shot turbo spin echo imaging (HASTE, described in Chapter I-4)
is one example. With HASTE sequences, just over half of the phase-encoding lines of k-space are collected. The missing half is approximated mathematically, and the computer-generated data are used to complete k-space. Half-Fourier imaging is an example of a partial Fourier or partial Nex (number of excitations) technique, meaning that the phase-encoding lines are partially collected. To correct for the phase errors caused by magnetic field inhomogeneities, a few more than half of the lines of k-space are collected with HASTE methods.
is one example. With HASTE sequences, just over half of the phase-encoding lines of k-space are collected. The missing half is approximated mathematically, and the computer-generated data are used to complete k-space. Half-Fourier imaging is an example of a partial Fourier or partial Nex (number of excitations) technique, meaning that the phase-encoding lines are partially collected. To correct for the phase errors caused by magnetic field inhomogeneities, a few more than half of the lines of k-space are collected with HASTE methods.
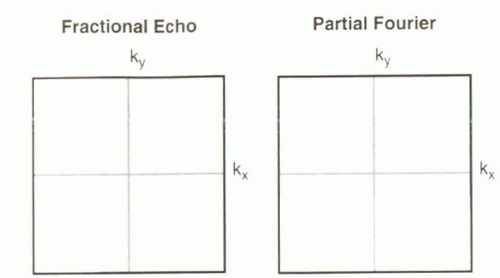 FIGURE I7-3. Two types of asymmetric k-space filling approaches, where the shaded areas depict collected data. Partial Fourier methods are also referred to as partial Nex. |
Collection of asymmetric portions of k-space can also be implemented in the frequency-encoding direction, where it is referred to as fractional echo or partial echo imaging (Figure I7-3). In both cases, the missing data can be calculated, as with HASTE sequences. Alternatively, in many implementations, zeroes are substituted for the missing data. To understand the effects of asymmetries of k-space filling on images, the sinc function and its Fourier transform need to be reviewed again.
Sinc Function and k-Space Revisited
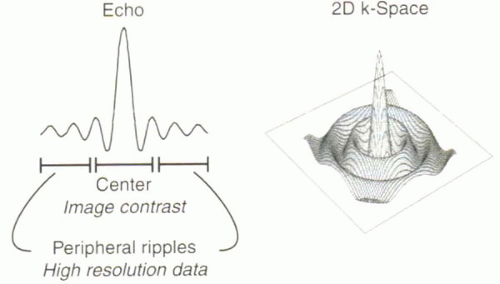
Gradient echoes and spin echoes are sinc functions because they contain a composite of signal across a range of frequencies (receiver bandwidth). k-space represents a full set of echoes and has the appearance of a two-dimensional sinc function, as illustrated in Figure I7-4.
As discussed in Chapter I-5, the central peaks of both k-space and any given echo contribute predominantly to defining image contrast, while the periphery of k-space (or, in the case of an echo, the peripheral ripples) contain high-resolution information about fine details. Practical constraints limit the duration of the echo and its sampling. This results in an imperfect rendering of the Fourier transformation of the tissue slice in k-space. The effects of truncation of the echo on the spatial representation of the tissue in the MR image are explored in the next section.
 |
Effect of Truncating k-Space on Image Quality
The degree to which each echo or the entire k-space represents all spatial frequencies in the image determines how well they represent its true Fourier transformation. It is useful to focus in particular on the high-frequency, peripheral ripple components because they are, by necessity, always at least partially truncated with MR imaging. With the loss of high-spatial-frequency information, the effects of truncation are primarily seen in terms of reduced edge definition and fine details in the MR image. Figure I7-5 illustrates two scenarios: (a) a perfectly and completely sampled echo and the resulting perfect image representation of the tissue and (b) the typical situation of an imperfectly sampled echo and the resulting image representation. In the perfect scenario, with a completely sampled sinc function, the edges of all of the structures are defined perfectly so that even small lesions, such as the tiny right renal cyst shown in the figure, are accurately depicted. If the echo is undersampled, image quality deteriorates, because the echo no longer represents the perfect Fourier transformation of the tissue slice. Truncation of the echo results in decreased spatial resolution and increased ringing artifacts.
The concept of an undersampled echo and its effect on image quality is analogous to the truncation of the RF pulse and its effect on slice profile, as discussed in Chapter I-5. For example, consider Figure I7-6, which focuses on the delineation of the abdominal aorta in Figure I7-5. With complete sampling of a sinc function that makes up
an echo, all the spatial frequency components of the image would be completely represented in k-space. Hence, the Fourier transformation of k-space would result in an image that perfectly depicts anatomic structures. For example, the signal intensity in the aorta would be uniformly high and its edges sharply defined. Truncating the echo leads to loss of high-spatial-frequency information, producing images with blurred edges and ringing artifacts around the edges of objects, called Gibbs truncation artifact or Gibbs ringing artifact. The greater the truncation, the greater blurring and ringing artifacts (Figures I7-6 and I7-7).
an echo, all the spatial frequency components of the image would be completely represented in k-space. Hence, the Fourier transformation of k-space would result in an image that perfectly depicts anatomic structures. For example, the signal intensity in the aorta would be uniformly high and its edges sharply defined. Truncating the echo leads to loss of high-spatial-frequency information, producing images with blurred edges and ringing artifacts around the edges of objects, called Gibbs truncation artifact or Gibbs ringing artifact. The greater the truncation, the greater blurring and ringing artifacts (Figures I7-6 and I7-7).
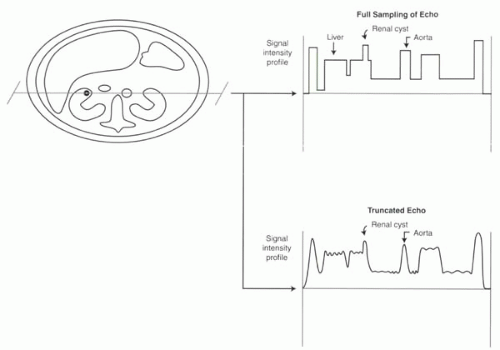 FIGURE I7-5. Signal intensity profiles through the kidneys and aorta with perfect (above) and reduced sampling (below) of the echo resulting in perfect and reduced spatial resolution. Reduced spatial resolution impairs accurate measurements of aortic diameter and detection of small lesions such as the renal cyst. |
On clinical MR systems, a post-processing filter may be applied to minimize the ringing artifact. However, if the truncation of the echo is severe, the filter will not be able to eliminate the ringing entirely. In any case, the filters do not recover high-spatial-frequency information and can, at times, contribute to worsening of the image quality.
Zero Filling k-Space
Truncated sinc functions are a recurring theme in fast MR imaging because they are associated with shortened acquisition times. Rather than collect the full number of phase-encoding steps, commercial systems frequently employ a strategy called zero filling or zero padding to reduce the number of phase-encoding steps by up to one-half. The uncollected, peripheral lines of k-space are filled with zeroes to maintain the apparent resolution of images, but the acquisition times are reduced substantially. This approach is frequently used in 3D imaging applications such as 3D MR angiography.
With zero filling, a 512-point imaging matrix can be generated with only 256 phase-encoding steps. The periphery of k-space is simply “padded” with a rim of zeroes (Figure I7-8). Taking the Fourier transform of this modified k-space will create an image with 512 × 512 voxels. With finer voxels, the image may have the appearance of being higher in spatial resolution than a 256 × 256 matrix
image, but in fact, the extra voxels are merely interpolated. Interpolation is roughly the equivalent of taking the average value of two adjacent voxels to make a new voxel in between the two. The addition of zeroes in k-space does not actually improve the spatial resolution at all (see discussion later in this chapter), but it does reduce the effect of volume averaging in 3D images and hence is frequently used in 3D applications. On commercial systems this is often referred to as zero interpolation, zip interpolation, zero padding,


image, but in fact, the extra voxels are merely interpolated. Interpolation is roughly the equivalent of taking the average value of two adjacent voxels to make a new voxel in between the two. The addition of zeroes in k-space does not actually improve the spatial resolution at all (see discussion later in this chapter), but it does reduce the effect of volume averaging in 3D images and hence is frequently used in 3D applications. On commercial systems this is often referred to as zero interpolation, zip interpolation, zero padding,
Stay updated, free articles. Join our Telegram channel
Full access? Get Clinical Tree
