INTRODUCTION
Complex intracardiac anatomy and spatial relationships are inherent to congenital heart defects (CHD). Beginning over thirty years ago and until recently, the clinician’s ability to image the heart by echocardiography has been limited to two-dimensional techniques. In the interim, there have been important advances in 2D echocardiography. Improving transducer technology, beam forming, and miniaturization have led to significant improvements in spatial and temporal resolution using 2DE. However, 2DE has fundamental limitations. The very nature of a 2DE slice, which has no thickness, necessitates the use of multiple orthogonal “sweeps.” The echocardiographer then mentally reconstructs the anatomy, and uses the structure of the report to express this mentally reconstructed vision. This means that the only three-dimensional image of the heart is the “virtual image” that exists only in the echocardiographer’s mind, and is then translated into words. It is not easy for an untrained—albeit interested—observer to understand the images obtained in the course of a sweep: expert interpretation is required. Since myocardial motion occurs in three dimensions, 2DE techniques inherently do not lend themselves to accurate quantitation.
Recognition of these limitations of 2DE led to burgeoning research and clinical interest in the modality of three-dimensional echocardiography (3DE). Early reconstructive approaches were based on 2DE image acquisitions that were subsequently stacked and aligned based on phases of the cardiac cycle, in order to recreate a 3DE dataset. While these approaches proved to be accurate, the need for time and offline processing equipment imposed fundamental limitations on their clinical applicability. In 1990, von Ramm and Smith published their early results with a matrix-array transducer that provided real-time images of the heart in three dimensions. While this was an important breakthrough, this transducer was unable to be steered in the third (elevation) dimension. Over the past five years, dramatic technological advances have facilitated the ability to perform live 3DE scanning, including the ability to steer the beam in three dimensions and to render the image in real time.
3DE TECHNOLOGY
Technologic advances that have facilitated the maturation of 3DE techniques include the following:
■Matrix transducers
■Beam forming and steering in three spatial dimensions
■Display of three-dimensional information
■Software for quantification
Matrix Transducers
Two important advances in transducer technology, namely the organization of elements and the use of novel piezoelectric materials, have been the structural basis for improvements in 3DE matrix transducers. The organization of elements within the transducer is best understood by starting with a brief review of 2DE transducers.
Elements: Two-Dimensional Transducers
Current 2DE transducers transmit and receive acoustic beams in a flat 2DE scanning plane. As opposed to M mode, which provides one spatial and one temporal dimension, 2DE scanning systems sweep a scan line to and fro within this 2DE imaging plane. The angular position of the beam is said to vary in the azimuthal dimension. Even though traditional, flat 2DE scanning comprises two spatial dimensions plus one temporal dimension, this is not three-dimensional imaging. The 2DE transducer itself consists of elements that work in concert to create a scan line. Typically, a conventional transducer consists of 64 to 128 elements arranged along a single row (technically referred to as a one-dimensional array of elements). These elements are spaced according to the ultimate frequency (and hence wavelength) of the acoustic vibrations; these propagate radially along the direction of the scan line. The two spatial dimensions in the image come from sweeping the beam by firing along this row at different times. This array of elements steers the outward ultrasound beam or scan line by using interference patterns generated by varying the spatiotemporal phase of each element’s transmit event.
Elements: Primitive Matrix-Array Transducers
An innovation applied in the last decade was to increase the number of rows of elements from one (in the 2DE transducer described above) to five to seven rows of elements. This “sparse-element” model generated a primitive matrix-array transducer with 5 x 64 = 320 elements. While this represented a dramatic increase in the number of elements, not all elements were electrically active, and the individual elements were not electrically independent from each other. As a result, this transducer did not steer in the third (elevation) dimension. Poor image quality, a large footprint and the lack of portability limited the mainstream acceptability of this approach.
Elements: Contemporary Matrix-Array Transducers
Contemporary matrix-array transducers comprise as many elements in the elevational dimension as they do in the azimuthal dimension, with over 60 elements in each of these dimensions. While the elements are arranged in a two-dimensional grid, this array generates 3DE images. In order to be able to steer in the elevational plane, each element must be electrically independent from all other elements, and each element must be electrically active. The technology and electrical circuitry to electrically insulate and connect each element became commercially available in 2002. As a result, the contemporary matrix-array transducer consists of thousands of electrically active elements that independently steer a scan line left and right, as well as up and down.
Transducers: Piezoelectric Materials
The piezoelectric material in an ultrasound transducer is a fundamental determinant of system image quality. Piezoelectric transducer elements are responsible for delivery of ultrasound energy into the scanned tissue and for converting returning ultrasound echoes into electric signals. Their coupling efficiency in converting electrical energy to mechanical energy or vice versa is a key determinant of image quality, Doppler sensitivity, and penetration. To create an overall piezoelectric effect, these elements must be subject to the application of an external electric field to align dipoles within polycrystalline materials. For almost forty years, a ceramic polycrystalline material, PZT (lead-zirconate-titanate) or PZT composites, have been the standard piezoelectric material used in medical imaging. This material is a uniform powder that is mixed with an organic binder; the resulting compound is baked into a dense polycrystalline structure. At its best, it achieves ~70% alignment of dipoles due to imperfect alignment of the individual dipoles. This leads to a corresponding constraint in the electromechanical coupling efficiency of the material.
One example of new piezoelectric material involves growing crystals from a molten ceramic material, resulting in a homogenous crystal with fewer defects, lower losses and no grain boundaries. When these crystals are poled at the preferred orientation(s), near perfect alignment of dipoles (~100%) is achievable, resulting in dramatically enhanced electromechanical properties (Fig. 33.1). The efficiency of conversion of electrical to mechanical energy improves by as much as 68%–85% when compared to PZT ceramics currently used in ultrasound transducers. The new piezoelectric materials provide increased bandwidth and sensitivity, resulting in both penetration and high resolution. The improved arrangement of atoms in these new piezoelectric materials, and their superior strain energy density, translate into advances in transducer miniaturization. The recent implementation of these advances has led to the availability of high frequency matrix 3DE transducers that have dramatically enhanced the applicability of 3DE to pediatric populations as well as to transesophageal echocardiography.
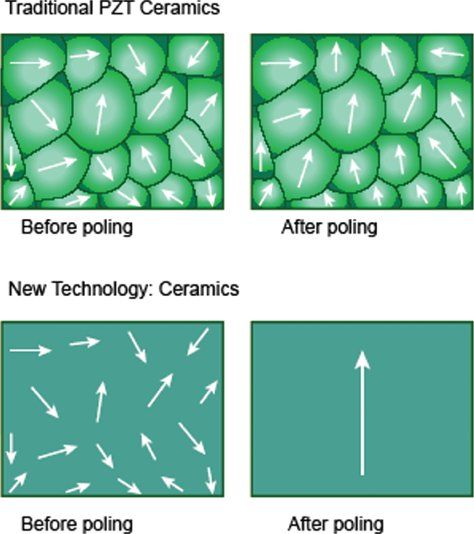
Figure 33.1. The top panel shows imperfect alignment of dipoles in traditional piezoelectric (PZT) crystals after poling (application of an external electrical field). The bottom panel shows almost perfect alignment of dipoles in new piezoelectric material.
Three-Dimensional Beam Forming and Steering
Beam forming consists of steering and focusing of transmitted and received scan lines. For 3DE, this means that the beam former must be steered in both the azimuthal and elevational planes. This is achieved both in the ultrasound system and within the transducer itself, using highly specialized integrated circuits to create a 3D trapezoid of acoustic information that is processed. These 3DE data are summed, processed, and finally placed into rectangular space using a 3D scan converter.
Display of 3DE
Two-dimensional computer displays consist of rows and blocks of picture elements, termed pixels, that comprise a 2D image. In contrast, a 3DE data set consists of bricks of pixels, termed volume elements or voxels. However, even for a 3DE data set, the two-dimensional nature of the display imposes restrictions on the ability to appreciate depth. As shown initially by the ancient Greeks and subsequently rediscovered during the Renaissance, perspective is used to simulate the appearance of 3D depth, providing objects the appearance of being close to or deeper/further away from the screen. The process of adding perspective is done by casting a light beam through the collection of voxels. The light beam either hits enough tissue so as to render it opaque, or it keeps shining through transparent voxels so as to render it transparent. More recent algorithms apply different hues to the front of the data set (nearest to the screen) as opposed to voxels that are far from the screen (Fig. 33.2, Video 33.1). The user has the ability to rotate and tilt the data set on the computer screen. Tools are available to “cut away” interfering structures, thus performing “virtual dissection.”
Software for Quantification
Quantification requires segmentation of structures of interest from the acquired data. Since myocardial motion occurs in three spatial dimensions, 2DE planes are inherently incapable of capturing the entire motion. Two-dimensional techniques for quantitation are based on geometric formulas that rely on assumptions regarding the shapes of cardiac structures. However, these assumptions are frequently incorrect. In contrast, 3DE acquisitions include the entire extent of the structure, thus minimizing the possibility of foreshortening of the apex or any geometric assumptions regarding shape. Three-dimensional quantitative software tools have the potential to quantify cardiac structures accurately regardless of their shape. Advances in the software tools for processing 3DE datasets have mirrored the rapid advances in transducer technology that have occurred over the past five years.
3DE volumetric techniques traditionally relied on definition of chamber cavities, that is, the blood-endocardium interface. The software constructs this interface by using a process known as surface rendering, and represents it as a mesh of points and lines. This software-generated mesh is calculated for every frame of acquisition, thus providing a moving cast of the cavity of the ventricle during the cardiac cycle (Video 33.2). Since this is digital data, it provides for ease of computation of global and regional volumes, synchrony as well as parametric displays of endocardial excursion and timing of contraction (Fig. 33.3).
3DE quantification tools for the left ventricle are more technologically advanced than for other cardiac structures. Until recently, 3DE LV quantification tools employed the method of disk summation. With improvements in computing speeds and programming, newer tools have been developed to provide instantaneous tracking of the blood pool–endocardium interface at each frame of acquisition. This provides a surface-rendered model that is displayed as a mesh of lines and points. However, these approaches are still based on some basic 3D geometric assumptions regarding left ventricular shape, and therefore their application cannot be extended to the right ventricle or to univentricular hearts. More recently, 3D speckle-tracking echocardiography has been used to quantify left ventricular volumes, ejection fraction, and strain.
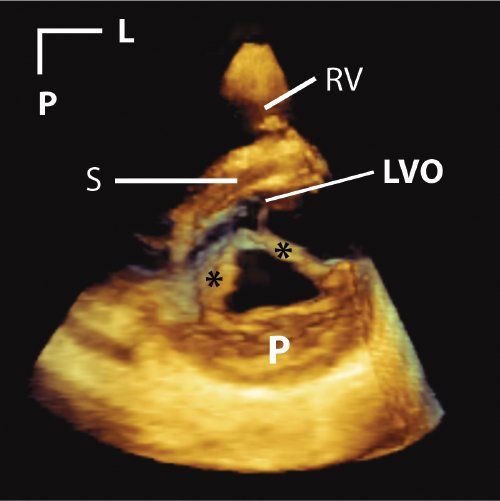
Figure 33.2. This is a parasternal short-axis image of a cleft in the anterior mitral leaflet. Asterisks mark the edges of the cleft. A tissue colorization map has been applied to the image. This has the effect of coloring tissues in the near field (near to either the transducer or the front of the 3D image) orange. Tissues in the far field are colored blue. This is a dynamic after effect, which means that as the operator rotates, tilts, or otherwise manipulates the image, the color effect correspondingly changes in real time. L, left; LVO, left ventricular outflow tract; P, posterior; RV, right ventricle; S, septum.
Given the complex shape and architecture of the right ventricle, it is not surprising that tools for quantifying RV volume have been slower to mature. Until very recently, these tools utilized the method of disks for volumetrics. Novel software now provides instantaneous tracking of the blood pool–endocardium interface at each frame of acquisition (Fig. 33.4). This yields a surface-rendered model that is displayed as a mesh of lines and points.
Quantitative software for the mitral valve provides the ability to perform sophisticated analyses of the nonplanar shape of the mitral annulus and to measure 3D structures, including annular diameters, commissural lengths, and leaflet surface areas. Quantitative techniques have also been developed to provide volumetric measurements of 3D color flow using nonaliased color flow data.
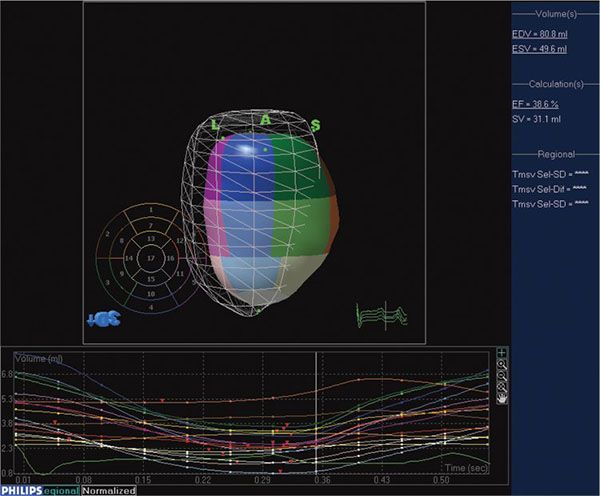
Figure 33.3. Software for processing 3DE enables quantitation of left ventricular volumes throughout the cardiac cycle, providing end-diastolic and end-systolic volume as well as ejection fraction. The mesh represents left ventricular volume at end-diastole. The cast of the left ventricular cavity consists of segments of varying colors, each of which represents a subvolume of the ventricular cavity based on the American Society of Echocardiography 16-segment model. The change in volume of each subvolume is represented graphically, with time on the X-axis and volume on the Y-axis.
MODES OF 3DE
Electronically-steered 3DE systems have two major modes of scanning: live and EKG-gated. The live mode is the only one where the system scans in 3D real-time. A defining characteristic of this mode is: if the transducer comes off the chest, the image disappears. The live 3D mode can also be operated within a three-dimensionally shaped zoom box. Live 3DE modes provide narrow (20 to 30 degrees in the elevation plane) datasets that have high voxel density. Live 3DE can be obtained on patients with arrhythmias or with an active precordium; this mode eliminates the potential for motion or stitch artifacts.
Currently, EKG-gated modes are required to provide wider volumes while maintaining adequate frame rates (Fig. 33.5). Gating allows for anywhere from two to eight smaller volumes to be stitched together to generate volumes that are greater than 90 degrees wide in the elevation plane, at frame rates exceeding 30 Hz. Gated modes have comparatively lower voxel density, and are subject to both motion and stitch artifacts. Recent enhancements have improved the ability to acquire gated full-volume data among patients with arrhythmias. Gated modes are available using grayscale or with color flow Doppler.
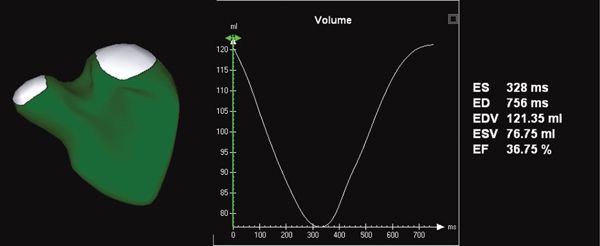
Figure 33.4. Novel software provides the ability to measure right ventricular volume throughout the cardiac cycle. This yields a surface-rendered model that is displayed as a mesh of lines and points. The change in volume of each subvolume is represented graphically, with time on the X-axis and volume on the Y-axis.
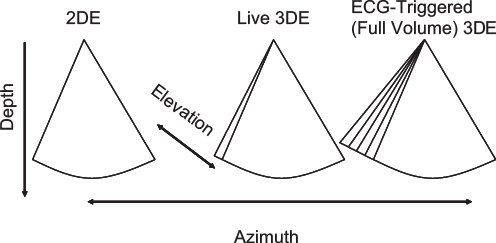
Figure 33.5. This figure depicts the differences between 2D, live 3D, and full-volume (ECG-triggered) 3DE. Conventional 2DE is shown in the left panel. Live 3DE imaging (center panel) adds the elevation plane. The shape of the image is therefore trapezoidal rather than pie-shaped. The right panel depicts ECG-triggered (full-volume) 3DE imaging, which provides a wider trapezoid.
Contemporary 3DE systems provide the user with tools to vary frame rate, 3D volume size, and image resolution. Increasing the requirement in one of these causes a drop in the other two, all things being equal.
Given the potential for motion and stitch artifacts with gated modes and the need for high spatial and temporal resolution, it has been our practice to use live 3DE to delineate anatomy in children. We also use live 3DE for the purpose of image-guidance of interventions, because instant visual feedback is critical in this application. We reserve the use of gated modes for the following:
■Targets that do not fit within a live 3DE window
■Quantitation of chamber volumes 3DE color flow demonstrations of regurgitant jets or shunt flows
Modes
Live 3DE imaging has been commercially available for transthoracic and fetal applications since 2002. Live 3DE transesophageal echocardiographic imaging became commercially available in 2007. This has yielded images never before seen of the beating heart (Fig. 33.6). We anticipate that continuing improvements in transducer technology and the wider applicability of advances in piezoelectrics will enable the application of 3DE technology to an ever-increasing range of patient sizes, windows, and applications.
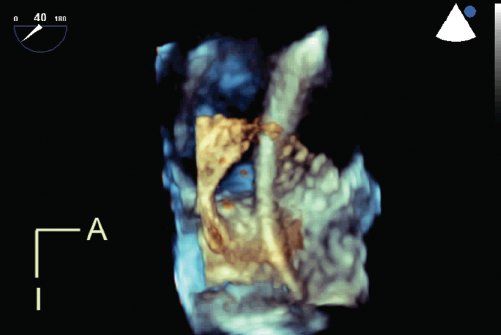
Figure 33.6. Live 3D transesophageal echocardiography demonstrates a catheter passing through a large atrial septal defect. The viewing perspective is unique: the observer is virtually located within the left atrium, looking rightwards. A, anterior; I, inferior.
CLINICAL APPLICATIONS IN CONGENITAL HEART DISEASE
3DE imaging has three broad areas of clinical application among patients with congenital heart disease: visualization of morphology, volumetric quantitation of chamber sizes and flows, and image-guided interventions.
Visualization of Morphology
Dating from an early stage in the development of 3DE technology, the structural complexity that is inherent to congenital heart disease has been identified as fertile substrate for exploration using 3DE. The recent publication of a consensus document for 3DE image orientation and display has provided the foundation for developing standardization in image display: a key factor because the addition of the third dimension has led to great flexibility and variability in image orientation. We anticipate the development of a similar consensus document for 3DE in congenital heart defects, and expect that such a document would prove of great value.
The Atrioventricular Valves
3DE is valuable in delineating the morphology of the atrioventricular valves. Espinola-Zavaleta et al. described the role of 3DE in delineating congenital abnormalities of the mitral valve. Rawlins et al. demonstrated the additive value of 3DE and improved image quality using intraoperative epicardial 3DE to delineate the anatomy of atrioventricular valves. Seliem et al. studied 41 patients with AV valve abnormalities and found that 3DE imaging was helpful in delineating the morphology of the valve leaflets and their chordal attachments, the subchordal apparatus, the mechanism and origin of regurgitation, and the geometry of the regurgitant volume. Vettukatil et al. examined the role of 3DE in patients with Ebstein anomaly of the tricuspid valve. They demonstrated that 3DE provided clear visualization of the morphology of the valve leaflets, including the extent of their formation, the level of their attachment, and their degree of coaptation. They were also able to visualize the mechanism of regurgitation or stenosis. 3DE provides unparalleled views of cor triatriatum (Video 33.3) as well as en face views of the tricuspid valve (Video 33.4).
Stay updated, free articles. Join our Telegram channel

Full access? Get Clinical Tree


