PULMONARY HYPERTENSION DEFINITION
Pulmonary hypertension is defined as an elevation in pulmonary artery pressure, with pulmonary artery mean pressure greater than 25 mm Hg at rest and/or greater than 30 mm Hg with exercise. This classic definition applies to both adults and children. There are multiple etiologies of pulmonary hypertension, many of which are much more common in the adult than the pediatric population. Table 29.1 presents the WHO classification scheme for pulmonary hypertension.
CLINICAL PRESENTATION
The symptoms associated with pulmonary hypertension in children are variable with symptomatology depending on the etiology and severity of disease as well as the age of the patient. At critical levels of pulmonary artery hypertension, symptoms may be attributed to low cardiac output. Although these symptoms may be nonspecific, they are likely to be significant and may include poor appetite and poor growth in infants, while older children may present with nausea, vomiting, activity intolerance, lethargy, or overt syncope.
INCIDENCE
The true incidence of pulmonary hypertension is not entirely clear. In recent years, the diagnosis has become more common—most likely because of a greater awareness of the disease. This is likely associated with a better understanding of the classification and underlying pathophysiology, as well as increased accessibility of diagnostic modalities such as echocardiography. It does appear that the frequency of disease may vary by gender, perhaps more so in adults than in children. The gender ratio in adult women is 1.7:1 compared to men, but some have suggested an equal ratio in females and males before adolescence. The relatively newly recognized entity of familial pulmonary hypertension comprises anywhere from 6% to 12% of cases of “idiopathic” pulmonary hypertension. It has been suggested that the mode of inheritance is autosomal dominant with incomplete penetrance. In addition, a gene for familial idiopathic pulmonary hypertension has been identified on chromosome 2q33. This gene is also believed to cause defects in bone morphogenetic protein receptor 2 (BMPR-2) and may lead to abnormalities in vascular smooth muscle, including uncontrolled proliferation. Genetic screening for BMPR-2 is available and is recommended for first-degree relatives of patients with idiopathic pulmonary hypertension. As this test has become more easily obtainable, a higher incidence of familial pulmonary hypertension may become apparent.
CLINICAL EVALUATION
The clinical evaluation of pulmonary hypertension should be directed at determining the etiology of the disease, as well as its severity, and should establish a baseline for clinical follow-up. Table 29.2 lists studies that are important in the evaluations of the patient with newly diagnosed or suspected pulmonary hypertension. Echocardiography is an essential diagnostic tool in the evaluation of pulmonary hypertension. Echocardiographic predictors of prognosis include pericardial effusion, indexed right atrial area, the degree of septal shift toward the left ventricle in diastole, tricuspid annular plane systolic excursion, pulmonary vascular capacitance, RV myocardial performance index and right ventricular systolic function. Noninvasive assessment of pulmonary arterial pressure is a routine component of a comprehensive echocardiographic evaluation. The two-dimensional scan may suggest elevation in right-sided pressures. Doppler is used both to confirm the presence of pulmonary hypertension and quantify its severity. As a result, the echocardiogram plays a pivotal role in the diagnosis, identification, and follow-up of patients with pulmonary hypertension.
TWO-DIMENSIONAL ECHOCARDIOGRAPHY
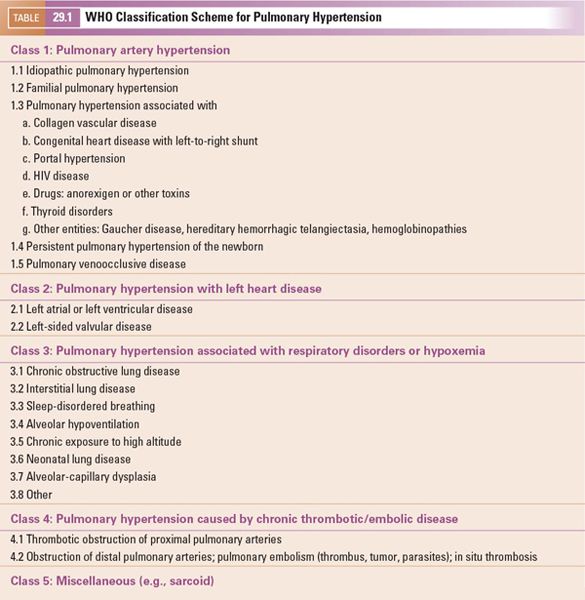
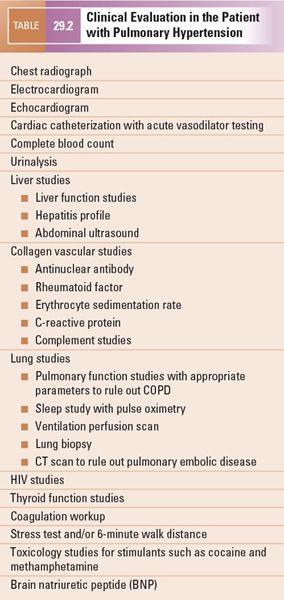
Severe pulmonary hypertension can often be recognizable by routine two-dimensional echocardiography. In the normal heart, left ventricular pressure is greater than right ventricular pressure. Subsequently, parasternal short-axis imaging demonstrates a circular left ventricle with the septal curvature being convex toward the right ventricle and concave toward the left ventricle. During ventricular systole, the septum moves toward the center of the left ventricle. The septum retains its convex curvature toward the right ventricle and concave curvature toward the left ventricle throughout the cardiac cycle. Pulmonary hypertension results in right ventricular pressure that may equal or exceed left ventricular pressure, causing septal flattening or a reverse septal curvature during systole. This may result in left ventricular compression, best seen in both parasternal long- and short-axis imaging (Fig. 29.1, Video 29.1). The majority of patients with pulmonary hypertension will have significant right ventricular and right atrial dilatation. Right ventricular hypertrophy is also common (Fig. 29.2, Video 29.2). Additionally, right ventricular systolic and diastolic function may be impaired. Right ventricular systolic dysfunction can be suggested by visual estimates or quantitatively estimated as discussed elsewhere in this text. However, these clinical clues and findings may be subtle, particularly with mild or moderate elevation in pulmonary arterial pressures. Therefore, the echocardiographer must maintain a high level of suspicion during image acquisition and interpretation.
Once pulmonary hypertension has been suggested by clinical examination or initial echocardiographic imaging, a comprehensive, detailed examination should be undertaken to evaluate for congenital heart disease that may lead to pulmonary hypertension. The segmental approach using a complete two-dimensional assessment should be carried out with the goal of identifying potential sources of pulmonary hypertension including left-to-right shunts and obstructive lesions. Since many of the two-dimensional echocardiographic features as well as Doppler gradients actually predict right ventricular systolic pressure and not pulmonary artery pressure, one must take particular care to exclude obstructive lesions such as pulmonary stenosis and branch pulmonary artery stenosis (Fig. 29.3). Once right ventricular outflow tract obstruction has been excluded, right ventricular pressure can be considered as a surrogate of pulmonary artery pressure.
An intracardiac shunt can be found at any level: atrial, ventricular, or great arteries. Mean pulmonary artery pressure is derived by the product of pulmonary vascular resistance and pulmonary blood flow, which both can be affected by left-to-right intracardiac shunts. Early in the disease course, significant left-to-right shunt lesions result in increased flow to the pulmonary vascular bed. The increased flow results in increased mean arterial pulmonary pressure. Over time, increased pulmonary flow results in a progressive increase in pulmonary resistance with a concomitant increase in pulmonary artery pressure. As the pulmonary pressure approaches systemic pressure, as a result of either increased flow or resistance, care must be taken to not rely on color Doppler to identify these intracardiac shunts since low-velocity shunting is often present because of equalization of systemic and pulmonary arterial pressure.
DOPPLER ECHOCARDIOGRAPHY
Although qualitative data can be obtained by two-dimensional echocardiography, actual hemodynamic data is best estimated by Doppler echocardiography.
Tricuspid Regurgitation
Tricuspid regurgitation is common in patients with and without pulmonary hypertension. Doppler measurement of tricuspid regurgitation velocity accurately predicts right ventricular systolic pressure in patients with a wide spectrum of both acquired and congenital heart disease. The maximal right ventricular to right atrial systolic velocity via continuous-wave Doppler interrogation of the tricuspid regurgitation jet is utilized. Typically, the apical four-chamber view and parasternal short- and long-axis planes allow for optimal alignment of continuous-wave Doppler using either an imaging or a non-imaging transducer. However, nonstandard “off-axis” views may be needed to achieve optimal alignment with the tricuspid regurgitant jet.
With careful adjustment of the transducer orientation with color Doppler guidance to ensure an optimal incident angle, Doppler echocardiography offers an accurate, noninvasive approach to determining right ventricular systolic pressure (RVSP). Currie et al. confirmed this with simultaneous continuous-wave Doppler echocardiography and invasive right-sided cardiac pressure measurements (Fig. 29.4). The tricuspid regurgitant velocity (TRV) reflects the peak right ventricular–to–right atrial pressure (RA) difference, as stated by the modified Bernoulli equation:
RVSP – RA = 4 (TRV)2
and
RVSP = 4 (TRV)2 + RA
Right atrial pressure can be estimated via several techniques. If a central venous catheter is present, direct right atrial pressure measurements can be obtained. The right atrial pressure can be estimated clinically by evaluating the jugular venous distention; however, this is difficult in children and impractical in a busy echocardiography laboratory. Kirchner et al. demonstrated that two-dimensional echocardiographic estimates of right atrial pressure can be obtained by evaluating the inferior vena cava. Subcostal imaging of inferior vena caval collapse within 2 cm of the right atrium correlates with right atrial pressure. Patients with an inspiratory collapse of the inferior vena cava greater than 50% tend to have a right atrial pressure less than 10 mm Hg, while those having less than 50% collapse tend to have right atrial pressure greater than 10 mm Hg. Ommen et al. suggested that a combination of hepatic venous Doppler evaluation in addition to inferior vena cava diameter changes with respiration can further predict right atrial pressure. In adults, if the inferior vena caval diameter is less than 15 mm Hg and the systolic forward flow Doppler velocity is greater than the velocity of atrial reversal in the hepatic vein, an estimated right atrial pressure of 5 mm Hg can be used. Alternately, if the inferior vena cava diameter is greater than 20 mm and systolic forward flow is less than the velocity at atrial reversal, an estimated right atrial pressure of 25 mm Hg can be used. All other patients can be assumed to have a right atrial pressure of 14 mm Hg.
Figure 29.1. Severe right ventricular (RV) hypertension resulting in septal flattening and reverse septal curvature bowing toward the left ventricle (LV). Also note the RV dilation and RV hypertrophy. A: Parasternal long-axis imaging of severe RV hypertension resulting in compression of the LV. B: Parasternal short-axis imaging demonstrating the D-shaped LV.
Practically, the importance of accurate right atrial pressure is greatest at intermediate tricuspid regurgitant Doppler velocities. For example, a tricuspid regurgitation velocity of 2.5 m/s with a right atrial pressure of 5 mm Hg results in a calculated systolic pulmonary pressure of 30 mm Hg. However, if the right atrial pressure is 20 mm Hg, the same 2.5 m/s Doppler velocity would estimate a pulmonary pressure of 45 mm Hg. In contrast, if the tricuspid regurgitant velocity is 5 m/s, the error associated with accurate right atrial pressure estimation is of little clinical importance (105 mm Hg versus 120 mm Hg) since both values suggest severe pulmonary hypertension.
Figure 29.2. RV dilation and hypertrophy in pulmonary hypertension. A: Apical four-chamber imaging will typically demonstrate right ventricular (RV) dilation with significant pulmonary hypertension. This may often be the first echocardiographic sign of elevated pulmonary pressures. B: Also, with longstanding hypertension, there will be significant RV hypertrophy (arrows). RA, right atrium; LV, left ventricle; LA, left atrium.
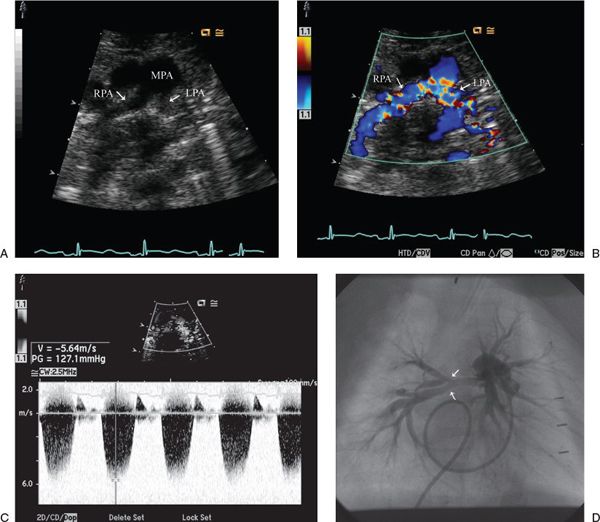
Figure 29.3. The presence of severe right ventricular hypertension was suggested by right-to-left shunting through a ventricular septal defect. A: Suprasternal notch imaging revealed bilateral branch pulmonary artery hypoplasia (arrows). LPA, left pulmonary artery; MPA, main pulmonary artery; RPA, right pulmonary artery. B: Color Doppler imaging demonstrates marked flow acceleration. C: PAH is confirmed by continuous-wave Doppler interrogation calculating a gradient of 127 mm Hg. The patient was found to have Williams Syndrome. D: Angiography demonstrated severe branch pulmonary artery hypoplasia with multiple areas of segmental stenosis (arrows).
Pulmonary Regurgitation
Pulmonary regurgitation is present in many normal individuals as well as in a large percentage of patients with congenital heart disease and nearly all patients with pulmonary hypertension. Pulmonary artery diastolic pressure can be estimated from the end-diastolic velocity of pulmonary regurgitation Doppler signal (Fig. 29.5). At end-diastole, the pulmonary regurgitation end-diastolic velocity (PREDV) jet represents the pressure difference between the pulmonary artery end-diastolic pressure and the right ventricular end-diastolic pressure. In the absence of tricuspid stenosis, the right ventricular end-diastolic pressure can be assumed to be equal to right atrial pressure (RAP). Therefore, pulmonary artery end-diastolic pressure (PAEDP) can be estimated using the modified Bernoulli equation:
PAEDP = 4 (PREDV)2 + RAP
Underestimation of the pressure gradient by the Doppler method may be caused in part by the inability to align the Doppler angle of interrogation parallel to the direction of the pulmonary regurgitant jet. Therefore, color Doppler should be used to guide the incident angle since the direction of the regurgitant jet is not predictable from the anatomy of the surrounding anatomic structures.
Ventricular Septal Defect
Stay updated, free articles. Join our Telegram channel

Full access? Get Clinical Tree


