Chapter 92 Three-Dimensional Cardiac Mapping Techniques in Catheter Ablation
Electroanatomic Mapping Systems
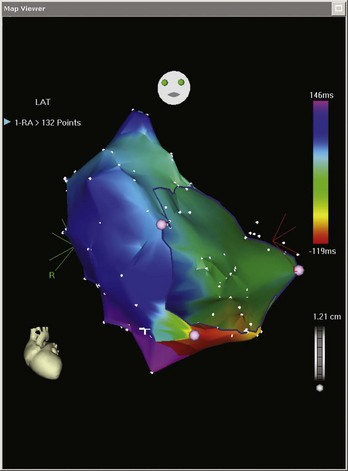
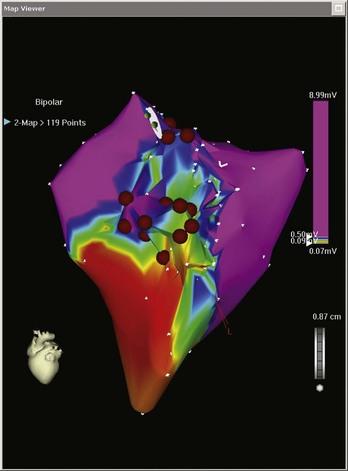
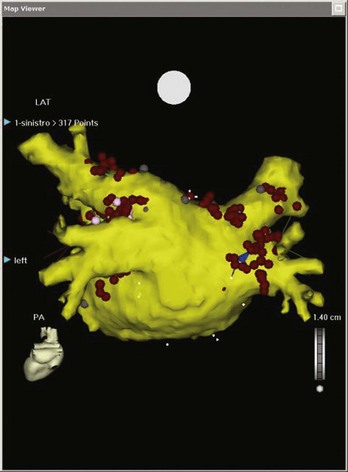
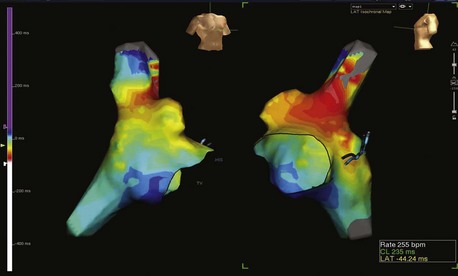
Electroanatomic mapping systems build a three-dimensional image of a cardiac chamber by incorporating sequential electrogram data from an entire cardiac chamber or chambers if necessary. An electrophysiological catheter in contact with the endocardium or the epicardium records voltage (amplitude of the electrical signal) and timing (relation of the recorded electrogram to a fixed-reference electrode electrogram). Low-voltage areas and scar can be easily identified, which makes it possible to elucidate the overall underlying substrate through which an arrhythmia persists. Recording electrogram timings throughout the chamber enables an activation map to be created, which is color coded to differentiate between “early” and “late” signals with respect to the reference electrode (Figure 92-1). These data can also be viewed in the form of a propagation map, in which a representation of the excitatory wavefront of activation advances across the chamber geometry (see Video 92-1 on the Expert Consult site for this text). Maps can be rotated on the monitor or viewed in multiple orientations simultaneously so the wavefront can be followed throughout the cardiac cycle. Electroanatomic mapping systems are not particularly suitable for activation mapping during unstable rhythms, although mapping in discrete areas can be performed during separate tachycardia episodes, thereby building a map over a longer period. Data acquired during sinus rhythm can also be used to target ablation, which is particularly useful when mapping ventricular tachycardia (VT) in abnormal hearts. This method obviates the need for mapping during tachycardia by defining the arrhythmogenic substrate (Figure 92-2).
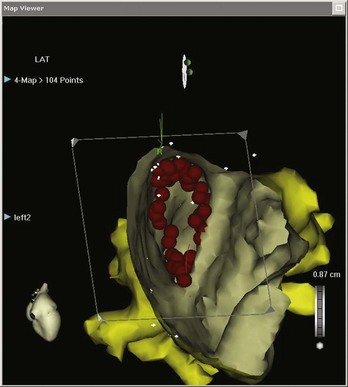
Once generated, the combination of voltage and activation maps can be very useful in guiding the electrophysiologist in placing focal ablation lesions or creating lines of ablation. This may be between important scar boundaries (e.g., lines of ablation transecting the diastolic pathway in VT circuits) or between inert structures (e.g., linear ablation between the tricuspid valve annulus and the inferior vena cava in isthmus-dependent atrial flutter [AFL]). In addition, these systems facilitate the encirclement of cardiac structures, the best example of which is the encirclement of pulmonary veins as part of the treatment for ablation of atrial fibrillation (AF). Maps do not have to be viewed exclusively from the outside. Sagittal, coronal, or transverse sections, or any other user-defined plane, can be mapped so the operator can view the chamber from the inside (Figure 92-3).
The CARTO System
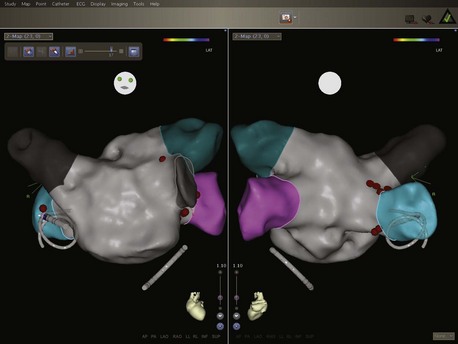
The latest iteration of this technology is the CARTO 3 system. In addition to the use of magnetic location technology, this system also uses six additional patches on the patient’s skin. Integration of information from current measurements between the catheters and these patches with information from the magnetic location technology has a number of advantages. Multiple catheters can be tracked, and the system is able to compensate better for patient movement (Figure 92-4). Maps can be generated rapidly by collecting data from all the electrodes of a circular mapping catheter simultaneously. It is also possible to alter the degree of interpolation between points, thereby reducing the potential to create “false space” within geometries and reproduce the true endocardial surface more accurately. Increased mapping technology accuracy reduces the requirement for fluoroscopy and also for contrast angiography, which has been the gold standard for delineation of endocardial shape and is used in many centers prior to geometry creation. From initial experience, CARTO 3 may reach this degree of accuracy and may mitigate the need for x-ray exposure even more than other available systems. In addition, the system produces higher quality recordings of the electrograms, removing the problems from 50 Hz noise that were present on earlier systems.
CARTO Merge
Digital images are imported into the system and segmented manually. They are then integrated into the mapping study at the time of the procedure. With fluoroscopy, fixed anatomic landmarks close to the chamber of interest are identified and acquired as geometric location points, such as the left atrial appendage or the ostia of the pulmonary veins. These points are then registered with their corresponding sites on the CT or MRI image and are then merged so the catheter tip can be navigated within the scanned anatomic image on screen (Figure 92-5).
Cartosound
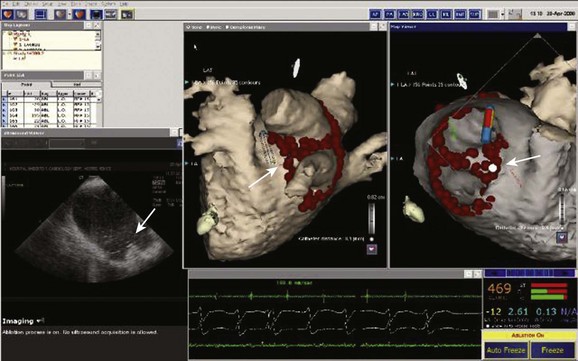
The CARTOSOUND variant of the CARTO system integrates intracardiac echocardiography (ICE) or transesophageal echocardiography (TEE) data with the CARTO mapping system. One of its principal advantages is the ability to construct a left atrial geometry before obtaining left atrial access with an ICE/TEE probe placed in the right atrium or other right-sided structure, such as the left pulmonary artery. The latest version uses three-dimensional echocardiographic technology, and three-dimensional ICE images can be displayed alongside CARTO mapping geometries. The ICE data can also be used to merge with a CT or MRI scan as above. The other potential advantages of this approach relate to the use of ICE/TEE in general. Echocardiographic imaging can guide trans-septal puncture, confirm catheter-tissue interface or tenting, identify catheter-related thrombus formation, and other potential complications, including cardiac tamponade (Figure 92-6).
EnSite system
Ensite NavX
The EnSite system (St Jude Medical, Inc., St Paul, MN) uses changes in impedance to calculate catheter position in three dimensions. This methodology is based on the principle that applying an electrical current across two surface electrodes creates a potential gradient along the axis between the electrodes. Six surface electrodes are placed on the patient’s chest in three pairs: anterior to posterior, left to right lateral, and superior (neck) to inferior (leg). The three electrode pairs form three orthogonal axes (X-Y-Z), with the heart at the center. A 5-kHz signal is sent alternately through each pair of surface electrodes to create a voltage gradient along each axis, forming a transthoracic electrical field. As a catheter enters the transthoracic field, the voltage signal corresponding to 5 kHz is measured at each catheter electrode, timed to the creation of the gradient along each axis. By using the sensed voltages compared with the voltage gradient on all three axes, the EnSite NavX software calculates the three-dimensional position of each catheter electrode. The calculated position for all electrodes occurs simultaneously and repeats 93 times per second. The EnSite System displays the located electrodes as catheter bodies with real-time navigation. It permits the simultaneous display of multiple catheter electrode sites and also reflects real-time motion of both ablation catheters and those positioned elsewhere in the heart.1
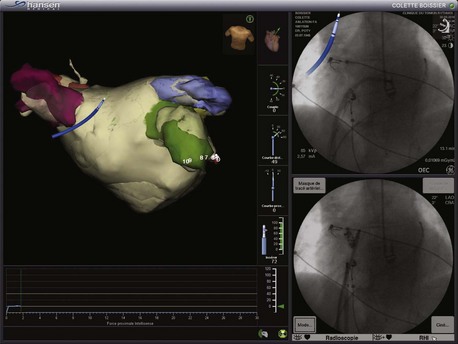
The latest user interface of the NavX system is called EnSite Velocity. One of the principal advantages of this system is its open platform. Catheters from any manufacturer can be used and displayed with this system, making it extremely versatile. NavX was the first electroanatomic system that enabled visualization of all catheters on top of three-dimensional spatial information and mapping data. Another advantage of the latest iteration of this system is the OneMap Tool. This allows collection of anatomic and electrical data (voltage or activation) simultaneously from all electrodes from all catheters. This means that the operator has to navigate to each endocardial position only once to generate both an anatomic shell and an activation or voltage map (Figure 92-7). Previous software iterations would have required two separate mapping procedures, so this feature can significantly save procedural time. The EnSite System can also be integrated with the Sensei robotic catheter system (Hansen Medical, Mountain View, CA), allowing completely remote catheter navigation (Figure 92-8).
Stay updated, free articles. Join our Telegram channel

Full access? Get Clinical Tree


