Fig. 6.2 The U wave. This ECG shows the position of the U wave. Their origin is uncertain, and there maybe a number of physiological explanations. Most people do not show U waves. When present, they may be normal (e.g. the young), or, if associated with flat T waves, may indicate hypokalaemia. If the ECG shows a long QT interval, they may indicate hereditary long QT syndrome. They also occur in other pathologies.
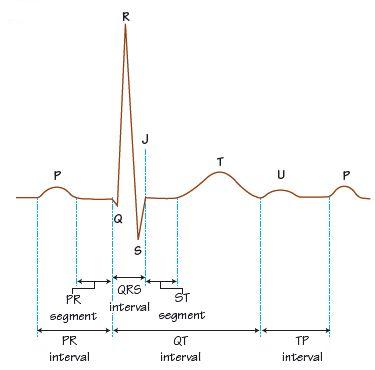
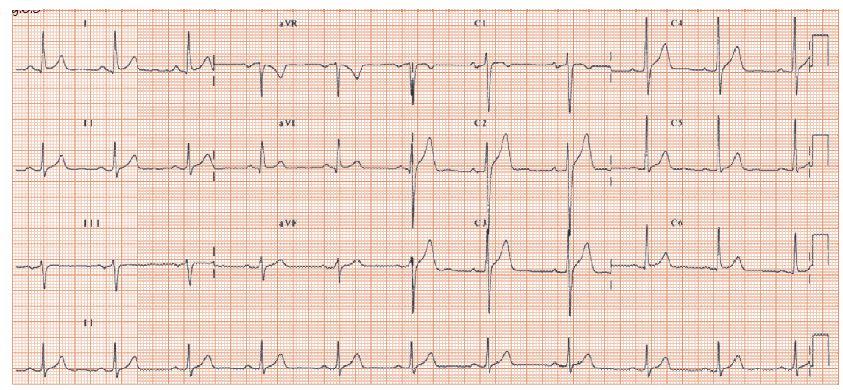
Fig. 6.3 Normal 12-lead ECG. This ECG is used to illustrate the normal T wave. Note that wherever there is a well-developed R wave, the T wave is clearly upright. Where there is a poor R wave, the T wave is equivocal (e.g. lead III, V1), and in lead aVR, where there is no R wave, rather there being a well developed Q wave, the T wave is inverted.
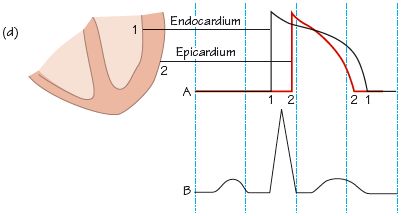
The T wave reflects current movement during repolarization. In understanding the T wave, note that:
- The direction of depolarization is endocardial to epicardial (from inside the heart to the outside), as the first tissue to depolarize is closest to the specialized conducting tissue (the Purkinje cells), which lies just under the endocardium (Fig. 6.1a–c

Stay updated, free articles. Join our Telegram channel

Full access? Get Clinical Tree


