Fig. 18.1
A representative EKG significant for Q waves in the lateral precordial leads and an ST elevation in V4
An echocardiogram (Fig. 18.2) was consistent with finding of an LV aneurysm. Ejection fraction was 23 %.
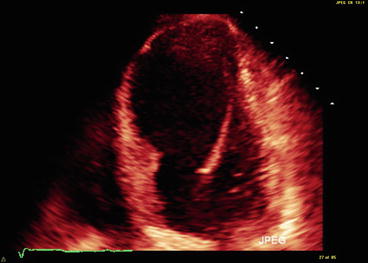
Fig. 18.2
Left ventricular aneurysm on an echocardiogram
Clinical Basics
Normal Anatomy
A normal cardiac exam is limited to an S1 and S2 heart sounds, with S2 split on inspiration.
Definitions
A ventricular gallop sound is an extra heart sound. There are two types of gallop sounds, S3 and S4.
S3 gallop is a low frequency, early to mid-diastolic sound.
In the normal heart during normal sinus rhythm, diastolic filling of the ventricle across the atrioventricular valves occurs in two phases, early and atrial filling. There are characterized by Doppler echocardiography:
E wave is the characteristic wave seen on Doppler related to passive filling of the ventricle.
A wave is active filling with atrial systole seen on Doppler.
E and A waves representing mitral flow in a healthy heart (E > A). E wave is classically greater than A wave since passive filling encompasses 80 %. In conditions that limit ventricular compliance two abnormalities are possible:
reversal – in which the A wave is greater than the E wave. This indicates slow filling caused by older age, hypertension, left ventricular hypertrophy (LVH), or diastolic dysfunction.
Etiology
There are two phases of ventricular filling. To start the first phase, ventricular blood pressure drops sufficiently to allow the opening of the AV valves. Blood rapidly flows from the atrium to the ventricles comprising 80 % of filling. The recipient ventricle actively relaxes to accommodate the increased volume. The rapid deceleration of blood as it hits the ventricles can produce a protodiastolic sounds called S3. S3 can be physiologic in children and young adults or pathologic. In pathologic cases, the ventricles are stiff due to heart failure or structural heart disease [1]. See Fig. 18.3.
Fig. 18.3
Progression of structural heart disease that leads to the development of the third heart sound
The sound is heard after the E wave (ventricular filling) due to rapid E wave deceleration due to a non-compliant heart. All heart beats cause these oscillations, but only some have the correct frequency and intensity to be as audible as an S3 [1, 2]. At increased heart rates, the timing of the S3 relative to the start of the next cardiac cycle shortens, leading to a characteristic heart sounds of “buh-buh-buh, buh-buh-buh.” See Fig. 18.4.
Fig. 18.4
Multiple oscillations in the cardiac blood pool, including the S3 sound in early diastole. At increased heart rates, the timing of the S3 relative to the start of the next cardiac cycle shortens, leading to a characteristic heart sounds of “buh-buh-buh, buh-buh-buh”
E wave deceleration results in loss of fluid kinetic energy and cardiohemic oscillations. Differences can be seen in this between pathologic and physiologic S3. See Fig. 18.5.
Fig. 18.5
(a) Several consecutive beats of the phonocardiogram from a volunteer without an audible S3. For the untrained observer, S3 features are difficult to discern from baseline noise. (b) Filtered, averaged log power of the phonocardiogram above. Note clear S3 feature for each cardiac cycle, although no S3 could be heard. (c) Simultaneous Doppler profile, E-wave contour, phonocardiogram, and model-predicted S3 for the heartbeat in a indicated by the arrow. E-wave parameters: x o = −11.2 ± 0.6 cm, c = 12.6 ± 1.9 g/s, and k = 214 ± 7 g/s2. S3 model parameters: C = 50 g/s, μ/S = 0.5 %, and Δx = 0.2 cm. PDF indicates parameterized diastolic filling (Used with permission from Manson et al. [2])
Physiologic S3 arise from higher E wave velocities.
Pathology S3 arise from steeper E wave deceleration [2].
Signs and Symptoms
Common cardiac findings associated with an S3 include:
High left atrial pressure.
Noncompliant left ventricle.
Restrictive filling characteristics.
Reduced LV systolic function (also in diastolic dysfunction).
When present, valvular disease is more likely to be severe [3].
Key Auscultation Findings
Examine the patient in a quiet environment because an S3 is a low intensity sound and is easily obscured by extraneous room sounds.
Examination in the left lateral decubitus position should accentuate the sound.
Have the patient temporarily suspend their respiration and listen over the left ventricular apex [1].
Should be a soft, low frequency sound best heard with the bell.
Sound should be heard during early-mid diastole (.13–.16 s after S2) with a timing that is relatively unaffected by heart rate.
Note: The A2-S3 interval can shorten in conditions that shorten IVR and very high heart rates.
S3 is a localized finding on the exam, and is heard usually in a discrete area (does not radiate widely) [5].
S3 can be further accentuated by increasing venous return or increasing flow across the AV valve:
Increasing venous return can be achieved by passively lifting the patient’s legs while they are in a supine position.
Increase AV flow by having the patient exercise (e.g., stair climbing) to increase venous flow return and accelerate the heart rate [1].
Auscultation example of an S3 gallop.
Click here to listen to an example of an S3; also soft Still’s murmur: Echo is within normal limits. A phonocardiogram is also shown (Video 18.1).
Click here to listen to examples of several patients with an S3 gallop, including a 60 year old woman with ventricular gallop, as described by Dr. W. Proctor Harvey (Video 18.2).
Auscultation Differential Diagnosis
S3 can be heard both in normal young adults and in the setting of heart failure. Physical exam findings can help distinguish between physiologic S2, right-sided S3, and left-sided S3. Right-sided S3 is accompanied by the constellation of findings classically seen in right-sided heart failure: hepatosplenomegaly, peripheral edema, pleural effusions, and ascites. In contrast, patients with left-sided S3 typically have the pulmonary congestion symptoms seen in left-sided heart failure.
< div class='tao-gold-member'>
Only gold members can continue reading. Log In or Register to continue
Stay updated, free articles. Join our Telegram channel

Full access? Get Clinical Tree


