Fig. 5.2 (a) The size of the normal QRS complex in the chest leads. The R wave increases initially as one progresses from lead V1 to V6, while the S wave decreases till a maximum R wave is reached (usually around lead V4). The maximum R wave size is in the lead overlying the largest bulk of the left ventricle. The R wave of the QRS complex then declines slightly in size. The transition point is where the R wave height = the S wave depth, and is usually around lead V3. Its physiological significance is that this is along a line extending down the interventricular septum; (b) shows this in the typical heart. The transition point may be moved either earlier (i.e. towards V1), termed ‘clockwise rotation’, or towards lead V6, termed ‘anti-clockwise’ rotation. If the R wave height in the anterior leads does not increase steadily, the term ‘poor anterior R wave progression’ is applied (c). This can be due to obesity (which results in counter-clockwise rotation of the heart), or to damage to the front of the heart (e.g. an old anterior wall myocardial infarction [MI]). LA, left atrium; LV, left ventricle; RA, right atrium; RV, right ventricle.
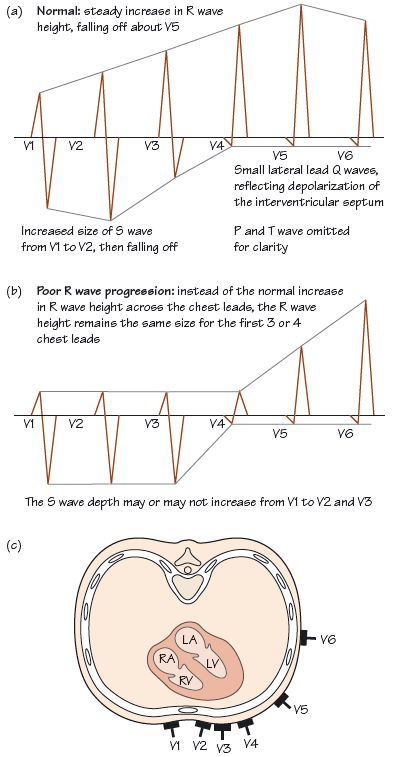
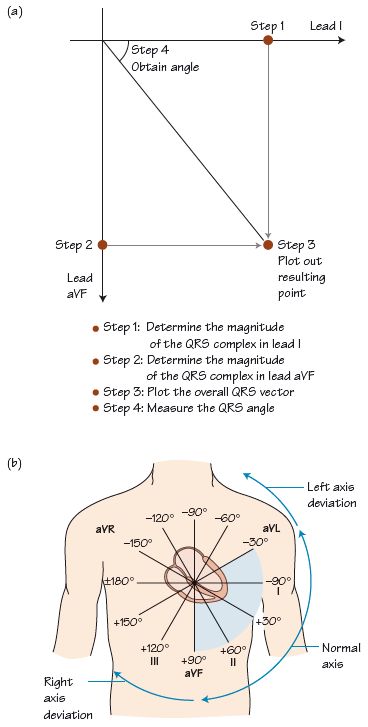
Fig. 5.3 (a) Determination of the QRS axis. The maximum R wave in the QRS complex is obtained from two leads (in this example leads I and aVF) at right angles to each other, and plotted out: the resulting angle is measured and termed the QRS axis. (b) Normal and abnormal QRS axis.
Stay updated, free articles. Join our Telegram channel

Full access? Get Clinical Tree


