The Electrocardiogram
Interpretation of the Electrocardiogram
In Chapter 8 on coronary artery disease, the electrocardiogram (ECG) bowed on stage because it is very useful in diagnosing myocardial infarction and other complications of coronary artery disease. From this point on the ECG will appear frequently. It’s time to become familiar with it.
When someone is lying quietly, the only muscle moving vigorously is the heart muscle. In Chapter 6, it was made clear that the heart muscle contracts because it has its own built-in electric circuit driving it. It’s easy to record this electric circuit by placing electrodes on the surface of the body and attaching them to a suitable recording device (Fig. 11-1). If you wanted to take a complete picture of a building, you would have to walk around it with your camera, taking shots of the front, sides, and back. To take a complete picture of the electric field of the heart, you have to record 12 different views. This is done by recording from different pairs of electrodes at various points on the limbs and the chest (Fig. 11-2).
The passage of the activating wave across the tissues of the heart is recorded in sequence from top to bottom, or, more accurately, from the sinoatrial node across the atria, down the AV node, and through the ventricles.
Start with the Sinoatrial Node
The sinoatrial node fires and the electric wave starts across the atria. This produces the first wave of the ECG, called the P wave. The width of the P wave measures the time required for the wave to travel across the atria. Each small square on the ECG paper equals 0.04 second, so taking that measurement is easy (Fig. 11-3).
The wave next moves down the AV node. Nothing shows on the surface ECG during this period: there’s a flat segment (Fig. 11-4).
After passing through the AV node, the wave enters the bundle branch system and darts across the ventricles very quickly, at about 4 meters per second. This produces the sharp up-and-down waves of the ventricular complex—the QRS complex (Fig. 11-5).
 FIGURE 11-1 Placement of electrodes on the skin for recording the electric field of the heart. |
 FIGURE 11-2 Twelve electrodes are placed on the chest and limbs. |
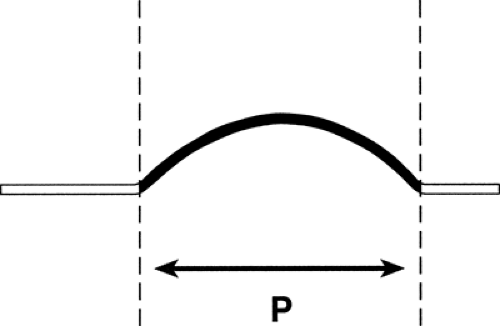 FIGURE 11-3 P wave. |
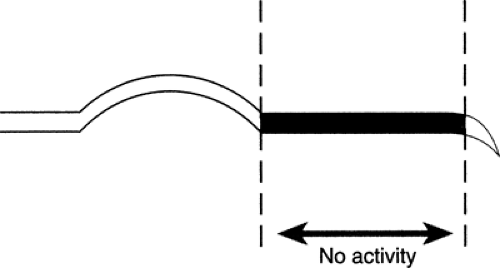 FIGURE 11-4 AV node. |
 FIGURE 11-5 Width of QRS in a normal heart. |
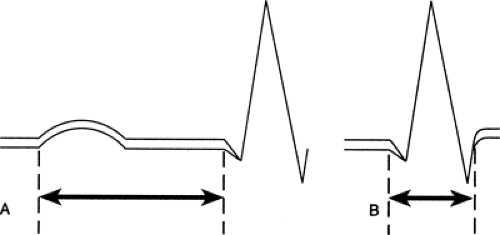 FIGURE 11-6 A. The PR interval. Normal is 0.12 to 0.20 second. B. QRS width. Normal is 0.10 second or less. |
Now, it’s possible to measure three important intervals (Fig. 11-6):
The PR interval—the time from the beginning of the P wave to the end of the passage through the AV node.
The QRS width—the time it takes the electric impulse to travel across the ventricles.
The QT interval—the interval between the first deflection of the ventricular complex and the end of the T wave. (Sometimes there’s no Q, so you just measure
from the first upstroke of the R.) This interval is very important: prolongation of the QT interval may indicate a potentially lethal abnormality.
 FIGURE 11-7 T wave. |
There’s a short pause after the wave reaches the end of its course, and then a return wave rolls back, restoring the conducting cells to normal. This is called the T wave (Fig. 11-7).
Wave Names
If the first part of the ventricular complex is a down wave, it’s called a Q wave. Any upward wave is called an R wave. Any downward wave after an R wave is called an S wave. Depending on the lead being recorded, it’s possible to see any combination of these waves in a normal heart (Fig. 11-8).
The interval between the end of the QRS complex and the T wave is called the ST segment. It should be flat, exactly on the zero line, because there shouldn’t be any electric activity during this period (Figs. 11-9 and 11-10).
Since the electric activation of the heart can be recorded with an accuracy to a hundredth of a second, the ECG can detect any abnormality of heart rhythm. It can also record failure of conduction through the various parts of the electric system. It should be possible to diagnose abnormalities of heart rhythm and conduction with almost 100% accuracy by means of the ECG. This is the first and most important use of the instrument.
 FIGURE 11-8 Nomenclature of Q, R, and S waves.
Stay updated, free articles. Join our Telegram channel
Full access? Get Clinical Tree
 Get Clinical Tree app for offline access

|