The Basic Electrophysiology Study
The basic electrophysiologic (EP) investigation involves the placement of recording catheters in standard locations in the heart. Catheters with multiple (4 to 10) platinum electrodes through which electrical activity can be delivered and recorded are advanced through the venous system (inferior vena cava [IVC] or superior vena cava [SVC]) or retrogradely through the aorta. During a basic diagnostic EP study, catheters are placed in the right atrium (usually right atrial appendage [RAA]), across the tricuspid annulus, in the coronary sinus (CS) and in the right ventricular apex. The catheter in the RAA records a right atrial electrogram. The catheter placed across the tricuspid valve can record an atrial electrogram as well as a His bundle deflection and a ventricular electrogram (see Fig. 4-1).
The size of the atrial electrogram in reference to the ventricular electrogram defines whether the recording is a more proximal or distal His bundle tracing. In other words, if the atrial deflection is large or equal to the ventricular electrogram, the His electrogram represents a proximal His potential. Conversely, if the atrial deflection is small compared with the ventricular electrogram, the His deflection represents a distal His recording (see Fig. 4-2). The proximal portion of the His bundle can also be recorded from the left side of the heart by placement of a recording catheter in the noncoronary cusp or just below the aortic valve (see Fig. 4-3).
The CS is usually cannulated with a decapolar catheter. The proximal poles record activity near the CS and the distal poles record activity in the
anterolateral region of the atrioventricular (AV) groove. In general, normal atrial conduction will demonstrate activation of the CS from proximal to distal to the lateral wall of the left atrium indicating earliest activation from the right atrium at the region of the ostium of the CS. When the catheter is placed deep in the CS near the anterior interventricular vein, activation will occur earlier or simultaneously in the distal CS recording electrodes as the proximal CS. This indicates conduction over the Bachmann bundle (see Fig. 4-4).
anterolateral region of the atrioventricular (AV) groove. In general, normal atrial conduction will demonstrate activation of the CS from proximal to distal to the lateral wall of the left atrium indicating earliest activation from the right atrium at the region of the ostium of the CS. When the catheter is placed deep in the CS near the anterior interventricular vein, activation will occur earlier or simultaneously in the distal CS recording electrodes as the proximal CS. This indicates conduction over the Bachmann bundle (see Fig. 4-4).
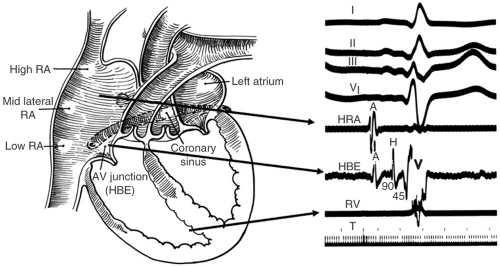 FIGURE 4-1. Schematic diagram of standard diagnostic catheters positioned to measure conduction intervals. RA, right atrium; HRA, high right atrium; AV, atrioventricular; HBE, His bundle electrogram; RV, right ventricle. (Adapted from Josephson ME. Clinical Cardiac Electrophysiology, 4th ed. 2008.) |
 FIGURE 4-2. Demonstration of a distal and proximal recorded His electrogram. HRA, high right atrium; HBE, His bundle electrogram; RV, right ventricle. (Adapted from Josephson ME. Clinical Cardiac Electrophysiology, 4th ed. 2008.) |
 FIGURE 4-3. Demonstration of His bundle electrograms recorded from the right ventricle and left ventricle. RVA, right ventricular apex; LHBE, left His bundle electrogram; RHBE, right His bundle electrogram. (Adapted from Josephson ME. Clinical Cardiac Electrophysiology, 4th ed. 2008.) |
The right ventricular catheter is placed at the apex and/or outflow tract and records a right ventricular electrogram. A potential representing the right bundle (RB) branch can be detected approximately 10 to 30 msec before the ventricular electrogram depending on catheter position (see Fig. 4-5). The most important feature of A, V, and CS catheters is position, stability, and good pacing thresholds.
Normal Intervals
The AH interval is measured in the His bundle tracing and represents conduction time from the low right atrium through the AV node to the His bundle (see Fig. 4-6). Most AH interval represents delay in conduction through the AV node which is engaged during the middle of the sinus P wave on the electrocardiogram and is significantly modulated by autonomic tone. The normal AH interval is 60 to 125 msec.
A long list of abnormalities can cause baseline prolongation in the AH interval including heightened vagal tone, infectious processes such as Lyme disease, infarction (inferior myocardial infarction [MI]), or fibrocalcific degeneration. An abnormally short AH interval is generally the result of accelerated AV nodal conduction, most often due to heightened sympathetic tone. This may occur
due to conduction over a fast pathway in an individual with dual AV nodal pathways. Another rare cause of an abnormally short AH interval with normal ventricular activation (e.g., narrow QRS) is a bypass tract between the atrium and His bundle (i.e., atrio-His bypass tract).
due to conduction over a fast pathway in an individual with dual AV nodal pathways. Another rare cause of an abnormally short AH interval with normal ventricular activation (e.g., narrow QRS) is a bypass tract between the atrium and His bundle (i.e., atrio-His bypass tract).
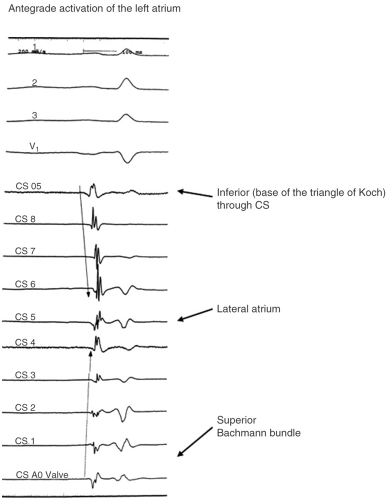 FIGURE 4-4. Demonstration of the Bachmann bundle conduction with simultaneous activation of the coronary sinus ostium (CS OS) and the distal coronary sinus (CS 1 and CS aortic valve). |
The HV interval is the time from the earliest (most proximal) recorded His potential to the earliest recorded ventricular deflection (measured in the His tracing or surface QRS) (Fig. 4-6). The duration of the normal His deflection is at most 25 to 30 msec and the normal range for HV intervals is 35 to
55 msec. In the presence of left bundle branch block (LBBB), the HV can be up to 60 msec. Care must be taken to record the most proximal His potential (a His catheter recording which has an atrial signal on it as well). Occasionally a split His recording will be noted. In this case two potentials, each representing His activation, will be recorded after the atrial signal (see Fig. 4-7). This finding is
indicative of His bundle disease. A multicomponent atrial electrogram can be confused for a His bundle potential. Incremental atrial pacing or maneuvers to delay AV nodal conduction will separate a true His potential from a multicomponent atrial electrogram.
 FIGURE 4-5. Demonstration of the timing of the His bundle (HB) and right bundle (RB) branch electrograms. HRA, high right atrium; RV, right ventricle. |
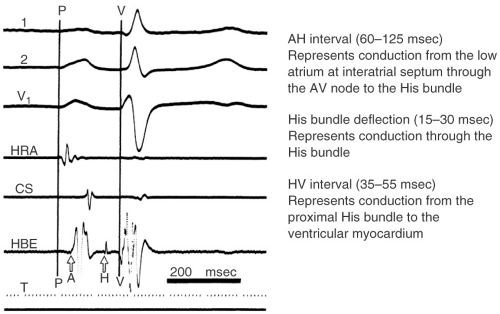 FIGURE 4-6. Determination of basic conduction intervals. HRA, high right atrium; CS, coronary sinus; HBE, His bundle electrogram; AV, atrioventricular. |
 FIGURE 4-7. Two to one conduction with a split His bundle electrogram (HBE) on the conducted beats and block after the first component of the split His on the nonconducted beats. RVA, right ventricular apex. |
Stay updated, free articles. Join our Telegram channel

Full access? Get Clinical Tree


