Stress Echocardiography
Frequently, a patient’s cardiovascular symptoms are brought on or worsened by increasing workload or stress because increased demand cannot be met satisfactorily if the underlying abnormality does not allow a normal or physiologic increase in whatever is needed to satisfy the demand. Examples are coronary stenosis, valvular disease, and diastolic dysfunction. Stress echocardiography compares wall motion (regional contractility), myocardial perfusion, pressure gradient, pulmonary pressure, valvular regurgitation, or filling pressures before and after a stress to identify a pathologic condition that is not apparent at rest.
The most common indication for stress echocardiography is evaluation of myocardial ischemia or coronary artery disease, but stress echocardiography is also used to evaluate valvular heart disease, pulmonary hypertension, exertional dyspnea, and left ventricular (LV) filling pressures. This chapter primarily discusses the use of stress echocardiography for coronary disease and its use for other clinical indications (mostly hemodynamic stress test) is discussed here also, and in chapters 8 and 12. Stress echocardiography requires comparing echocardiographic data obtained during or after stress with baseline resting data, and it is essential to review resting and stress images side by side using digital acquisition and display. Digital echocardiography allows the online capture of an entire cardiac cycle(s) or a portion of a representative cardiac cycle using a continuous cine loop. State-of-the-art echocardiography units are equipped with a “stress package” that allows the digital acquisition and side-by-side comparison of baseline and stress images. When capture of an image is initiated, one or more consecutive cardiac cycles can be captured to minimize sampling errors, and the best image can be selected for storage and review. It also is possible to digitize color flow imaging and Doppler velocity recordings. The captured images are stored digitally and can be transferred to a digital server and a review station. The continuous cine loop is displayed in a split-screen or quad-screen format for showing multiple views simultaneously or multiple studies of the same view for purposes of comparison or for selecting a representative image.
Types of Stress Echocardiography
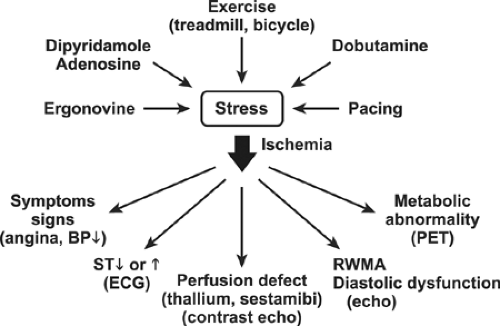
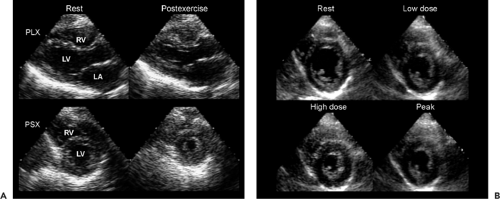
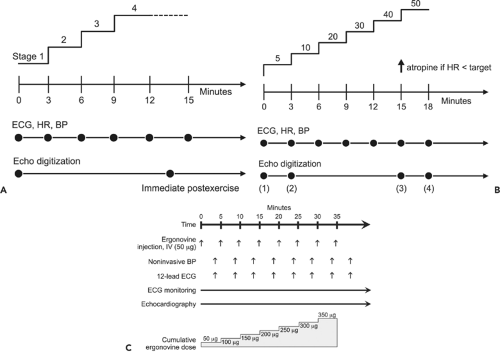
Stress echocardiography is performed with exercise, the administration of a pharmacologic agent, mental stress, or transesophageal atrial pacing (Fig. 11-1). The exercise protocol includes a treadmill exercise test, with immediate postexercise echocardiographic images (1) or upright or supine bicycle echocardiographic images obtained at peak exercise (2). Because exercise-induced regional wall motion abnormalities due to ischemia usually last for a few minutes after the termination of exercise, immediate postexercise images can be compared with the baseline preexercise images to detect exercise-induced regional wall motion abnormalities. Therefore, treadmill exercise with echocardiographic images obtained immediately after the termination of exercise is the form of exercise echocardiography used most frequently to detect myocardial ischemia or coronary artery disease. By allowing several successive cardiac cycles to be captured and stored in memory, digitized echocardiography enhances the capability of acquiring satisfactory comparative postexercise images. The most satisfactory postexercise image is selected and compared with the baseline image on a side-by-side quad-screen display (Fig. 11-2). The typical exercise echocardiography protocol used at Mayo Clinic is shown in Table 11-1 and Figure 11-3 A. Some centers favor the use of the supine bike exercise protocol, which has the advantage of obtaining
echocardiographic images at peak exercise (2). At Mayo Clinic, supine bike exercise is the preferred form of stress test for the evaluation of exercise-induced hemodynamics (for mitral stenosis or diastolic dysfunction).
echocardiographic images at peak exercise (2). At Mayo Clinic, supine bike exercise is the preferred form of stress test for the evaluation of exercise-induced hemodynamics (for mitral stenosis or diastolic dysfunction).
When a patient cannot exercise, ischemia is induced pharmacologically with dobutamine, dipyridamole, or adenosine (3,4,5) (Table 11-2). Pharmacologic stress is also used for preoperative risk stratification. Dobutamine is the agent used most commonly in stress echocardiography and is used almost exclusively at Mayo Clinic. A flowchart for dobutamine stress echocardiography is shown in Figure 11-3 B. Atrial pacing with a transesophageal lead is another method for inducing stress in patients who cannot exercise or when no exercise stress equipment is available (6). Contrast myocardial perfusion echocardiography can be used to identify ischemic myocardium (7,8,9). To induce a perfusion defect, adenosine or dipyridamole is used most frequently. These vasodilating agents create a “coronary steal” so that myocardial segments subtended by a stenotic coronary artery show a decrease or defect in myocardial perfusion. Different ultrasound units have unique methods (pulsed inversion, pulse modulation, or a combination) of performing myocardial perfusion imaging, but they are all based on harmonic imaging (see Chapter 6). Coronary spasm is an important cause of myocardial ischemia or infarction, and it is usually evaluated in the cardiac catheterization laboratory by infusing acetylcholine. Song and associates (10) have reported the clinical efficacy of a bedside ergonovine provocation test by monitoring LV wall motion after bolus injections of ergonovine maleate (50 μg) intravenously at 5-minute intervals up to a total dose of 0.35 mg (Fig. 11-3 C). In a study of 1,372 patients, this test was shown to be safe, with no mortality or myocardial infarction (11). In this well-selected patient population, the study results were positive in 31%. The likelihood of a future cardiac event was higher for patients who had positive findings on ergonovine echocardiography.
Table 11-1 Exercise echocardiography protocol | |
|---|---|
|
What to Look for as a Marker of Coronary Artery Disease or Myocardial Ischemia
Myocardial ischemia has various manifestations, including ST-segment depression on electrocardiography (ECG), perfusion defect on nuclear imaging or contrast echocardiography, metabolic abnormalities on positron emission tomography (PET), and abnormal contractility on radionuclide angiography or echocardiography (Fig. 11-1). Stress echocardiography is based on the concept that new or worsening regional myocardial contractility induced by ischemia is detected reliably with echocardiographic wall motion analysis. Comparison of LV segmental wall motion during or soon after stress with resting wall motion is accomplished by side-by-side review of digitized cine-loop images of all 16 segments of the LV. The interpretation of stress echocardiography is based primarily on the response of LV wall motion to stress (Table 11-3). Normally, LV wall motion becomes hyperdynamic with exercise, dobutamine,
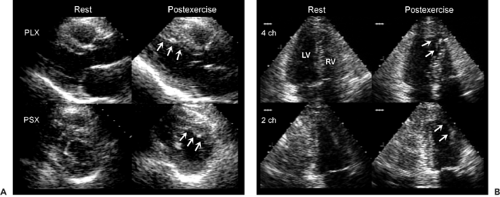
or pacing (Fig. 11-2). Worsening of wall motion abnormalities or the development of new ones is the hallmark of stress-induced myocardial ischemia (Fig. 11-4A and B). The lack of hyperdynamic motion may indicate ischemia, but it is less specific. If the lack of hyperdynamic motion is confined to a specific segment after adequate stress, it more strongly indicates ischemia. However, if the stress level is inadequate or the patient is taking a β-blocker of the entire LV segment may still contract normally without hyperdynamic motion. In 10% of cases an akinetic myocardial segment becomes dyskinetic during stress echocardiography. This change was not found to have a diagnostic or prognostic implication (12).
or pacing (Fig. 11-2). Worsening of wall motion abnormalities or the development of new ones is the hallmark of stress-induced myocardial ischemia (Fig. 11-4A and B). The lack of hyperdynamic motion may indicate ischemia, but it is less specific. If the lack of hyperdynamic motion is confined to a specific segment after adequate stress, it more strongly indicates ischemia. However, if the stress level is inadequate or the patient is taking a β-blocker of the entire LV segment may still contract normally without hyperdynamic motion. In 10% of cases an akinetic myocardial segment becomes dyskinetic during stress echocardiography. This change was not found to have a diagnostic or prognostic implication (12).
Table 11-2 Dobutamine echocardiography protocol | ||
|---|---|---|
|
Table 11-3 Interpretation by regional wall motion (WM) analysis | |||||||||||||||||||||
|---|---|---|---|---|---|---|---|---|---|---|---|---|---|---|---|---|---|---|---|---|---|
| |||||||||||||||||||||
Other adjunctive diagnostic criteria for a positive stress echocardiography examination include LV cavity dilatation, a decrease in global systolic function, diastolic dysfunction, and new or worsening mitral regurgitation. However, these adjunctive diagnostic criteria are more specific for detecting severe coronary artery disease and may not be sensitive for detecting the presence of coronary artery disease. Also, it should be emphasized that the response to dobutamine is different from that due to
exercise (13). Even in patients with severe coronary artery disease, including left main coronary artery disease, the LV cavity may not dilate and global systolic function may improve with dobutamine infusion despite new wall motion abnormalities due to severe coronary artery disease (Table 11-4). Comparison of exercise echocardiography with dobutamine stress echocardiography in patients with left main coronary artery disease showed that cavity dilatation, decrease in systolic global function, and ECG evidence of ischemia (ST-segment depression) were more common (87% of patients) after exercise stress than after dobutamine infusion (17% of patients).
exercise (13). Even in patients with severe coronary artery disease, including left main coronary artery disease, the LV cavity may not dilate and global systolic function may improve with dobutamine infusion despite new wall motion abnormalities due to severe coronary artery disease (Table 11-4). Comparison of exercise echocardiography with dobutamine stress echocardiography in patients with left main coronary artery disease showed that cavity dilatation, decrease in systolic global function, and ECG evidence of ischemia (ST-segment depression) were more common (87% of patients) after exercise stress than after dobutamine infusion (17% of patients).
Comparison of stress wall motion with baseline resting wall motion is enhanced by reviewing digitized side-by-side cine-loop echocardiographic images; however, the digitized images alone may not be sufficient for a complete analysis of regional wall motion, and videotape real-time images may need to be reviewed to improve the diagnostic accuracy of stress echocardiography (14). Although several cardiac cycles can be acquired during stress echocardiography, we have learned that review of a single representative cardiac cycle is most optimal for clinical practice. It has been appreciated that myocardial contractility remains normal or returns to normal promptly even in the setting of myocardial ischemia. Tissue Doppler or strain imaging may be more sensitive for the identification of ischemic segments. Time from the QRS to the onset of regional relaxation has been found to be a good indication for ischemia. Myocardial ischemia delays the onset and the rate of regional myocardial relaxation, and the delay in relaxation can be quantified with tissue Doppler and strain rate imaging. Normally, the time from the QRS to the onset of regional myocardial relaxation is 350 to 400 milliseconds, and this interval decreases on average by 34% ± 10% in normal myocardial segments with a high dose dobutamine but is less (mean, 12% ± 18%) in ischemic segments (15). Currently, it requires additional off-line analysis. More clinical observations and investigations in this area are needed to provide a guideline for optimal use of this imaging technique in stress echocardiography.
Table 11-4 Ischemic manifestations of severe coronary artery disease | |||||||||||||||||||||
|---|---|---|---|---|---|---|---|---|---|---|---|---|---|---|---|---|---|---|---|---|---|
| |||||||||||||||||||||
It would be ideal if both myocardial contractility and perfusion data were available during stress echocardiography by real-time myocardial contrast perfusion study. A myocardial perfusion defect is usually seen as a dark area devoid of microbubbles in the subendocardium or the entire transmural myocardium area (see Chapter 6). In the future, stress echocardiography studies to identify ischemic myocardium should certainly have both components. Wall


Stay updated, free articles. Join our Telegram channel

Full access? Get Clinical Tree


