(1)
The Lindner Center for Research and Education The Christ Hospital, The Christ Hospital Physicians Ohio Heart and Vascular Center, Cincinnati, OH, USA
Keywords
CCTA in the emergency roomCT-STAT studyROMICAT II studyACRIN-PA studyEvaluation of coronary artery bypass graftsEvaluation of coronary stentsAppropriate use criteriaPlaque characterizationHigh risk plaque featuresPlaque burdenLow CT attenuation plaquesNapkin ring signPositive remodelingSpotty calcificationPhysiologic evaluation of ischemiaCT myocardial perfusion imagingCTPICORE320 studyCT fractional flow reserveFFRctDEFER trialFAME trialComputational fluid dynamicsDISCOVER-FLOW studyHeartFlow NXT trialDeFacto studyTransluminal attenuation gradientTAGRest CT myocardial perfusionMyocardial viabilityMyocardial infarctionValve assessmentTranscatheter aortic valve replacementTAVRTAVR planningAortic annulus measurementsAortic measurementsAortic leaflet lengthAnnulus to coronary artery heightEdwards SapienTM CoreValveAssessment of native valvesAssessment of prosthetic valvesMitral regurgitationMitral stenosisAortic regurgitationAortic stenosisProsthetic heart valvesElectrophysiologic applicationsBiventricular pacemakerBiV pacemakerAtrial fibrillationAtrial fibrillation ablation planningCardiac vein analysisCardiac source of embolismCoronary anomaliesIntramural coronary anomalyExtramural coronary anomalyIntramuscular coronary anomalyExtramuscular coronary anomalyInterarterial coronary anomalyExtraarterial coronary anomalyThe following chapter expands on some of the more common applications of cardiac computed tomographic angiography (CCTA). The list is not meant to be all inclusive. However, it is included to provide a framework for some of the specific application of this imaging modality. Additionally, included in this section are some interesting and promising potential future applications of CCTA.
Evaluation of Chest Pain in the Emergency Room
Acute chest pain is one of the most frequent reasons for patient visits to the emergency department (ED) in the United States [1]. Only a small number of these ED visits results in a diagnosis of acute coronary syndrome (ACS) [2]. Recent guidelines have emphasized that the primary goal of the ED evaluation of the chest pain patient is to exclude ACS and other serious conditions rather than to detect coronary artery disease (CAD) [3]. The standard ED approach to the evaluation of the patient with CP involves admission to the hospital or chest pain unit to exclude ACS with serial biomarkers and electrocardiograms with selective use of stress testing with or without imaging for further risk stratification, which while avoiding the unfortunate discharge of a patient suffering from an ACS, is time consuming, expensive and leads to a longer length of stay in hospital [4]. Since CCTA is an accurate imaging modality to detect CAD and since the likelihood of cardiac events is extremely low in patients with no or mild CAD and non-cardiac chest pain [5, 6], CCTA has been studied as a diagnostic and risk stratifying imaging modality for patients presenting to the ED with chest pain. While multiple meta-analyses have examined the performance of CCTA in the ED, four randomized, controlled clinical trials have been published in this arena: Goldstein et al. [7], CT-STAT [8], ROMICAT II [9], and ACRIN-PA [10].
In the original Goldstein study [7], 203 patients were randomized to CCTA versus standard of care (SOC). The eligibility requirements included age ≥25 years and acute chest pain deemed to be “low risk.” Excluded were those with known CAD, ECG evidence of ischemia, elevated biomarkers and cardiomyopathy (EF ≤ 45 %), iodine or beta-blocker contraindications, atrial fibrillation or irregular heart rhythm, body mass index ≥39 kg/m2, creatinine ≥1.5 mg/dl and intravenous contrast administration within 48 h. CCTA patients with “minimal” disease were discharged. Those with stenoses >70 % underwent invasive coronary angiography (ICA) while those with intermediate lesions or nondiagnostic CCTA examinations underwent stress testing. Outcomes were freedom from major adverse events over 6 months and diagnostic efficacy. In addition, time and cost of care were assessed. Both CCTA and SOC were safe with no adverse events in either group. In 75 % of the patients, the source of chest pain was identified by CCTA (67 with normal coronary arteries and 8 with severe CAD). The remaining 25 % required stress testing to complete the evaluation. CCTA reduced the diagnostic time compared with SOC (3.4 h versus 15 h, p < 0.001) and lowered costs ($1,586 versus $1872, P < 0.001). Additionally, CCTA required fewer repeat evaluations for recurrent chest pain (2 % versus 7 % of patients, p = 0.1).
CT-STAT [8] was a multicenter, randomized trial in 16 ED centers. Patients were randomized to CCTA or myocardial perfusion imaging (MPI). The primary outcome was time to diagnosis. Secondary outcomes included emergency department costs of care, and safety defined as freedom from major adverse cardiac events over a 6 month period. CCTA resulted in a 54 % reduction in time to diagnosis compared to MPI (2.9 h versus 6.3 h, p < 0.0001). In addition, costs of care with CCTA were 38 % lower ($1660 versus $3077, p < 0.0001). There was no difference in MACE between the two strategies (0.8 % with CCTA versus 0.4 % with MPI, P = 0.29).
The ACRIN-PA study [9] randomly assigned low to intermediate risk patients presenting with possible ACS to the ED in 5 different centers in the United states to CCTA or traditional care in a 2:1 fashion (CCTA:traditional care). Patients were >30 years old and had a TIMI risk score [11] of 0–2. The study enrolled 1,370 patients. Of the 640 patients with negative CCTA examinations, there were no deaths or myocardial infarctions within 30 days. Patients in the CCTA group had a higher rate of emergency room discharge (49.6 % versus 22.7 %, 95 % confidence interval: 21.4–32.2) and a shorter length of stay (median of 18 h versus 24.8 h, p < 0.001). In addition, the CCTA cohort had a higher rate of detection of CAD. There was one serious adverse event in each group.
Finally, the ROMICAT II trial [10] evaluated higher risk patients. Subjects 40–74 years of age with ACS symptoms but no objective evidence of ischemia (no electrocardiographic changes and normal biomarkers), were randomized to CCTA or standard evaluation during weekdays and daylight hours. The primary endpoint was length of stay in hospital. Secondary endpoints were rates of discharge from the ED, major adverse cardiac events within 28 days and cumulative costs. The mean length of hospital stay in the CCTA group was reduced by 7.6 h (p < 0.001) and more patients were discharged from the ED in the CCTA cohort (47 % versus 12 %, p < 0.001). No ACS events went undetected. There were no differences in major adverse cardiac events. CCTA did result in higher down stream testing and higher radiation exposure (as expected). The cumulative mean cost between the groups was unchanged ($4,289 in the CCTA group versus $4,060 in the standard of care group, p = 0.65).
A systematic review of these four randomized, controlled trials published by Hulten et al. [11] was later performed and summarized that CCTA in the ED is safe. This meta-analysis emphasized that there were no deaths in the CCTA group and only a few myocardial infarctions observed, all of which occurred in the index hospitalization and thus were not causally related to the CCTA strategy. While there was a greater referral for ICA and coronary revascularization (bypass surgery and percutaneous intervention) in the CCTA versus the SOC cohort (8.4 % versus 6.3 %, p = 0.03 for ICA; 4.6 % versus 2.6 %, p = 0.004 for coronary revascularization), recurrent ED visits for chest pain were unchanged between the two strategies (4.2 % for CCTA versus 4.5 % for SOC, p = 0.7), and there was also no difference in recurrent hospitalizations for ACS (1.5 % for CCTA versus 1.3 % for SOC, p = 0.5). All studies showed a significant reduction in hospital length of stay. Three of the four studies reported cost. However, methods of cost accounting differed among the three trials. In summary, the data available at this time indicate that CCTA in low to intermediate risk patients presenting with symptoms consistent with ACS (patients with TIMI risk scores [12] of 0–4) more often leads to the correct diagnosis, is safe and results in earlier discharge from the emergency department and leads to a similar cost of care. It is, however associated with a slight increase in downstream testing. CCTA for the evaluation of chest pain in the emergency department is considered an appropriate indication [13].
Adherence to the Society of Cardiothoracic Computed Tomography guidelines on the use of CCTA for patients presenting to the emergency department is highly recommended. These guidelines are summarized here [14]. A scanner with a minimum of 64 detector rows is required. Prospective triggering is recommended but not required. CT laboratory accreditation is also required. Satisfactory quality assurance measures must be achieved. Adequate technologist and physician training is mandated. Figure 9.1 depicts the guideline recommended site requirements. Laboratory requirements for physician training are shown in Fig. 9.2. Guideline reported appropriate indications and contraindications are listed in Fig. 9.3. The guidelines do recommend establishing protocols for appropriate heart rates and heart rate control strategies, beta-blocker protocols, acceptable glomerular filtration rate (GFR) criteria and patient pre test and post test education. Additionally, intravenous saline is recommended for blood pressure support in patients receiving beta-blockers and nitroglycerin. SCCT guidelines for the performance, interpretation and reporting of CCTA should be followed (Chap. 7).
Figure 9.1
A chart depicting the site requirement guidelines from the Society of Cardiothoracic Computed Tomography regarding the use of cardiac computed tomography in patients presenting to the emergency department with chest pain (Adapted from Raff et al. [14])
Figure 9.2
A chart depicting the requirements for physicians interpreting cardiac CT angiograms performed on patients presenting to the emergency department with chest pain (Adapted from Raff et al. [14])
Figure 9.3
A chart depicting the patient selection criteria recommended by the Society of Cardiothoracic Computed Tomography guidelines regarding cardiac computed tomography for patients presenting to the emergency department with chest pain (Adapted from Raff et al. [14])
Evaluation of Coronary Artery Bypass Patients
The evaluation of coronary artery bypass graft patients is an appropriate indication for the use of CCTA [13]. Data are few and mainly include retrospective studies. However, the data do show that CCTA to evaluate CABG is accurate and easily performed [15–17]. It is best used to assess bypass graft patency and to evaluate the location of the left internal mammary artery (LIMA) and or right internal mammary artery (RIMA) prior to repeat bypass surgery. The overall sensitivity, specificity, positive predictive value and negative predictive value of CCTA in the evaluation of bypass grafts for the detection of significant stenoses is 98 %, 89 %, 90 % and 98 % respectively [18]. Errors may be encountered due to clips, calcifications and motion artifact [18]. Evaluation of the native coronary arteries, however, is difficult in those who have had bypass surgery due to the rapid progression of atherosclerosis and the heavy calcification of the native coronary arteries after bypass surgery. CCTA has been shown to improve prognostic assessment in patients who have had bypass surgery. Both Small et al. [19] and Mushtaq et al. [20] have shown that the number of unprotected coronary segments as assessed by CCTA as well as the coronary artery protection score (CAPS) [21] predict future survival.
When performing a CCTA on a bypass patient, use the right antecubetal vein, when ever possible, for contrast injection because injection of the left antecubetal vein will necessitate that contrast cross over the left subclavian artery on its way to the heart and may obscure the origin of the LIMA artery and sections of the saphenous vein bypass grafts. Since the scanned field of view is larger in bypass patients (to encompass the grafts), contrast volume may need to be increased in CABG patients to assure adequate contrast opacification throughout the scan. In addition, since the distal anastomoses are often the most critical portions of the scan, consideration to performing the scan in the caudal to cranial direction should be given (as opposed to the usual cranial to caudal method) [22].
As with all CCTA examinations, a systematic review of the scan should be performed. Particular attention should be paid to the sternum to look for wire fractures and or sternal malunion, both of which may cause chest pain. While possessing the surgical bypass report in order to obtain a priori knowledge of the bypass graft anatomy is optimal, this is often not possible. However, CCTA clues may help determine important information about the bypass grafts utilized. For example, examination of the chest wall may help to determine if the LIMA or RIMA have been harvested (Fig. 9.4). In addition, arterial grafts are generally narrower and possess more clips due to branching. The location of the bypass grafts and their distal anastomoses are best assessed initially by the volume rendered (VRT), three-dimensional imaging reconstruction. This reconstruction provides a good general over view of bypass graft location and to which vessels the grafts subtend. VRT should be performed first. Additionally, saphenous vein location on the aorta may help identify graft locations. In general, the venous graft closest to the aortic valve is the graft to the RCA system. Moving superiorly, the next venous graft is usually to the obtuse marginal vessels or the circumflex itself. The most superior venous graft is most commonly the one to the LAD or diagonal system. Bypass grafts should be evaluated in curved multiplanar reformat as well as in oblique multiplanar reformat and oblique maximum intensity projections to obtain a clear picture of all anastomoses as well as of the bodies of the grafts. In addition, recognizing common bypass graft patient findings such as stumps, pledgets and graft markers is important (Fig. 9.5). Figure 9.6 is a representative example of the CCTA read on a bypassed patient.
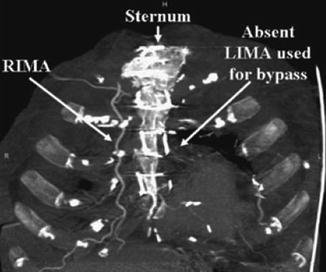
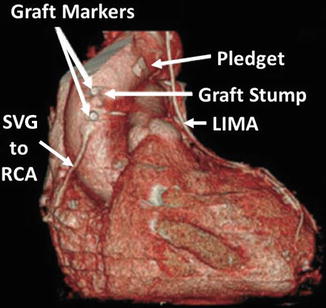
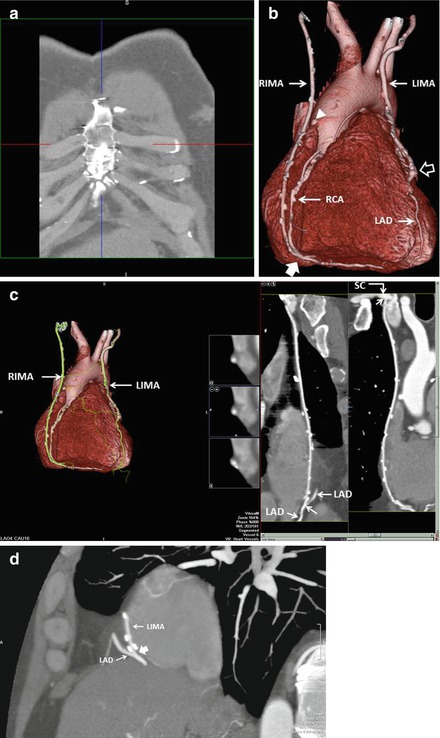
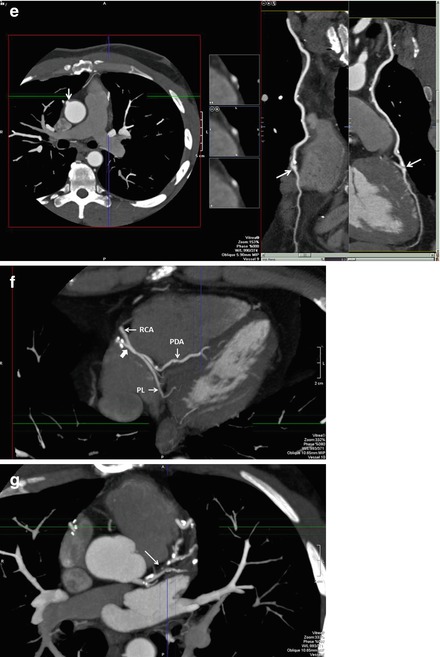
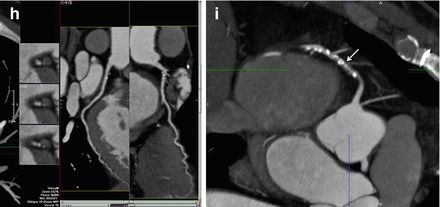
Figure 9.4
An illustration of the chest wall in thick maximum intensity projection reconstruction format demonstrating the right internal mammary artery (RIMA) in its normal anatomic position (unharvested) and the absence of the left internal mammary artery (LIMA) which was harvested for bypass
Figure 9.5
A volume rendered image illustrating the appearances of graft markers, graft stumps and pledgets (used to obtain coagulation after bypass pump removal). Also visualized is the left internal mammary artery (LIMA) and the right internal mammary artery (RIMA). SVG saphenous vein graft, RCA right coronary artery. Note that the stump is likely from the occluded saphenous vein graft to the obtuse marginal system
Figure 9.6
A representative example of the CCTA read on a bypassed patient. Panel (a) is a thick maximum intensity projection (MIP) of the anterior chest wall in the coronal plane. Note the absence of the left internal mammary arteray (LIMA) and right internal mammary artery (RIMA) which normally run just under the rib cage on either side of the sternum. This indicates that they were harvested for bypass grafting. Panel (b) is a volume rendered three-dimensional reconstruction (VRT) used to generally assess the location and anastomoses of the bypass grafts. Note the LIMA and RIMA and their distal anastomoses to the LAD and RCA respectively. Note the occluded vein graft from the aorta denoted by the white arrowhead. This graft was likely to the right coronary artery (RCA) system. The left hand side of panel c depicts the VRT reconstruction of the grafts and note the LIMA and RIMA. The right side of panel (c) illustrates a curved multiplanar reformat (cMPR) of the LIMA. Note that the LIMA is entirely patent. The proximal anastomosis (to the subclavian artery, SC) and the distal anastomosis to the LAD are well visualized (white arrow) as is the LAD proximal and distal to the graft. Note the clips (bright spots along the LIMA). Panel (d) is a left sagittal MIP confirming the patency of the distal LIMA anastomosis to the LAD (white block arrow). In this patient, fortunately, the clips do not obscure the anastomosis. The left side of panel (e) is an axial MIP demonstrating the occluded saphenous vein graft emanating from the aorta (white arrow). The right side of this panel is a cMPR of the RIMA demonstrating is patency in the body of the graft and the distal anastomosis (white arrows) to the RCA. Unfortunately, in this patient the scan field did not include the proximal anastomosis of the RIMA to the right brachiocephalic artery. Panel (f) is an axial plane MIP at the very inferior portion of the cardiac field and further demonstrates the patency of the RIMA distal anastomosis to the RCA (white block arrow). The posterior descending coronary artery (PDA) distal to the RIMA is seen coursing the posterior interventricular groove. The posterolateral branch (PL) is also visualized. Panel (g) is an axial MIP demonstrating the severe, mixed (calcified and noncalcified atherosclerosis of the LAD including a tight proximal LAD mainly composed of mixed plaque (white arrow). Panel (h) is a cMPR demonstrating the patent circumflex artery. Panel (i) is an axial MIP demonstrating the severe, diffuse, proximal RCA atherosclerosis (white arrow)
Evaluation of Coronary Stents
Technical advances in percutaneous coronary intervention have led to an increase utilization of coronary stents. Yet the clinical incidence of in-stent restenosis is between 20 and 35 % for bare metal stents and 5–10 % for drug-eluting stents [23–27]. Given the frequency of patients receiving coronary stents and the relatively common clinical suspicion for in-stent restenosis, and since standard noninvasive imaging modalities such as stress testing demonstrate suboptimal sensitivity and specificity [28], interest in developing a more reliable noninvasive imaging technique to investigate coronary stents has grown. CCTA has been documented to be an accurate and useful tool for imaging the native coronary arteries (see Chap. 7). In addition, despite problems with blooming artifact interfering with stent lumen visualization and with limitations discussed below, CCTA has also been shown to be accurate in imaging coronary stents.
One of the earlier modern investigations of 64-slice CCTA imaging of coronary stents was performed in vitro by Maintz et al. [29], who performed an in vitro examination, using a coronary artery phantom, of 68 different coronary artery stents (57 stainless steel, 4 cobalt-chromium, 1 cobalt-alloy, 2 nitinol and 4 tantalum), each of varying diameters. He employed different filters. This study documented the great variability in CCTA visualization of the stent lumen using 64-slice CCTA (Fig. 9.7). It also provided early evidence that the stent lumen visibility is dependent on the stented material. Lumens from stents made from stainless steel demonstrated the most optimal visibility. Cobalt-chromium stent lumens were also well visualized. Lumens of stents made from Nitinol or Tantalum were poorly visualized. Within the large subset of the various stents made from stainless steel, variability in the lumen visibility was explained by stent strut thickness; the thicker the struts, the poorer the lumen visualization. In addition to stent material and strut thickness, stent diameter and kernal type highly effected intra lumen visibility. Larger stent lumen and the use of sharper filtering kernals (Fig. 9.8) were associated with better stent lumen visibility. These findings were confirmed in a subsequent study, Fig. 9.9 [30].
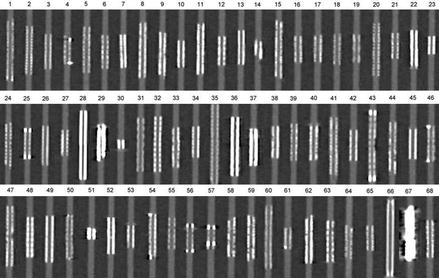
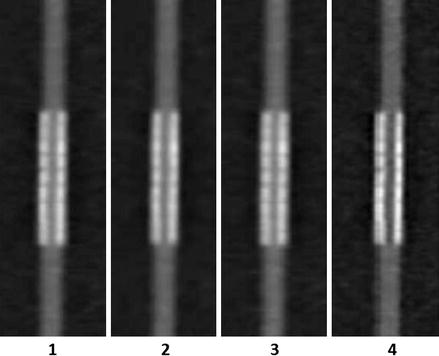
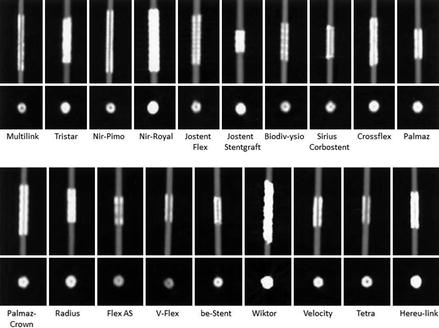
Figure 9.7
In vitro comparison of the 68 stents studied by Maintz et al. [27]. All stents in this figure were of the same size. Intra-stent luminal visualization varied greatly by stent type. The poorest visualization was noted in stent 67 which was the Wiktor stent made by Medtronic. The struts of this stent are Tantalum. The lumen of stents 29 and 51 were also very poorly visualized. These stents were also made of tantalum. The lumen of stent 49 was just behind these other stents in poor lumen visualization. This stent is made from nitinol. The other stents were all made from stainless steel with the exception of numbers 3, 8, 13 and 65 which were made from cobalt-chromium. Cobalt-chromium and stainless steel stents allowed the best visualization of the lumen. The difference in lumen visualization among the stainless steel and cobalt-chromium stents was explained by strut thickness. The thicker the strut, the poorer the lumen visualization (Image reproduced with the kind permission of the European Society of Radiology from Maintz et al. [29])
Figure 9.8
In vitro CCTA imaging comparison by Maintz et al. [27] of four different kernal types when imaging the same exact stent. Images 1–4 progressively employed shaper filtering kernals. Note the best lumen visualization in column 4, which applied the sharpest of the four kernals (Reproduced with kind permission by the European Society of Radiology from Maintz et al. [29])
Figure 9.9
Another in vitro study [28] confirming the findings that stent visibility is dependent on stent material and metal content and strut thickness Note that the Wiktor stent is made from tantalum. While the Nir-Royal stent is made from stainless steel, it is coated in gold. The Josent-Stentgraft is also a stainless steel stent but its struts are much thicker than the other stainless steel stents. The Radius is a nitinol stent (Image reproduced with permission from the European Society of Radiology from Maintz et al. [30])
Mahnken et al. [31] further progressed the in vitro analysis of the use of filtering in stent imaging by imaging eight different coronary artery stents, each with a diameter of 3 mm. Several interesting points arose from this work. First, sharper kernal filtering improved visualization of the stent lumen. Second, areas with radiopaque markers demonstrated more blooming and further obscured lumen visualization in the areas where these markers were located (edges of the stent, Fig. 9.10). Finally, André et al. [32] demonstrated similar findings using a 256-slice machine (Fig. 9.11). André also illustrates a phenomenon called the “halo effect,” (Fig. 9.12), which may also impair stent lumen visualization. This phenomenon describes the artificially increased in-stent lumen signal in the vicinity of the strut-lumen interface that gradually decreases toward the center of the lumen, which creates the appearance of a dark line down the middle of the stent.
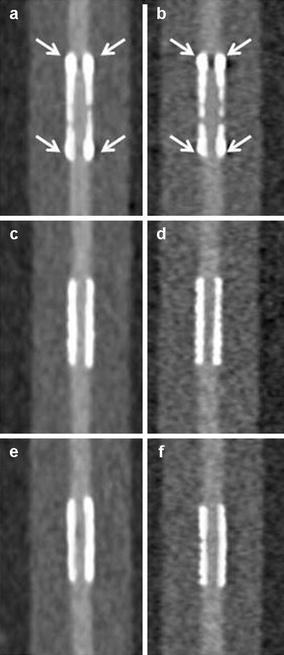
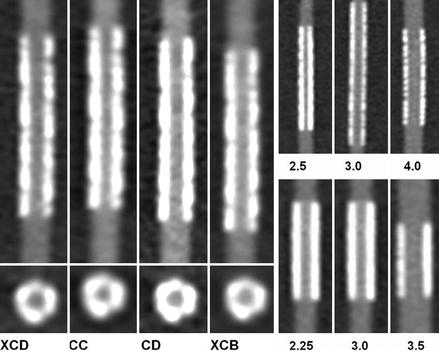
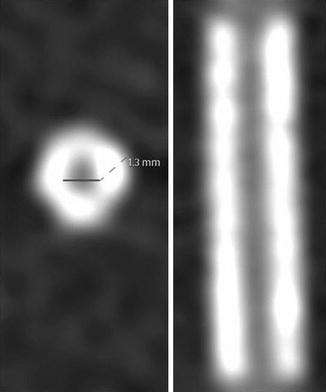
Figure 9.10
Phantom CT angiographic imaging from Mahnken et al. [29]. Panels (a, c, e) are three different stents (all 3 mm in diameter) using a normal filter. Panels in the same row are the same stent. The left hand column (panels a, c, e) utilized a normal filter. The right hand column (panels b, d, f) were imaged with a sharp filter. Note the better lumen visualization when the sharp filters (right hand panels) were used. The stent imaged in panel (a, b) had radiopaque markers at the stent edges. Note that the areas were the markers were located (white arrows) demonstrated poorer lumen visualization (Reproduced with permission from Sage Publications from Mahnken et al. [31]
Figure 9.11
Phantom imaging using a 256-slice CT machine from André et al. [30] demonstrating the importance of filtering and stent size in stent lumen visualization. The left hand panel compares imaging of the same stent with varying filter types. The XCD and the CD are the sharper filters. Note the improved lumen visualization using these sharper kernals. The right hand panels illustrate two different stents of varying size. The top right panel is one stent. The bottom right panel is another stent. The numbers represent the stent size (2.25, 2.5, 3.0, 3.5, and 4.0 mm). Note that the larger stent sizes demonstrate better lumen visibility (Reproduced with permission from BioMed Central (unrestricted use) from André et al. [32])
Figure 9.12
An example of the “halo effect.” Note the artificially increased signal within the lumen of the stent at the strut-lumen interface which gradually decreases toward the center of the stent lumen. This creates the appearance of a dark line down the middle of the intra-stent lumen. The “halo effect” may impair proper visualization of the intra-stent lumen (Reproduced with permission from BioMed Central (unrestricted use) from André et al. [32])
While in vitro studies demonstrate the feasibility of CCTA stent imaging, they do not validate the real world clinical use of CCTA for this indication. Rixe et al. [33] studied 64 coronary stent patients with CCTA using a sharp kernal. Fifty-nine of 102 stents were classified as evaluable. Similar to the in-vitro studies, stent type and size were critical in determining whether the stent was evaluable. The mean diameter of the unevaluable stents versus evaluable stents was 3.03 ± 0.31 (range: 2.5–4) versus 3.28 ± 0.40 (range: 2.75–5 mm, p = 0.0002). Of all stents with a diameter <3.0 mm, only 1 stent was classified as evaluable. Of the 31 unevaluable stents with a diameter of ≥3.0 mm, all but 1 were BxSonic or Cypher stents, whose struts are 0.14 mm. In contrast, only 1 of 9 Taxus stents (strut thickness (0.13 mm) was classified as unevaluable. Overall, the sensitivity and specificity for correctly identifying in-stent stenosis was 50 % and 57 % respectively. However, when only the evaluable stents were considered, the sensitivity and specificity rose to 86 % and 98 % respectively. This study provides in-vivo confirmation that in larger stents with smaller struts, stent stenosis can be accurately determined by CCTA. Similar findings were also demonstrated in the meta-analyses by Sun et al. [34, 35] Sun also points out that in addition to stent size, stent material, strut size, blooming and filter type, several other factors affect the accuracy of CCTA stent imaging, including higher heart rates (motion artifact) and severe calcification of the coronary arteries [34]. Akin to the dictum that larger stents are more reliably evaluated clinically by CCTA, Roura et al. [36] confirmed the accuracy of left main coronary artery (LM) stent imaging by CCTA as compared to intravascular ultrasound. While this study did demonstrate that CCTA tends to underestimate stent lumen diameter in patients with left main coronary artery stents, CCTA evaluation of LM stent lumen diameter and stenoses is accurate (due to the large diameter of these stents, >4 mm). Figure 9.13 is an example of modest in stent restenosis from our laboratory.
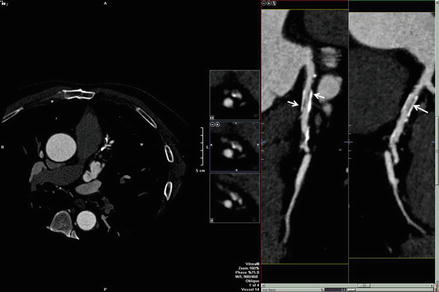
Figure 9.13
A curved multiplanar reformat demonstrating modest in stent restenosis of a proximal LAD stent from our laboratory. The left side of the figure is the axial MPR image. Note the darkness of the image indicating that the frame was windowed down in order to optimize stent imaging. Note the dark areas within the stent lumen denoted by the white arrows. This appearance is typical for in stent stenosis
Multiple studies have been performed, and are continuing to be performed, in an attempt to improve CCTA stent imaging. Several studies have looked at the use of iterative reconstruction on the ability of CCTA to evaluate stents. Weust et al. [37] and Zhou et al. [38] have each shown that iterative reconstruction improves the accuracy of CCTA for imaging stents. In fact, low dose 80 KV imaging with iterative reconstruction, using dual-source CT, has been shown to be reasonably accurate in evaluating stents (Fig. 9.14) [39]. Studies have also shown that newer detector technology may improve stent evaluation, including using novel integrated electronics and also using the gem stone detector [40–42] Investigators have also evaluated the effect of low-osmolar, high iodine concentration contrast versus iso-osmolar, lower iodine concentration contrast on stent imaging with CCTA and found that the latter provides better image quality [43]. Additionally, the evaluation of stents using a combination of myocardial computed tomography perfusion (MCTP) along with traditional CCTA is being investigated. Rief et al. [44], using this approach, demonstrated that the combination of CCTA with MCTP improves the diagnostic accuracy of in-stent stenosis compared to CCTA alone (Fig. 9.15). Additionally, CCTA has been shown to be highly accurate in identifying stent fractures, which are an not infrequent cause of in stent restenosis and thrombosis [45]. Lastly, newer bioapsorbable stent platforms are currently being evaluated. Onuma et al. [46] demonstrated that the ABSORB BVS bioabsorbable stent is easily imaged by CCTA (Fig. 9.16). Other trials that will further evaluate the accuracy of CCTA in diagnosing in stent restenosis of the bioapsorbable stent platforms are currently in the planning stages.
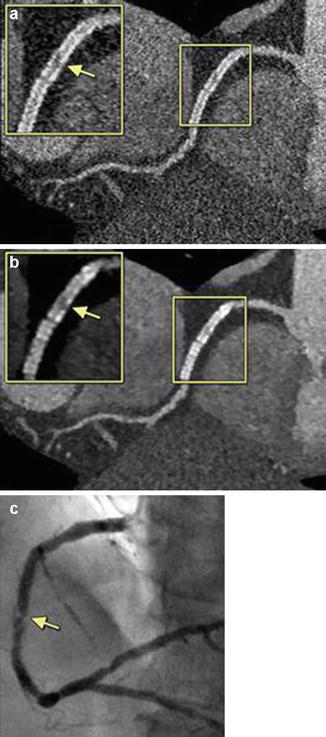
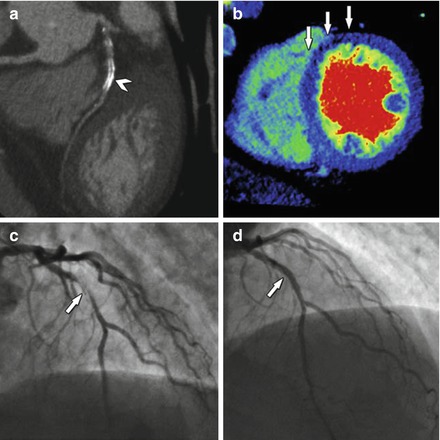
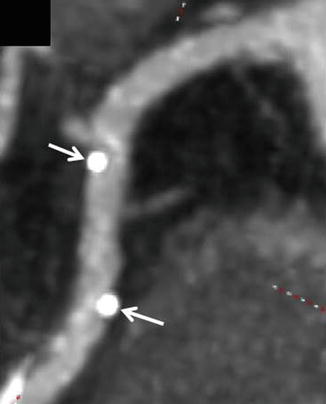
Figure 9.14
An example of the presence of significant in-stent stenosis restenosis. Figure (a) is a filtered back projection curved multiplanar reconstruction. The boxed areas highlight the findings. Panel (b) is an iterative reconstruction data set in a curved multiplanar reformat. Panel (c) is the corresponding invasive angiogram demonstrating the in-stent restenosis. The yellow arrows point to the areas of stenosis (Reproduced with permission by Elsevier Limited from Eisentopf et al. [39])
Figure 9.15
An example of a nondiagnostic CTA evaluating for in-stent restenosis (panel a, arrowhead) owing to metallic artifact. Panel (b) demonstrates decreased perfusion in the anterior and anteroseptal walls (arrows). Panel (c) is an invasive angiogram confirming in-stent restenosis (arrow). Panel (d) demonstrates the coronary segment after placement of a drug eluting stent within the previous stent (white arrow) (Reproduced with permission by Elsevier Limited from Rief et al. [44])
Figure 9.16
An example of the appearance of a bioapsorbable stent. Note the absence of stent struts. The only visible evidence of the presence of a stent are the two metallic markers at either end of the stent (white arrows)
The 2010 SCCT Appropriate Use Criteria document [46] indicate that in symptomatic patients (patients with an ischemic equivalent), prior coronary stent with a stent diameter of <3 mm, are inappropriate for CCTA and with a stent diameter of ≥3 mm, are of uncertain appropriateness. In asymptomatic patients with a prior left main coronary stent or in patients with any stent ≥3 mm, CCTA is appropriate. In the asymptomatic patient, it is inappropriate to evaluate any stent with CCTA, regardless of size, less than 2 years after implantation. The use of CCTA in the asymptomatic patient to assess stents ≥3 mm after 2 years from implantation is of uncertain appropriateness. In asymptomatic patients it is also inappropriate to evaluate stents <3 mm using CCTA. In the setting of past stress imaging in symptomatic patients, CCTA for patients with stents ≥3 mm greater than 2 years after implantation is of uncertain appropriateness. This document also acknowledges that many stents are unevaluable and thus, CCTA imaging for the sole purpose of identifying in-stent stenoses should only be performed in selective patients [46].
Plaque Characterization
The identification of patients at high risk for the development of acute coronary syndromes remains a great challenge. Efforts are on going to predict these events on an individual plaque level using noninvasive imaging techniques. Current clinically relevant noninvasive imaging strategies focus on the detection of plaque in general and on the detection of flow limiting stenoses and not on the characterization of the coronary plaque itself [47]. Autopsy studies have shown that most acute coronary mortalities are due to sudden luminal thrombosis due to plaque rupture [48–50]. Atherosclerotic plaques prone to rupture are morphologically distinct from stable plaques in that they have a large lipid-rich necrotic core, a thin fibrous cap, neovascularization, spotty calcium and large amounts of inflammatory cells [51]. Stable plaques tend to be more calcified and have small lipid pools. Because of these differences, an opportunity exists for distinguishing between unstable and stable plaques noninvasively, particularly with coronary computed tomographic angiography (CCTA).
Histologically, plaques associated with acute coronary syndromes demonstrate a necrotic core covered by a thin fibrous cap [52]. It is likely that vulnerable plaques have a necrotic core similar to a ruptured plaque but instead have an intact fibrous cap [50]. These vulnerable plaques are believed to be the precursor to rupture of the plaque [52]. While the spatial resolution of CCTA does not allow visualization of the thin fibrous cap, CCTA is capable of visualizing the necrotic core [53]. The necrotic core has a mean length of 8 mm and in 80 % of the cases an area >1.0 mm2 [53]. Features associated with high risk for acute coronary syndromes that may be detected by CCTA include a large plaque burden, low attenuation plaques, the napkin-ring sign, positive remodeling and spotty calcifications.
Large Plaque Burden
High coronary plaque burden is associated with acute coronary syndromes. For example, in the Prospect Trial [54], a natural history study of coronary plaques using invasive angiography and intravascular ultrasound (IVUS), the strongest predictor for future cardiac events was IVUS derived plaque burden. Additionally, culprit plaques in patients with acute coronary syndromes have been shown to have more plaque volume than stable lesions in patients with angina (193 mm3 versus 104 mm3, P < 0.001 in one study [53] and 313 ± 356 mm3 versus 118 ± 93 mm3 in another [55]). Finally, patients who develop acute coronary syndromes have been shown to have a higher total plaque volume than those that do not (970 mm3 versus 811 mm3, p < 0.01) [56]. Automated CCTA software tools are available to quantify plaque burden. However, great variability and poor reproducibility has been observed when plaque quantification is performed in the same patient using different software platforms [57]. While these data are promising, further advancements and industry standardization in automatic imaging software for plaque quantification must be developed.
Low CT Attenuation Plaques
Since lesions leading to acute coronary syndromes contain a large lipid rich necrotic core, differentiation between lipid and fibrous plaques may be clinically important for the prediction of those at higher risk for an acute coronary event. CCTA is excellent in differentiating among calcified, noncalcified and mixed calcific and noncalcific lesions. However, accurate and reliable differentiation between lipid rich and fibrous rich plaques continues to be a challenge because the differences in mean plaque densities between fibrous and lipid rich lesions vary widely and have substantial overlap [58, 59]. Noncalcific, lipid rich plaques possess more pixels with lower Hounsfield unit numbers (<30) than those plaques composed predominately of fibrous tissue [60, 61]. Additionally, CCTA plaque attenuation varies based on adjacent intraluminal iodinated contrast, plaque size, image noise, tube voltage, slice thickness and reconstruction filter [62–65]. Therefore, the reliable differentiation between lipid rich and fibrous plaques is not yet feasible by CCTA.
Napkin-Ring Sign
A circular CCTA attenuation pattern termed the napkin-ring sign has been associated with unstable coronary plaques and has been found to be present more frequently in thin cap fibroatheromas versus non-thin cap fibroatheromas [54, 66–73]. This finding represents the CCTA correlate of the large necrotic core and thin fibrous cap found in unstable plaques and is defined on CCTA as a noncalcified plaque cross-section demonstrating a central area of low CT attenuation that is in contact with the lumen and a higher attenuation ring surrounding the low attenuation area (Figs. 9.17 and 9.18) [71–73]. In addition, vaso vasorum may contribute to this CCTA appearance [68].
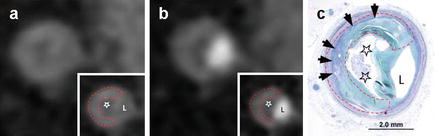
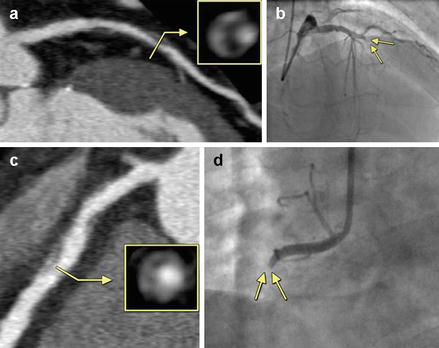
Figure 9.17
A coronary computed tomography angiography image demonstrating the napkin-ring sign present both on the contrasted (panel a) and noncontrasted image (panel b). Panel (c) denotes the histologic analysis. Note the low attenuation area adjacent to the lumen in all three panels (stars) which corresponds to the necrotic core. Also note the surrounding, ring-like higher attenuation region. The dashed line in panel (c) outlines the fibrous rich outer rim. The arrow heads in panel (c) depict the rich vaso vasorum present in the outer rim. L Lumen (Reproduced with permission from Elsevier Limited from Maurovich-Horvat et al. [71])
Figure 9.18
An illustration of the napkin-ring sign with angiographic correlation. Panel (a) demonstrates an atherosclerotic plaque with the napkin ring sign in a longitudinal and cross sectional axes. The yellow box represents an enlarged cross section taken through the region crossed by the yellow arrow. Panel (b) (arrows) demonstrates the acute occlusion of the artery in the region of the napkin-ring sign occurring 10 months after the incident CT image in panel (a). Panel (c, d) are another example of the same. The yellow box is an enlarged cross section of the artery taken at the region crossed by the yellow arrow. The acute occlusion depicted in panel (d) occurred 1 year after the incident CT in panel (c) (Reproduced with permission of Elsevier Limited from Otsuka et al. [73])
Positive Remodeling
The Glagov phenomenon is a well known phenomenon in the natural history of coronary atherosclerosis [74, 75]. This phenomenon, which is now known by the term “positive remodeling”, describes the compensatory enlargement of atherosclerotic coronary arterial segments in response to enlarging plaque burden in order to preserve the lumen size. When the artery reaches its maximum size, the increasing atherosclerotic plaque begins to encroach upon the lumen (Fig. 9.19). Thus, positive remodeling is representative of larger plaque volumes which are known to correlate with acute coronary syndromes [53–56]. Due to the effects of positive remodeling, high risk plaques may not demonstrate significant luminal narrowing because compensatory enlargement of the coronary artery as plaque burden increases leads to preservation of the lumen size until a threshold plaque burden is reached [76]. Histologically, positive remodeling is associated with large amounts of macrophages and large necrotic cores [77]. CCTA is capable of measuring the outer luminal wall and inner lumen dimensions. The remodeling index may be calculated by dividing the vessel cross-sectional area at the site of maximal stenosis by the average cross sectional area of the proximal and distal reference segments [78, 79]. A remodeling index of >1.1 has been proposed for CCTA to define positive remodeling [80]. Others have proposed a plaque diameter greater than the proximal reference segment of >5 % [81]. Automated software is available to calculate the CCTA remodeling index [82]. Figure 9.20 depicts an CCTA example of positive remodeling.
Figure 9.19
A cartoon demonstrating the Glagov phenomenon
Figure 9.20
A depiction of a multiple plaques with various vulnerable plaque features. The thick dotted line outlines the plaques of interest. Panel (a) depicts a low attenuation plaque with a Hounsfield unit measurement of <30 (circle). Panel (b) illustrates spotty calcifications (arrow). Panel (c) demonstrates positive remodeling where the outer diameter of segment 1 exceeds the reference segment 2 by >5 % (Reproduced with permission of Elsevier Limited from Shmilovich et al. [81])
Spotty Calcification
Most individuals suffering from sudden cardiac death possess ruptured plaques with some calcification but most are microcalcifications, which are not detectable by CCTA [83]. IVUS studies have shown that plaques with heavy calcification are generally clinically stable whereas small calcifications known as “spotty” are associated with accelerated progression of disease [84]. Additionally, spotty calcifications have been shown to be associated with acute coronary syndromes [85]. A spotty calcification is a small (<3 mm), dense calcified plaque (>130 Hounsfield unit) surrounded by noncalcified plaque (Fig. 9.20, panel b) [61, 86, 87]. Multiple studies have shown that in patients with acute coronary syndromes, spotty calcifications are associated with the culprit lesion [54, 61, 88–90].
Physiologic Evaluation of Ischemia Using Cardiac CT Angiography
Traditionally, CCTA has been limited in its ability to determine the physiologic significance of a coronary stenosis. Often, patients found to have intermediate or indeterminate stenoses on CCTA examination go on to have subsequent testing, which may include stress or pharmacologic SPECT, PET, MRI or invasive angiography. Combining anatomic and physiologic assessments during the CCTA examination may improve its diagnostic accuracy and usefulness and may eliminate the cost, inconvenience and potential adverse events from subsequent downstream physiologic testing after an indeterminate CCTA imaging study. At the moment, three methods for physiologic assessment of coronary stenoses by CCTA have been described. The first is CT Myocardial Perfusion imaging (CTPI). The second is CT Fractional Flow Reserve (CTFFR) and the last is CT transarterial gradient evaluation or CT TAG imaging.
CT Myocardial Perfusion Imaging
Similar to most stress perfusion imaging studies, CTPI consists of two scans; the resting contrast enhanced scan and the stress contrast enhanced scan. Pharmacologic CTPI has been performed using adenosine, dipyridamole and regadenoson [91–93]. CT first-pass circulation demonstrates a direct correlation between contrast within the myocardium and CT attenuation in Hounsfield units. Thus, decreased blood flow demonstrates a lower attenuation than normal blood flow and is represented by a visual perfusion defect. Ischemia, infarct and peri-infarct ischemia may be deciphered. See Figs. 9.21, 9.22, 9.23 and 9.24. Dynamic perfusion imaging which analyzes perfusion kinetics using time-attenuation curves has been studied and quantitative and semi-quantitative data may be displayed (Fig. 9.22) [94, 95].
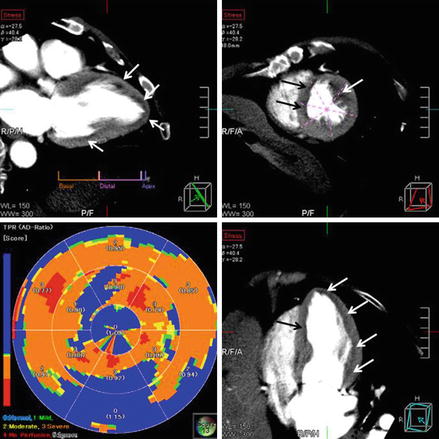
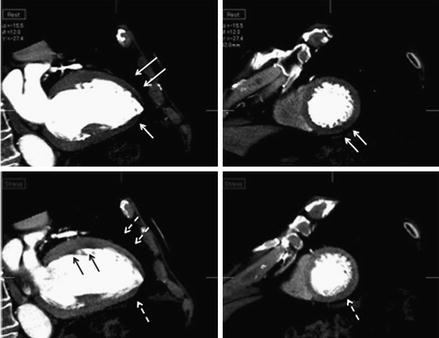
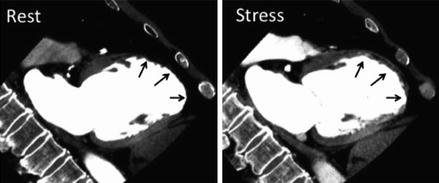
Figure 9.21
A depiction of anterior subendocardial ischemia noted on a CT perfusion study. Panel (a) demonstrates a non-calcified plaque resulting in a stenosis of intermediate severity (white arrow). Panel (b) is the resting CT perfusion image showing uniform contrast enhancement of the myocardium. Panel (c) demonstrates a subendocarial anterior perfusion abnormality after pharmacologic stress (black arrows) (Reproduced with permission by Elsevier Limited from Mehra et al. [199])
Figure 9.22
An illustration of anterior, apical, septal and inferolateral subendocarial ischemia demonstrated after pharmacological stress depicted in the standard horizontal long axis (upper left), short axis (upper right) and horizontal axis (lower right). The ischemia is depicted by the arrows (both white and black) in all three panels. The lower left panel is a bulls eye plot demonstrating the semi-quantitative transmural perfusion ratio (Reproduced with permission by Elsevier Limited from Mehra et al. [199])
Figure 9.23
A depiction of infarction with peri-infarct ischemia after pharmacologic stress. The upper panels are the resting images in the vertical long axis (left) and short axis (right). Note the absence of contrast in the anterior and apical segments (white arrows on the left) and inferior segment (white arrows on the right). The bottom two panels depict the post pharmacologic stress images. Note the more prominently visualized inferior ischemia (white dashed arrow on the right) and in the anterior and inferoapical region (white dashed arrows on the left). Also note the perinfarct ischemia that is now visualized in the proximal anterior region (black arrows on the left) (Reproduced with permission by Elsevier Limited from Mehra et al. [199])
Figure 9.24
A depiction of infarct. There is no perfusion in the distal anterior wall and apex at rest on the left and after pharmacologic stress on the right (black arrows in both panels) (Reproduced with permission by Elsevier Limited from Mehra et al. [199])
Two main scanning protocols have been studied, each with advantages and disadvantages. One such protocol employs the stress scan followed by the rest scan 10–20 min after. This approach is thought to enhance ischemia detection by minimizing contrast contamination from the rest scan. It also allows for nitrate administration before the resting scan as well as before the stress scan [94, 96]. This approach, however, does raise concern for a decreased sensitivity for ischemia or infarct detection due to the possibility of persistent contrast accumulation from the stress scan to the rest scan. Alternatively, a rest scan followed by a stress scan would potentially minimize contrast and radiation exposure since a stress scan would only be needed if intermediate or indeterminate coronary stenoses are detected. This approach requires a 10–20 min wash out period of nitroglycerin and contrast between the two scans [97–99]. Another disadvantage of performing the resting scan first is that the use of beta blockers to reduce the heart rate may underestimate the extent of ischemia on the stress scan. Ideally, the protocol type employed should be individually selected based on the patient’s pre-test risk profile. Low-risk patients might best be served by a rest scan first approach since a normal rest scan would eliminate the need for stress. High-risk patients may benefit from having the stress scan first to enhance the detection of ischemia.
Many important studies have validated the use of CTPI. What follows is a summary of some of the important publications. Kurate et al. [100], published the first feasibility study using adenosine in a stress-rest protocol. Twenty-two patients were studied. There were 26 areas of hypoperfusion identified by CTPI and 22 by SPECT (Single Photon Emission Computed Tomography). The agreement between CTPI and SPECT was 83 %. However, only 48 % of coronary segments were evaluable in the stress images. Confirmation of feasibility was published by Blankenstein et al. [91] and George et al. [92], Blankenstein studied a protocol using a dual-source CT machine with adenosine stress imaging with retrospective gating followed by a resting CT using prospective triggering followed by a delayed-enhancement image acquired 7 min after the rest scan. CTPI was compared with SPECT and all patients underwent invasive angiography (ICA). Thirty-three patients were studied and the sensitivity and specificity were 92 and 67 % for both CTPI and SPECT. The quality of the images was reduced during the stress images. Limitations were attributed to limitations in temporal and spatial resolution, misregistration and slab artifacts and the need to optimize signal-to-noise and contrast-to-noise ratios. The radiation exposure for the entire CTPI protocol was 12.7 mili-Sieverts (mSv). The radiation exposure for the SPECT protocol was also 12.7 mSv.
Ko et al. [101] was one of the first investigators to compare CTPI to invasive FFR. Using a 320-detector row scanner, forty-two patients with chest pain and known coronary artery disease with at least one ≥50 % stenosis by ICA underwent CTPI and were compared with FFR (≤0.8) by ICA. When compared to FFR, CTI had a sensitivity, specificity, positive predictive value and negative predictive value of 76 %, 84 %, 82 % and 79 % respectively. The diagnostic accuracy between the CTPI and FFR studies was 80 %. The combination of a ≥50 % stenosis and a CTPI perfusion defect demonstrated a 68 % sensitivity and 98 % specificity to predict an FFR of ≤0.8 whereas a <50 % stenosis and a normal CTPI was 100 % specific for excluding ischemia by FFR. It is important to recognize that the single gantry rotation coverage of the entire heart by the 320-detector scanner eliminated slab artifacts. Bettencourt et al. [96] also evaluated CTPI with invasive FFR and also compared CTPI with stress cardiac MR (CMR). When compared to the reference standard of FFR ≤ 0.8, he demonstrated a sensitivity, specificity, positive predictive value and negative predictive value of 89 %, 83 %, 80 % and 90 % respectively. Stress CMR results were similar (89 %, 88 %, 85 % and 91 % respectively). CTPI was limited by the fact that 33 % of patients had at least 1 unevaluable segment most often due to extensive calcification. Since he adhered to a protocol using 100 kV tube voltage and tube current modulation, the average effective radiation dose was 5.0 mSv. Additionally, this study enrolled patients before coronary angiography thus avoiding any selection bias.
An important recent trial was the CORE320 study [102]. CORE320 was a large multicenter trial comparing CTPI to SPECT in 381 patients, with a ≥50 % stenosis on ICA, across 16 centers in 8 countries. Adenosine was the CTPI stress agent and a 320-row detector scanner was used. Nearly all the patients were intermediate to high risk for CAD. The sensitivity, specificity, positive predictive value and negative predictive value for CCTA detected ≥50 % stenosis and a positive perfusion defect were 80 %, 74 %, 65 % and 86 % respectively. CORE320 was the first multicenter trial supporting the findings from the single center trials. Five year outcomes data from the CORE320 trial are expected.
Though the data on CTPI are promising, there are several limitations. First, two separate scans increase radiation exposure and there is an associated increased contrast load. Artifacts such as beam hardening from metal or calcium, slab artifacts, motion artifacts and the need for edge-enhanced reconstruction makes it more difficult to accurately interpret subendocardial defects. Finally, there is still some debate over the optimal timing for myocardial contrast opacification.
Fractional Flow Reserve Evaluation by Cardiac CT Angiography
Fractional flow reserve in the invasive angiography laboratory is defined as the ratio of maximal, hyperemic myocardial blood flow through a diseased artery to the expected blood flow in the hypothetical normal artery. While the technique has been in existence for decades, The DEFER [103] and FAME [104] trials pushed this technique to the forefront as a gold standard for determining the physiologic significance of a coronary stenosis. In fact, the follow up data from the FAME trial indicate that reserving revascularization for an FFR < 0.8 is associated with significantly lower rates of adverse events and placement of fewer coronary stents compared to an angiographically guided approach alone [104–106].
FFR calculated from CCTA (FFRct) measures FFR from standard CCTA data without modification of the usual CCTA protocols and without added medication administration and is regarded as a significant advancement in the noninvasive evaluation of coronary atherosclerosis since it assesses both anatomic and physiologic components of a coronary stenosis. FFRct involves accurately modeling the patient specific epicardial coronary arteries by constructing a mathematical model of coronary physiology to create boundary conditions representing cardiac output, aortic pressure and microcirculatory resistance. These boundary conditions are then applied to the physics theory and mathematical laws and equations of fluid dynamics to calculate the physiology of the coronary arteries. Thus, FFRct combines the physics equations of computational fluid dynamics (CFD) with patient specific anatomy (obtained form the DICOM CCTA data), physiology (modeled from myocardial mass obtained from the DICOM CCTA data, brachial blood pressure, and microcirculatory resistance derived from form-function relationships from patient specific vessel anatomy, fluid properties derived from the viscosity of blood, and the density of blood, which is relatively constant) to calculate coronary pressure, flow and FFR.
Simply put, the physics of CFD involves the application of Bernoulli’s equation (formulated in 1738), which describes the energy balance for frictionless fluids and the idea that an increase in the velocity of a fluid (such as when moving through a stenosis) results in a simultaneous decrease in pressure. In the case of a frictionless fluid, if the vessel downstream from a stenosis enlarges to the size of the upstream vessel diameter, the drop in pressure recovers as the fluid decelerates. In the case of a viscous fluid, such as blood, the pressure recovery is incomplete and thus, there is a loss of pressure distal to a stenosis. In 1827, Navier and Stokes generalized Bernoulli’s theories (as well as the theories of Euler and Newton) by describing the behavior of viscous and inviscous fluids and established the foundation for the mathematical modeling of fluid dynamics. For incompressible fluids such as blood, the mass conservation equation supplanted the Navier and Stokes equations and supplied the basis for the quantification of blood flow, blood pressure and FFR. However, the practical application of these theories was not possible until the development of advanced, high-powered digital computers (developed because of the exponential rates of improvement in the size, cost, density and speed of digital components originally predicted by Gordon Moore and is known as Moore’s Law [107]), which by using the physical laws of the conservation of mass and the balance of momentum, made possible the routine calculation and modeling of fluid pressure and velocity.
In modern times, CFD theory is commonly used in the automotive and aerospace industries to reduce development and testing costs and to improve the quality and safety of their products. It applies to lift and drag over cars and airplane wings with air as the “fluid.” More recently, Charles Taylor and colleagues have applied these concepts to the medical sciences by utilizing them in patient specific models of human blood flow [108–110]. Basically, these calculations applied to coronary arteries require simultaneously solving millions and millions of nonlinear equations over and over again (thousands of times) within a cardiac cycle [110]. It has been shown that the function of the circulatory system follows its structure, which is known as the form-function relationship [111]. Thus, FFRct is based on the following scientific principles. First, resting, normal blood flow is proportional to myocardial mass which is measured from the CCTA data set. Second, resistance in the coronary microcirculation is inversely and nonlinearly proportional to the size of the preceding vessel. It follows then that the size of the coronary arteries provide information about their relative flow in that larger coronary arteries and branches have lower resistance to flow than smaller ones. Third, the coronary microcirculatory bed displays a predictable response to adenosine which allows accurate modeling of the microcirculation. At the recommended intravenous dose of adenosine in the catheterization laboratory (140 μg/kg/min), maximal hyperemia occurs, which drops the total coronary resistance to one-fourth of its resting state [112].
FFRct is performed by downloading a routinely acquired CCTA DICOM data set (may be performed with retrospective or prospective triggering), with no additional contrast or medications, to an internet storage site. Accompanying data must include the patient’s brachial blood pressure and heart rate at the time of CCTA acquisition as well as the patients weight and height. The initial images are first screened by an analyst at Heartfow, inc., Redwood City, CA) for quality since image resolution and quality need be sufficient to define the vascular lumen. The myocardial mass is determined by the analyst and the specific vascular tree model is created. These data are inputted into a proprietary high powered computer-processing algorithm that calculates blood flow and pressure at millions of data points in the coronary artery tree. FFRct at each specific point is then defined by the mean coronary pressure divided by the mean blood pressure in the aorta under modeled conditions of maximum hyperemia at that point. The FFR is color-coded, reviewed by the analyst for quality assurance and returned to the requesting physician. See Fig. 9.25.
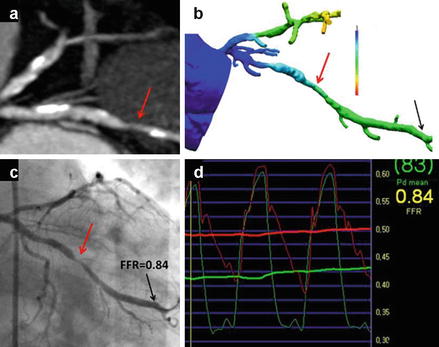
Figure 9.25
An example of a cardiac computed tomographic angiography (CCTA) derived fractional flow reserve (FFRct) compared to invasive angiographically derived fractional flow reserve (FFR) in a patient with a borderline significant lesion in the obtuse marginal vessel (red arrows). Panel (a) is the CCTA image in an oblique plane and panel (c) is the corresponding invasive angiogram displayed in a similar plane. Panel (b) is the color-coded FFRct data displayed in a similar plane and panel (d) is the invasive angiographically derived FFR data. The red line in panel (d) represents the baseline blood flow and the green line represents flow during maxiumal hyperemia. The green arterial wave form is the left ventricular pressure wave and the red wave form is the aortic pressure tracing (Reproduced with permission by Elsevier Limited from Koo et al. [113])
There are three main studies validating the use of FFRct; the DISCOVER-FLOW study [113], the DeFacto study [114] and the HeartFlow NXT trial [115]. The DISCOVER-FLOW study was the first multicenter trial comparing FFRct to invasive coronary angiography (ICA) and invasive FFR. It was performed at four sites and in 103 patients evaluating 159 coronary vessels. Ischemia was defined by an invasive FFR and FFRct value of ≤0.8. FFR and FFRct correlated well. There were 47 vessels identified with intermediate stenoses (50–60 %) and in these vessels, the FFRct sensitivity, specificity, positive predictive value, negative predictive value and diagnostic accuracy when compared to invasive FFR was 66.7 %, 88.6 %, 66.7 %, 88.6 % and 83 % respectively. In the 4 false negative vessels, where the FFRct was >0.8, the invasive FFR was between 0.75 and 0.80. When FFRct was compared to invasive FFR on a per vessel basis, the sensitivity, specificity, positive predictive value, negative predictive value and diagnostic accuracy were 87.9 %, 82.2 %, 73.9 %, 92.2 % and 84.3 % respectively. When CCTA alone was compared to invasive FFR, CCTA showed a 58.5 % accuracy and a 46.5 % positive predictive value on a per vessel basis and a 61.2 % accuracy, a 24.5 % specificity and a 58 % positive predictive value. This trial demonstrated the feasibility of FFRct in the clinical arena.
In a sub study of DISCOVER-FLOW, Min et al. [116] evaluated only the patients with intermediate stenoses (40–69 %). Of the 103 total patients in DISCOVER-FLOW, 60 patients (60 vessels) were found to have intermediate stenoses on CCTA. In these patients the FFRct sensitivity, specificity, positive predictive value, negative predictive value and accuracy were 90 %, 83 %, 82 %, 91 % and 86 % respectively with a good per lesion correlation. Both FFRct and invasive FFR did not correlate well with the percent stenosis, highlighting the limitation of percent stenosis in detecting functionally significant lesions in patients with intermediate stenoses. Another substudy of DISCOVER-FLOW analyzed the affect of artifacts on the diagnostic performance of FFRct [117]. The diagnostic accuracy of FFRct versus CCTA alone was higher in the presence of all artifact types. For example, in the presence of calcium, the accuracy of FFRct was 85.7 % versus 66.7 % with CCTA alone. The FFRct accuracy when motion artifact or misregistration artifact were present was 90.5 % versus 57.1 % with CCTA alone. With poor contrast opacification, the diagnostic accuracy of FFRct versus CCTA alone was 100 % versus 71 % respectively.
The DeFACTO study was an international, multicenter trial at 17 centers and in five countries comparing the diagnostic accuracy of FFRct to invasive FFR for the diagnosis of hemodynamically significant stenoses. 252 of the 285 patients had evaluable CCTA and FFRct examinations. The other 33 patients were excluded for unevaluable CCTA examinations (31 patients) and inability to localize the invasive FFR wire to the arterial segment corresponding to the appropriate CCTA arterial location (2 patients). CCTA alone demonstrated a 64 % accuracy, a 84 % sensitivity, a 42 % specificity, a 61 % positive predictive value and a 72 % negative predictive value. On a per patient basis, FFRct yielded a 73 % accuracy, a 90 % sensitivity, a 54 % specificity, a 67 % positive predictive value and an 84 % negative predictive value. In a separate analysis of those patients with intermediate stenoses (30–70 % by CCTA), the FFRct accuracy was 71 % with a sensitivity of 82 %, a specificity of 66 %, a positive predictive value of 34 % and a negative predictive value of 68 %. While, FFRct did improve the diagnostic accuracy of CCTA alone, it did not meet is diagnostic accuracy pre specified endpoint of 70 % with a p < 0.05.
The HeartFlow NXT trial, published in 2014, is the most recent FFRct trial. Two hundred fifty-one patients were evaluated in ten sites in Europe, Asia and Australia. This study utilized an improved technology that took advantage of improvements in the ability to detect the edges of the lumen and an improved physiologic microcirculation model. Overall, the HeartFlow NXT study demonstrated an accuracy of 81 % and a specificity of 79 % in predicting invasive FFR of <0.8. 12 % of scans were excluded due to artifacts. In patients with an intermediate stenosis (30–70 %), 68 % of scans were correctly reclassified as false positives or true negatives.
Although these data are promising, there remain several limitations of FFRCT. First, there are many mathematical assumptions such as coronary flow, resistance, luminal size and the expected response to hyperemia, which will vary among patients. Second, the technology is proprietary and involves the need for off-site analysis using a super computer. Additionally, high quality images free of motion artifact and excessive calcium are necessary. While the accuracy of FFRCT derived from suboptimal data sets is promising, small numbers of suboptimal data sets were included in the published FFRCT clinical trials.
< div class='tao-gold-member'>
Only gold members can continue reading. Log In or Register to continue
Stay updated, free articles. Join our Telegram channel

Full access? Get Clinical Tree


