(1)
The Lindner Center for Research and Education The Christ Hospital, The Christ Hospital Physicians Ohio Heart and Vascular Center, Cincinnati, OH, USA
Keywords
Attenuation artifactSignal to noise ratioBeam hardening artifactMotion artifactMisalignment artifactMisregistration artifactStair step artifactWindmill artifactInterpolation artifactRing artifactCone beam artifactCardiac CT angiography (CCTA) requires significant data reconstruction and manipulation to produce a final image. For these reasons, artifacts may be introduced into the final CCTA image. Recognition of these artifacts is imperative to avoid erroneous reads. In fact, abnormal findings should be considered artifact until proven otherwise. The following is a discussion of many artifacts that may be encountered in CCTA.
Attenuation Artifact
Attenuation artifact occurs when there is a poor signal to noise ratio resulting from excessive attenuation. It is often seen when imaging overweight individuals in whom the x rays have difficulty passing through the body to the detector. The image will appear grainy and contrast opacification will be reduced, making it difficult to accurately diagnose coronary artery lesions. Attenuation artifact may be avoided by not scanning significantly overweight patients, by increasing the tube current and voltage, by increasing the iodine concentration of the contrast, by increasing the contrast volume, and by increasing the contrast injection rate. Figure 5.1 is an example of attenuation artifact.
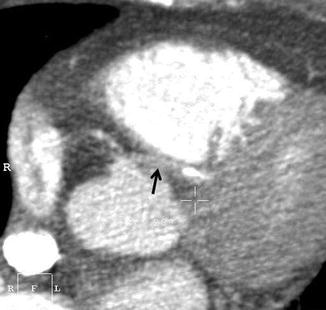
Figure 5.1
An example of attenuation artifact. Low contrast to noise ratio produces a grainy image. Note the anomalous left main coronary artery (black arrow). This artery is grainy and demonstrates poor contrast opacification
Beam Hardening Artifact
X ray beams are composed of individual photons with a range of energies. The greater the energy, the “harder” the beam. As the x ray beam passes through the body, it becomes “harder” because the mean energy of the beam increases as lower energy photons are attenuated. This effect results in two types of artifacts. The first is the “cupping” artifact or the dark “cup” shaped artifact adjacent to a high density object like calcium or metal. In addition, dark streaks are seen between dense objects in the image. Beam hardening artifact may occur from dense objects in the right atrium or right ventricle such as pacemaker or defibrillator leads, from bypass clips, sternal wires, stents (may be confused for in stent stenosis), artificial heart valves and dense calcium. It may also be caused by the spine which may result in less contrast in the posterior myocardium than in the lateral myocardium.
Manufacturers attempt to minimize beam hardening in the following ways. First, special filtration is used. A flat piece of attenuating (metallic) material is used to “pre-harden” the beam by filtering the low energy photons before they pass through the patient. An additional “bow tie” filter is used to further harden the edges of the beam that pass through the thinner parts of the patient. Second, calibration correction is used. Manufacturers will calibrate their scanners using phantoms that range in size. This allows the detectors to be calibrated with compensation tailored for the beam hardening effects of different parts of the patient. This helps to eliminate cupping artifacts. Third, beam hardening software is applied, which utilizes an iterative correction algorithm to bony regions. You, the CT angiographer, may also apply saline flushes after contrast administration to avoid high density contrast in the right atrium, which may be confused with right atrial masses. Figures 5.2 and 5.3 represent examples of beam hardening artifact.
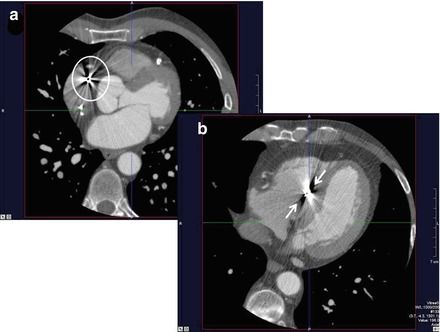
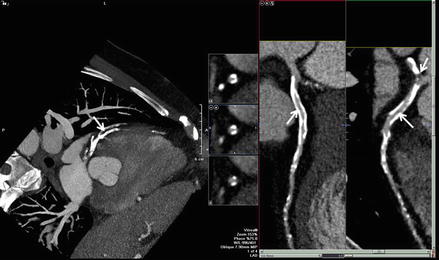


Figure 5.2
An example of beam hardening artifact resulting from pacer wires (dark areas enclosed in the circle in panel (a) and denoted by the white arrows in panel (b)
Figure 5.3
Example of beam hardening artifact resulting from extensive calcium. On the left, the left anterior descending artery is heavily calcified and the beam hardening artifact is seen as dark regions denoted by the white arrow. The right hand side of the figure illustrates more subtle beam hardening resulting from the calcium (white arrows)
< div class='tao-gold-member'>
Only gold members can continue reading. Log In or Register to continue
Stay updated, free articles. Join our Telegram channel
Full access? Get Clinical Tree
