(1)
The Lindner Center for Research and Education The Christ Hospital, The Christ Hospital Physicians Ohio Heart and Vascular Center, Cincinnati, OH, USA
Keywords
Attenuation coefficientμAttenuationKeVCT detectorDetector II0 eIncident x rayPhotodiodeTube voltageKiloelectron voltPhoton fluxx ray fluxx ray generatorx ray tubeMilliamperemACT numberHounsfield unitH.UTissue densityCT scannerGantryx ray sourceSlip ringData assembly systemDASHalf gantry rotationx ray beam detectionx ray detectorAbsorption efficiencyConversion efficiencyCapture efficiencyDynamic rangeSolid state scintillation detectorsMultislice CTMSCTSingle Slice CTSSCTMDCTMultirow CTMultidetector CTz axisx axisy axisSlice thicknessSlabSlab thicknessDetector arrayx ray beam widthCone beam effectsCollimationImage reconstructionFiltered back projectionFBPIterative reconstructionIRWindowingWindow widthWindow lengthForward projectionFilteringKernalsImage reconstructionConvolution filtersCT image contrastSpatial resolutionContrast resolutionTemporal resolutionNyquist limitLine pairsMatrixMultisegment reconstructionProspective triggeringProspective imagingHelical imagingRetrospective triggeringRetrospective imagingCollimationImage noiseField of viewFOVVoxelMatrix sizeScanned field of view sFOVDisplayed field of viewdFOVComputer screen matrixHounsfield UnitsH.UCT numberAxesImage axesPitchSlice thicknessAcquisition field of viewaFOVBasic CT Physics and Technology
Computed tomography (CT) images are depictions of relative (not absolute) attenuation of x rays as they pass through the body. CT images depict tissue densities. A tissue’s CT attenuating ability is related to its density and represents the likelihood that an x ray photon will pass through the tissue to be recorded by the detectors rather than interacting with tissue’s atoms (absorption of the x rays into the tissue) which prevents the photon from reaching the detector at all. A particular tissue’s x-ray attenuating ability is expressed by its attenuation coefficient, μ. The higher the μ value, the lower the number of photons that reach the detector when passing through that tissue type. The μ value is directly related to the tissue’s density. That is, the higher the tissue density, the higher its μ value. However, the attenuation coefficient of a tissue is not constant and may be altered by the tissue thickness and the energy of the x ray photon (KeV), Fig. 2.1. Increasing the tissue thickness and decreasing the photon energy will result in higher attenuation coefficients for the same tissue.
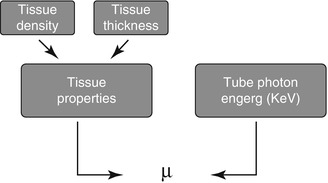
Figure. 2.1
A diagram illustrating the factors contributing to μ
The CT detector is a photon flux counter where a scintillation detector measures, records, and converts to light the incident x ray photons exiting the patient. This light is then transformed to an electrical signal by the photodiode and the electrical signal is then converted to a digital signal by the computer. The photon flux measured by the detector is represented by the term I where I is a function of the photon flux emitted by the x ray tube (I 0 ) and the attenuation coefficient (μ) of the tissue. I = I 0 × e −μ . As μ increases, the fraction e−μ decreases such that as μ increases, the fraction of the incident photons leaving the x ray tube that are detected by the detector decreases. Thus, the resulting photon flux measured by the detector is a fraction of the photons leaving the x ray tube. Figure 2.2 illustrates the calculation of μ and of the CT number.
Figure. 2.2
Panels (a–c) demonstrate the calculation of the CT number (Hounsfield unit) and the attenuation coefficient (μ)
The tube voltage (photon energy) is the energy possessed by each individual x ray leaving the x ray generator and its unit is the kiloelectron volt (KeV). The tube current or photon (x ray) flux is the frequency with which x rays leave the x ray tube and its unit is the milliampere (mA). Increasing the KeV will have the following effects. The tissue penetration will increase, the μ value will decrease, the number of photons detected by the detector will increase, the image noise will decrease, the radiation dose will increase and the visualized tissue contrast will decrease. Therefore, increasing KeV will decrease the CT number of the iodinated contrast and result in less opacified coronary arteries. The opposite is also true. Decreasing the KeV will result in higher CT numbers and brighter contrast within the coronary arteries. Increasing mA serves to decrease image noise, to increase the radiation dose and to increase the visualized tissue contrast.
The attenuation coefficient of a particular tissue is not measured directly but rather is calculated using the count data (I and I0) by manipulating the equation I = I0 × e−μ. The Hounsfield unit behind the image is known as the CT number. It is computed from the calculated attenuation coefficient using the equation CT number = [(μ tissue − μ water )/μ water ] × 1,000. The CT number is inversely related to μ such that the greater the μ value, the higher the CT number. The CT number is directly related to the brightness of the image where higher CT numbers appear brighter on the screen. The CT number or Hounsfield unit (H.U) is not an absolute number. It is a representation of the density of the particular tissue relative to the density of water, which is assigned, by convention, a CT number of 0. CT number and H.U. are synonymous Table 2.1 depicts common H.U. measurements.
Table 2.1
Hounsfield unit values for various commonly encountered materials
Substance | Hounsfield unit value |
|---|---|
Water | 0 by convention (−20 to +20) |
Atheroma | +70 (+20 to +130) |
Fat | <−80 |
Fibrous tissue | +100 to +130 |
Calcium | >130 |
Iodinated contrast | >+125 |
Thrombus | +50 |
Tissue | +50 |
Blood | +30 |
Air | <−900 |
Beam hardening artifact | <−50 |
The CT Scanner
The CT image is an overall estimation of the attenuation of x rays as they pass through the body. This process creates a reconstruction of the computerized densities of the object through which the x rays pass, measuring the densities in three dimensions and displaying them on a computer screen. These densities are represented by Hounsfield units or CT numbers as mentioned previously and further discussed later. Projections in a 360° rotation of the gantry (Fig. 2.3) are collected in a computerized bin where they serve as an estimate of the true x-ray density and location of the objects in the body through which they passed. By collecting numerous x ray projections, a realistic estimate of the object’s density and location is created.
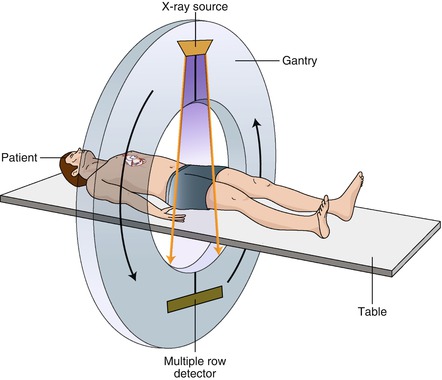
Figure. 2.3
A cartoon depiction of a typical CT scanner
As depicted in Fig. 2.3, the x ray source and detectors are housed within the gantry which rotates around the patient (helical scanning technique). The cone shaped x ray beams emanate from the tube source on one side of the gantry, pass through the patient and terminate at the detectors on the other side of the gantry. The gantry rotates quickly around the patient as the table moves through the opening in the gantry. This technique is made possible by the slip ring which allows data to be transferred from the detectors to the data assembly system (DAS), discussed below, without the use of wires, which, if present, would be tangled during gantry rotation. Slip ring technology permits rapid gantry rotation without wire tangling. If the gantry rotates a full circle around the patient, a 360° image along the entire scan field is created. With a single-source scanner, a minimum of 180° of rotation (half-gantry rotation) is all that is necessary to reconstruct a complete image (discussed further below). The remaining 180° are back calculated since data from the opposite 180° are a mirror image of the first 180°. By reducing the gantry rotation angle, the speed to complete one rotation is reduced, resulting in improved temporal resolution (discussed later).
Once the x rays are collected by the detectors, the measured attenuated x ray signal is converted to a raw data set via an electrical signal which requires a complex set of mathematical calculations. These raw data represent the acquired density measurements in the axial plan (head to toe or z axis). Reconstruction algorithms (see below) are then applied to the raw data to estimate each projection line in an x and y axis, which provides a precise three-dimensional location of a density within the body. The full compliment of densities are then converted to a computerized image, which is reconstructed and viewed on the computer workstation screen as a complete CT image.
X Ray Detectors and X Ray Beam Detection
The CT detectors capture the attenuated x ray beams after they pass through the patient and convert them to electrical signals, which are subsequently converted into binary coded packets of information which are transmitted to the computer system for further processing. The data acquisition system (DAS) refers to the detectors’ electronics which are positioned between the detector array and the computer. The DAS measures the transmitted radiation beam, encodes these measurements into binary data and transmits these data to the computer.
Detectors must be capable of reacting quickly without lag and must quickly discard one signal before the next signal arrives. They must be consistent in their response and small in size. They also require a high capture efficiency, a high absorption efficiency, and a high conversion efficiency. Capture efficiency describes how well the detectors receive in coming x ray photons from the patient. It is related to detector size and spacing. Absorption efficiency depends on how well the detectors convert incoming x ray photons to electrical signals. Absorption efficiency is determined by the detector material, size and thickness. Conversion efficiency describes how well the detector converts the incoming x ray signal to a digital signal.
In addition to capture efficiency, absorption efficiency and conversion efficiency, detectors should be stable, have quick response times and possess a wide dynamic range. Stability is controlled by how often the detectors must be recalibrated to meet quality control standards. Response times relate to the speed with which the detector can recognize and incoming signal, process it and be ready for the next input. Dynamic range represents the ratio of the smallest detectable signal to the largest detectable signal. Modern CT detectors have a dynamic range of on the order of 1 million to 1 [1].
CT scanners currently use solid state scintillation detectors made of cadmium tungstate and ceramic material made of highly purified rare earth oxides. The advantages of solid state detectors are that they have near 100 % absorption efficiency and are capable of receiving signal from a moving x ray beam such as from a rotating source in a gantry. However, because they cannot be tightly packed, their capture efficiency is suboptimal resulting in a total detector efficiency of near 50 %. The resolution of solid state detectors is suboptimal as well.
Multislice CT (MSCT)
One problem quickly encountered with single slice (single detector row) helical scanning (SSCT) was excess stress on the x ray tube. That is, the x ray tube would heat to extreme temperatures as very high energy was deposited onto the anode. This problem limited the ability to perform thin slice imaging necessary for acceptable coronary imaging. Alternatively, if thin slice imaging were performed, tube current was limited to 100 mAs, which in many instances was not satisfactory and produced noisy images. Thus, multislice CT scanners (MSCT) were created. MSCT is also known as multidetector CT (MDCT) and multirow CT.
The primary difference between MSCT and SSCT is the detector arrangement (Fig. 2.4). SSCT uses a one dimensional detector arrangement where many individual detector elements are arranged in a single row across the irradiated slice that receives the x ray signals. In MSCT, each detector in a single row is long enough in the slice thickness direction (z axis) to intercept the entire x ray beam width including the penumbra. Each individual detector in each row is then divided into multiple detector elements forming a two-dimensional array. In MDCT, there are multiple rows of detectors. By increasing the number of detector rows, the z axis coverage slab thickness increases thereby decreasing the number of gantry rotations necessary to image the selected field of view (scan length), theoretically reducing the strain on the x ray tube. If each detector were, for example, 1.25 mm long and the scanner had 16 rows of detectors, the z axis coverage (slab thickness) per gantry rotation would total 20 mm. However, a typical scan would acquire over 1,000 views per gantry rotation and collect data along over 800 detectors in each row, thus generating huge amounts of data. Due to early limitations in acquiring, handling and processing such large quantities of data, MSCT was limited to four detector rows only. Subsequent MSCT scanners possessed increasing numbers of detector rows starting at 16 rows and moving to 64, 156 and 320 rows. The coverage (slab thickness) varies by detector row number where slab thickness per gantry rotation is directly proportional to detector row number. CT scanners of the same detector row number may have different slab thicknesses depending on the z axis size of each individual detector. Smaller detectors (while providing improved spatial resolution) will cover less of the z axis per detector row and thus for any given detector row number, a smaller detector size will result in less coverage per gantry rotation. Figure 2.5 depicts the concept of slab thickness.
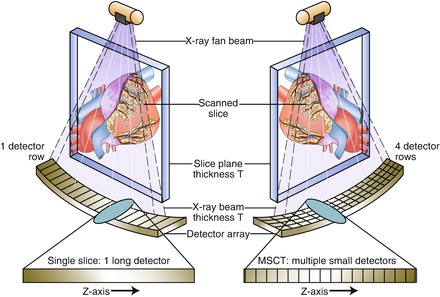
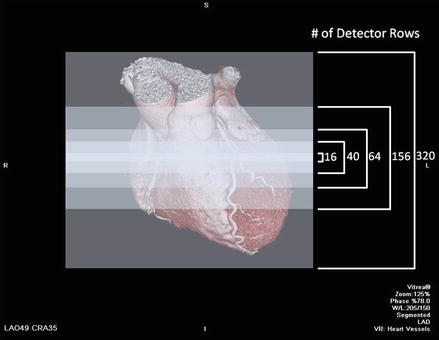
Figure. 2.4
A cartoon depicting a single slice scanner and a multislice scanner
Figure. 2.5
An artificial representation of the meaning of slab thickness or z axis coverage. Z axis coverage is directly proportional to detector row number
In MDCT, the entire detector array consists of groupings each of which are connected to the mother board unit of the detection system. Each group may be selectively activated or deactivated providing various slice thicknesses which may be predetermined depending on the scan indication. In addition, detector arrays within a given row may be varied. For example, the inner detector rows, which are made up of narrower detectors than the outer rows may be selectively activated such that the slice thickness will narrow (Fig. 2.6). Additionally, pairs of detectors may be linked to create thicker slices.
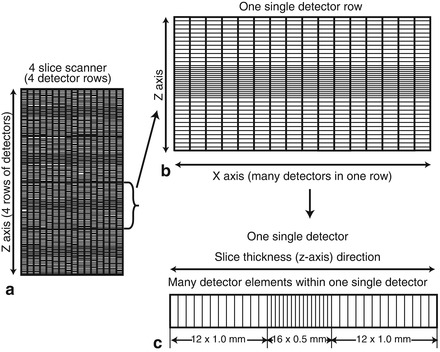
Figure. 2.6
Cartoon depicting a particular detector array configuration. Panel (a) depicts a four slice scanner (four detector rows). Panel (b) illustrates one single detector row. Within each row, there are multiple single detectors. There may be as man as 800 detectors per row. Panel (c) depicts a single detector within one single detector row. Each single detector has multiple detector elements. This particular detector contains two outer groups of twelve 1 mm detector elements and one inner group of sixteen 0.5 mm detector elements. Elements within a detector can be combined or isolated to create varying slice thicknesses and even submillimeter slice thicknesses necessary for coronary artery imaging
Two significant other differences exist between SSCT and MSCT. The first involves the relationship between slice thickness and x ray beam width. The second relates to cone beam effects. In SSCT, slice thickness is determined by pre-patient and post-patient collimators (discussed later). X ray beam collimation was designed such that the z axis width of the x ray beam at the isocenter (center of rotation) was the desired slice thickness. In MSCT, however, slice thickness is determined by detector configuration and not x ray beam collimation. Since the detector width or linked detector element width determines the acquired x ray beam thickness (slice thickness), this length is referred to as detector collimation.
Cone beam effects in CT are streak artifacts associated with the divergent nature of the x ray beam emitted from the patient [1]. This means that the z axis width of the x ray beam is wider when it exits a patient than when it enters. X ray beams 180° apart are sampling the same tissue planes but their cone-shaped x ray beam sampling is slightly different at 0° than at 180° making the opposite, supposedly identical images, slightly inconsistent. This results in partial volume streaking, which is accentuated with wider x ray beam widths; as such, cone beam artifacts are more pronounced with MSCT than with SSCT. Cone beam artifact severity is directly proportional to the number of detector rows.
Image Reconstruction Techniques
From the computed CT numbers, the total CT image must be reconstructed for display. There are currently two forms of image reconstruction: Filtered back projection (FBP) and iterative reconstruction (IR). FBP involves summing the data from hundreds of projection angles to reconstruct the image. Since the data from a projection angle of 0° is identical to the data from a projection angle of 180°, only the data from a 180° gantry rotation is necessary to reconstruct the full CT image. Figure 2.7 is a cartoon illustrating the concept of FBP. The displayed CT image is composed of the CT number data (Hounsfield unit data) from the summed projection information and the windowing (discussed below) that is applied to the image. FBP advantages include its relatively short time for complete reconstruction (≤30–40 slices per second) [2] and its power. Image quality is acceptable but not optimal and thus, its major disadvantage is its limitations in image quality due to the necessary filtering used with this technique. These filtering techniques accentuate noise and mandate the need for higher radiation doses to permit adequate image quality. The excess image noise using FBP results from the inaccuracy of several assumptions used in this technique that limit spatial resolution and lead to increased streak artifact and relatively poor low contrast detectability. FBP tends to falter in larger patients due to increased tissue attenuation and in intentional low radiation dose scanning, which is becoming more important as understanding and awareness of the effects of cumulative radiation dose are realized. However, the advantages and acceptability of FBP have traditionally limited the incentive to change reconstruction methods. However, with the increased numbers of CT scans and the advanced applications such as cardiac CT angiography, the importance of more radiation efficient reconstruction methods has been emphasized, mandating the onset of IR.
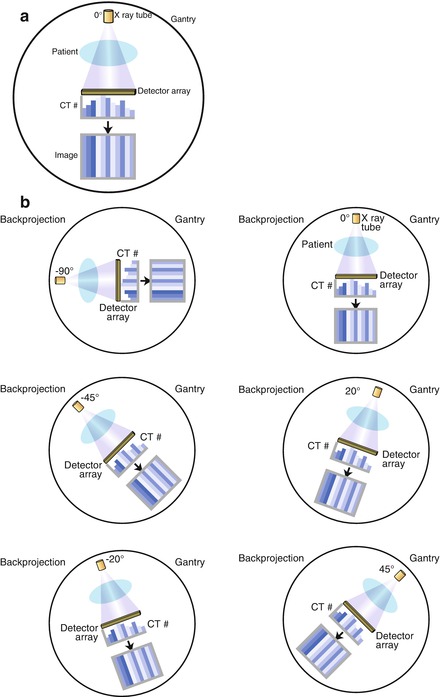
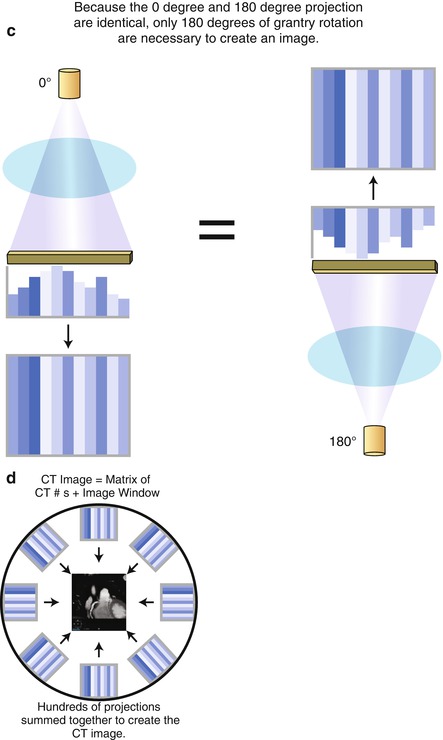


Figure. 2.7
A cartoon depiction of the concept of filtered back projection. Panel (a) is an illustration of the creation of the computed tomography (CT) image at a gantry angle of 0°. X rays are generated by the X ray tube and pass through the patient and are recorded by the detectors array. The CT numbers (Hounsfield units) are calculated and used to create the image. Panel (b) conceptualizes the concept that data are collected at each of the hundreds of gantry angles. Panel (c) demonstrates that the data collected at a gantry angle of 0° is equivalent to the data collected at 180°. Therefore, only a half gantry rotation is necessary to collect the necessary data for a complete CT image. Panel (d) is a cartoon illustrating that all the data from each gantry angles are summed to create the complete CT image
< div class='tao-gold-member'>
Only gold members can continue reading. Log In or Register to continue
Stay updated, free articles. Join our Telegram channel
Full access? Get Clinical Tree
