Overnight sleep studies are usually performed in a facility dedicated to sleep investigations. Most sleep laboratories have one or more bedrooms in which environmental noise, ambient temperature, lighting, and decor are controlled, thus facilitating the patient’s sleep. The technologist and polygraphic equipment are located in a separate room to minimize any disruption to the patient’s sleep. An intercom is used to monitor and communicate with the patient as needed. Most laboratories also videotape the night’s sleep, so behavioral or respiratory events can be reviewed. The machines used are similar to the commonly used digital EEG machines, but also have the ability to transfer other digital information (e.g., SaO2, CPAP pressure) to the recording.
The patient is scheduled to arrive for the nocturnal study 60 to 90 minutes before his usual bedtime. During electrode application, the technologist reviews the patient’s history and offers an explanation of the study procedure. Medical information from the referring physician should be available at the time of the study to assure that the correct procedure is performed, to assist in decision-making during the study, and to complement the subsequent interpretation. Patients are usually asked to complete sleep questionnaires and Epworth Sleepiness Scale (ESS), which are then available to the interpreting physician to assist in assessing the clinical significance of the PSG findings. The usual study duration is 6 to 8 hours, depending on the specific clinical problem. When the patient awakens in the morning, the technologist obtains the patient’s impression of the night’s sleep and how it may have varied from his usual night’s rest. This information may be important in the clinical correlation of the sleep study results. Sleep studies are visually scored by the sleep technologist. The sleep study tracing and scored data are then reviewed by a polysomnographer, who provides the interpretation and clinical correlation.
Digital EEG technology has proven to be an extremely useful tool for PSG studies. It has simplified the handling and storage of such large amounts of physiologic data. The ability to expand the number of channels also allows a greater sampling of EEG, which can then be reviewed at “routine EEG paper speed” (30 mm per second) to allow better assessment of a possible epileptic event that can be very difficult to interpret when EEG recordings were available only at PSG paper speed (10 mm per second) (11). The digitalization of the information lends itself to computer analysis. However, at this time, it is still the standard to do visual scoring of sleep stages according to the AASM Scoring Manual, given the unreliability of most sleep staging programs (9,12). Improvement in computer-aided sleep scoring may make sleep study scoring a less laborious task in the future. Computer analysis also has a potential to go beyond the standard (and somewhat arbitrary) epoch-by-epoch scoring of sleep and capture information about the microstructure of sleep that may have important clinical or research implications.
Minimal polygraphic requirements to score sleep adequately include two channels of EEG, one channel for the electrooculogram (EOG) and one channel for the submental electromyogram (EMG). Routine PSG utilizes additional channels to assess respiration, leg movements, oxygenation, and cardiac rhythm. The following is a brief review of “standard” technology involved in PSG recordings. Other reviews of PSG technique may also be helpful to the reader (13,14).
EEG Sleep Recording
As with routine EEG, nonpolarizable silver-silver chloride or gold electrodes are standard and are attached with collodion to maintain adequate contact for the 6 to 10 hours required for an overnight study. The international 10–20 system is used for electrode placement (15), but a much more limited EEG montage is selected as outlined later. Early sleep investigators were limited by channel availability and could commit only one channel to EEG recording (central EEG lead to contralateral ear, e.g., C4-A1). As a result, the scoring manual of Rechtschafen and Kales was based on that single lead derivation. However, the poor sampling of waking alpha activity by this montage led most investigators to add at least one additional channel (occipital lead to more anterior reference, e.g., O1-A2) for better separation of wakefulness from stage 1 (drowsiness). The recent AASM Scoring Manual recommended a minimum of three EEG channels: F4-M1, C4-M1, O2-M1 (9). The use of the F3 or F4 electrode recognizes that sleep spindles and vertex waves are often seen more prominently in a frontal derivation. In addition, many laboratories commit at least two additional channels to EEG. A transverse vertex montage (e.g., T3-Cz, Cz-T4) is often preferred because it is sensitive to the identification of sleep spindles and vertex waves. Bilateral central, occipital, and ear electrodes are routinely placed so that in the event of electrode failure, the homologous contralateral derivation can be used without disturbing the patient. Occasional patients, such as those with possible nocturnal seizures, require a more extensive EEG montage for adequate assessment, usually a minimum of 16 channels (11).
Routine “paper speed” or recording display for the PSG is 10 mm per second (6). This is initially disconcerting to the EEGer trained using a display of 30 mm per second. The slower paper speed was chosen to reduce paper use and to improve visualization of events (e.g., apneas) that occur over a relatively long period of time. Displaying the PSG using “slow paper speeds” still allows clear visualization of alpha rhythm and sleep spindles. In fact, the characteristic appearance of sleep spindles, “saw tooth” waves, and eye movements is more easily recognized at slower paper speeds once the interpreter has adjusted to the altered appearance (Fig. 18.1). EEG filter settings are low-frequency filter (LFF) of 0.3 Hz and high-frequency filter (HFF) of 35 Hz. The extended low-frequency band is important to assess the prominent slow wave activity seen during deeper stages of NREM sleep. Amplifier sensitivity is usually 5 to 10 μV per mm, with 7 μV per mm used most commonly. Because voltage of the delta range activity is important in determining sleep stage, it is imperative that any change in EEG channel sensitivity be clearly “flagged” to avoid sleep scoring errors.
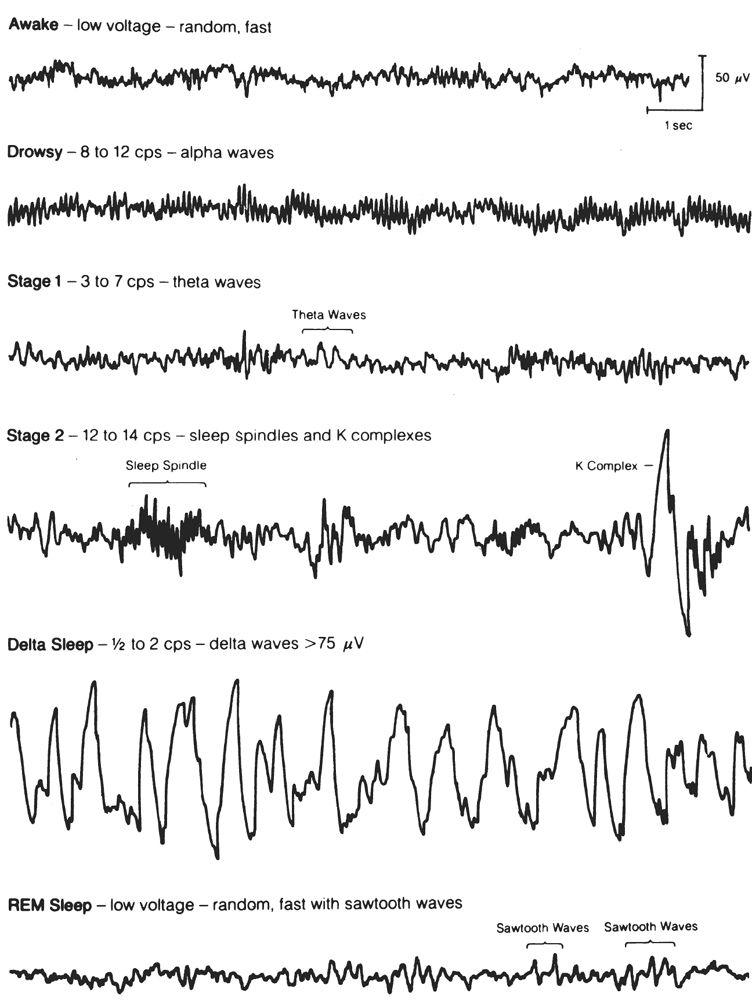
Figure 18.1: EEG activity characteristic for each of the sleep stages. The activity is recorded from the usual sleep study derivation (C4-A1) and displayed at 10 mm per second. Delta sleep is an alternate name for what is now termed stage N3. (From Hari P. The sleep disorders. Kalamazoo, MI: Upjohn Co., 1982:5–62.)
Electrooculogram
The EOG is obtained primarily to identify phasic bursts of REMs that constitute the cardinal sign of REM sleep. In addition, these electrodes allow identification of slow lateral eye movements, which are often the first and most dependable manifestation of drowsiness (16). Gold-plated or silver-silver chloride EEG cup electrodes are used to record EOG, but collodion should be avoided because of possible corneal injury. EEG electrolyte paste with additional sticky tape over the electrodes offers adequate attachment and avoids the risk of eye injury. The most common montage to record eye movements (and as recommended by the AASM manual) is a referential recording with the first channel recording from an electrode 1 cm lateral and 1 cm superior to the outer canthus and referred to the ipsilateral ear. A second channel records activity from a location 1 cm lateral and 1 cm inferior to the contralateral outer canthus referred to the ipsilateral ear. This two-channel derivation shows eye movements as out-of-phase potentials, thus increasing the interpreter’s confidence in correctly identifying REMs (Figs. 18.2 and 18.3). Sensitivity and filter settings for the EOG are similar to those used for EEG recording.
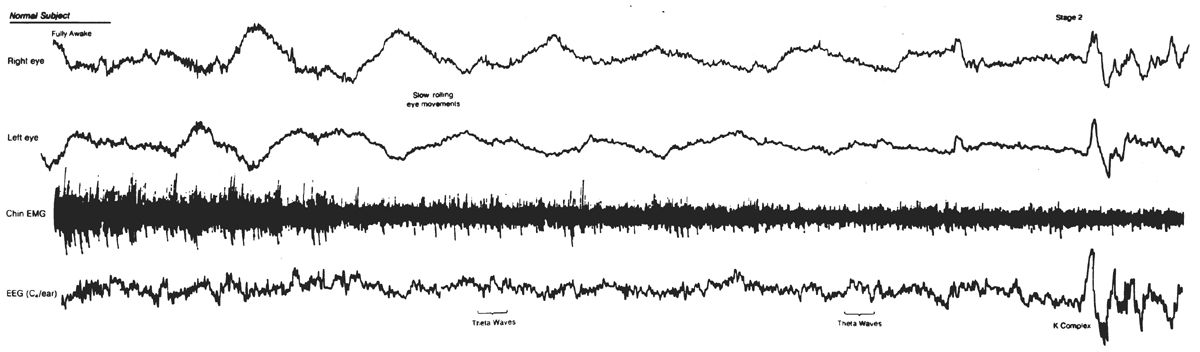
Figure 18.2: Slow eye movement (SEMs). Note the slow rolling eye movements appearing as out-of-phase activity in EOG channels. SEMs accompany the appearance of mixed-frequency theta activity typical for stage 1 sleep. K complex near end of epoch denotes onset of Stage 2. K complex appears as in-phase activity in EOG channels, reflecting its cerebral origin. (From Rechtschaffen A, Kales A, eds. A manual of standardized terminology, techniques, and scoring system for sleep stages of human subjects. Los Angeles, CA: UCLA Brain Information Service/Brain Research Institute, 1968.)
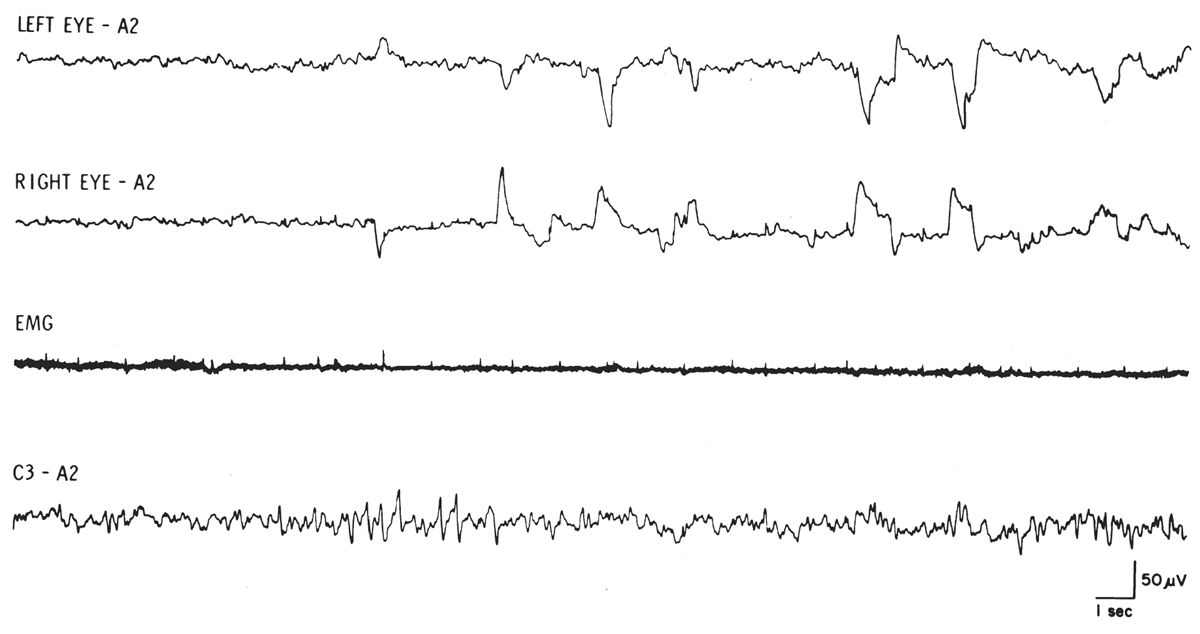
Figure 18.3: REM sleep with relatively low-voltage, mixed-frequency EEG, REMs, and tonic EMG at lowest level during sleep. Note series of typical sawtooth waves at onset of REM activity. (From Rechtschaffen A, Kales A, eds. A manual of standardized terminology, techniques, and scoring system for sleep stages of human subjects. Los Angeles, CA: UCLA Brain Information Service/Brain Research Institute, 1968.)
REMs are defined as conjugate, irregular, sharply peaked eye movements with an initial deflection of less than 500 milliseconds (9). REMs are characteristic of stage R sleep (stage REM) but are also seen in wakefulness, particularly with eyes open. Most commonly, the sharp slope of a REM is shorter than 300 milliseconds. Slow eye movements (SEMs) are conjugate, somewhat regular, sinusoidal eye movements with an initial deflection lasting greater than 500 milliseconds (9). The sinusoidal SEMs usually have a frequency of 0.25 to 0.5 Hz compared with REMs that are usually very irregular and commonly have a frequency greater than 1 Hz. Obviously, the rate of return to baseline of any EOG waveform is dependent on the alternating current (AC) filter setting and the superimposition of any additional eye movements. Thus, the abrupt slope of the EOG waveform is the most reliable differentiating feature.
Axial Electromyogram
Submental (chin) EMG activity reflects axial muscle tone and is used as one criterion for identifying REM sleep and movement arousals. Submental EMG is recorded by placing regular EEG electrodes over the mylohyoid muscle. One electrode is placed 1 cm above the tip of the jaw, and the second electrode is placed 2 cm below the inferior edge of the mandible and 2 cm off of the midline. This second electrode should be placed bilaterally, functioning as a backup electrode from which to select the most reliable EMG recording.
Tonic EMG activity from axial musculature gradually decreases from wakefulness through stages N1-N3 of sleep and is usually entirely absent during REM sleep. Sensitivity of the submental EEG channel should be adjusted during drowsiness to reflect moderate activity. Subsequent adjustments should be avoided during the night to permit comparison of EMG activity during different portions of the record. Typical sensitivity of the EMG is 2 μV per mm, with filters set at LFF = 10 and HFF = 100.
Anterior Tibialis EMG
Anterior tibialis EMG activity is monitored to detect periodic leg movements (17,18). Regular EEG electrodes are placed over the anterior tibialis muscle bilaterally. The anterior tibialis muscle can be easily identified on the anterior lower leg by having the patient dorsiflex his foot against resistance. Two electrodes 3 cm apart are placed over each anterior tibialis. A bipolar recording from each anterior tibialis is usually obtained. Sensitivity and filter settings are similar to those described for submental EMG recording. A semi-standardized baseline is obtained before the study by asking the patient to dorsiflex a foot gently. Figure 18.4 is an example of periodic leg movements of sleep recorded from the anterior tibialis EMG electrodes.
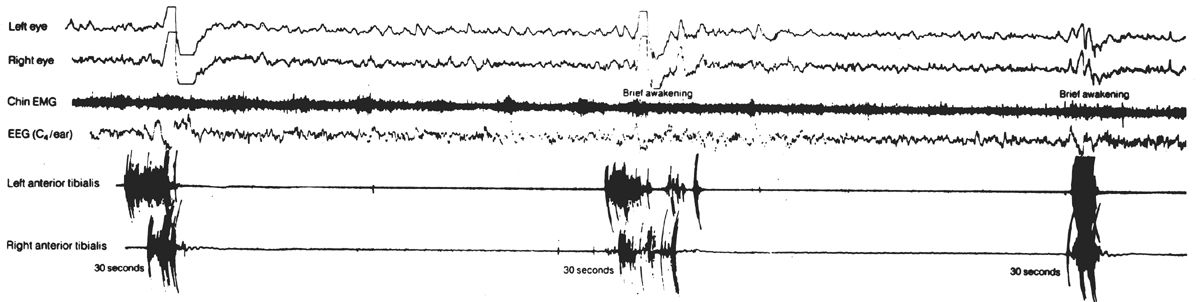
Figure 18.4: Periodic limb movements of sleep (PLMS). The anterior tibialis EMG recording demonstrates bursts of periodic EMG activity associated with EEG arousals. (From Hari P. The sleep disorders. Kalamazoo, MI: Upjohn Co., 1982:5–62.)
Inasmuch as the suspicion of sleep apnea is the most common indication for overnight PSG, respiratory monitoring is arguably the most important technical aspect. Although measurements of airflow and ventilatory effort are technically the most difficult of all polysomnographic variables, they are essential to the adequate assessment of breathing during sleep. Both airflow and a measure of ventilatory effort must be recorded in order to distinguish among central, mixed, and obstructive apneic events (Fig. 18.5). In a central (or nonobstructive) apnea, the absence of respiratory drive causes all mechanical efforts to cease, and no airflow occurs at the nose or mouth. In an obstructive apnea, ventilatory efforts continue but no airflow occurs; this is due to occlusion of the airway. A mixed apnea begins as a central apnea (without ventilatory effort or airflow), but then the picture of obstructive apnea develops (ventilatory effort without accompanying airflow). Apneas are arbitrarily defined as cessation of airflow for 10 seconds or longer (19). In addition, hypopneas (decreased airflow) are also clinically significant. Specific scoring criteria for respiratory events are discussed in the section on polysomnographic interpretation. All measures of airflow or ventilatory effort use a LFF of 0.1 Hz and a HFF of 15 Hz.
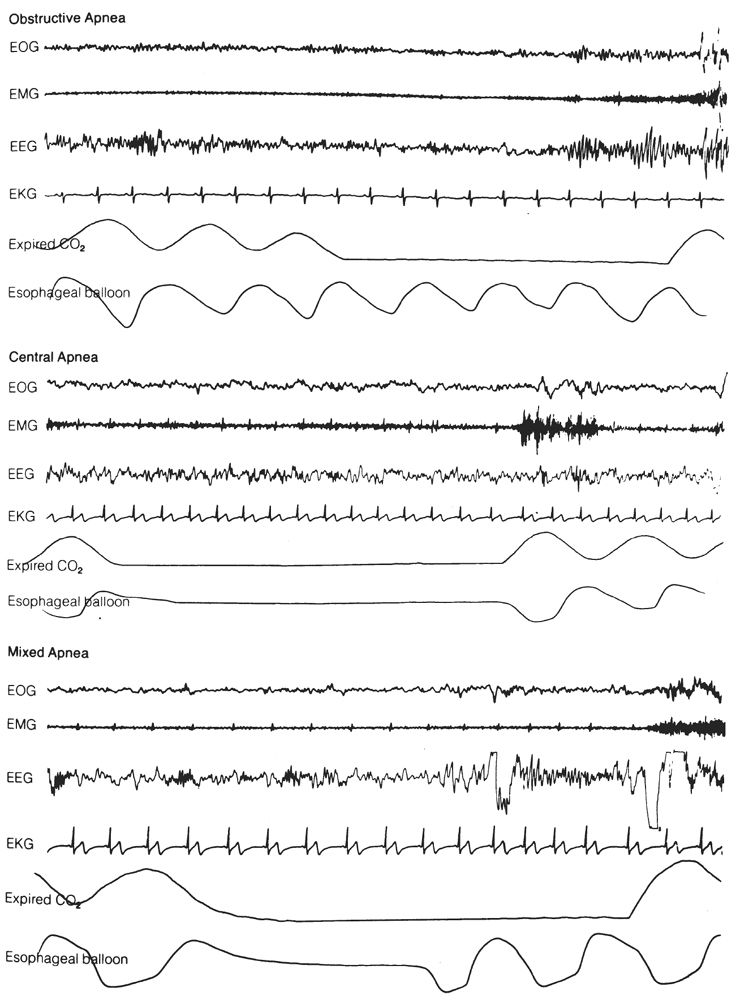
Figure 18.5: Examples of obstructive, central, and mixed apneas. Compare airflow (measured by CO2 analysis) and ventilatory effort (measured by intraesophageal balloon). (From Hari P. The sleep disorders. Kalamazoo, MI: Upjohn Co., 1982:5–62.)
Airflow Monitoring
Thermistors/Thermocouples
Thermistors or thermocouples are the least expensive and most commonly used method of monitoring airflow (13,19). Thermistors are small glass beads or wires whose electrical resistance changes as a function of temperature. When powered by a 1.5-V battery, the voltage drop across the thermistor varies with temperature. Expired air warms the thermistor and produces a signal that can be displayed on a polygraph. A thermocouple consists of two dissimilar metals in electrical contact, which produces a low-voltage signal that varies with the temperature change caused by expired air.
Small, lightweight thermistors (or thermocouples) are taped to the face under each nostril and in front of the mouth. It is crucial to monitor both nostrils and mouth because the airflow path frequently changes during the night as a function of patient position. Activity from the thermistors can be summed and displayed in a single channel. Patient movement may disturb the position of the thermistors and result in loss of signal. Thus, careful attention needs to be paid to thermistor position throughout the night. Thermistors and thermocouples are less sensitive to airflow changes than the nasal pressure transducers discussed later. Therefore, hypopneas (reflecting a decrease in airflow) are scored from the nasal pressure transducer recording, while apneas are scored off the thermistor/thermocouple channel.
Nasal Pressure Transducer
In the last decade, nasal pressure transducers (NPTs) have become a standard technique in monitoring airflow during polysomnography (9,20,21). Nasal cannula pressure systems generate a respiratory waveform signal by detecting the fluctuations in pressure caused by inspiration and expiration. Unlike the inspiratory and expiratory fluctuations recorded due to temperature changes from a thermocouple or thermistor, these NPT signals are truly proportional to flow and are able to note changes in airway resistance and more modest changes in airflow (Fig. 18.6). Consequently, airflow as measured by NPT is far more sensitive and accurate in the capture of hypopneas and “Respiratory Effort Related Arousals” (RERAs) (22). This increased sensitivity is routinely seen on PSG recordings and has led to the AASM recommendation to use NPT in tandem with thermistors or thermocouples for monitoring of airflow during a PSG (9).
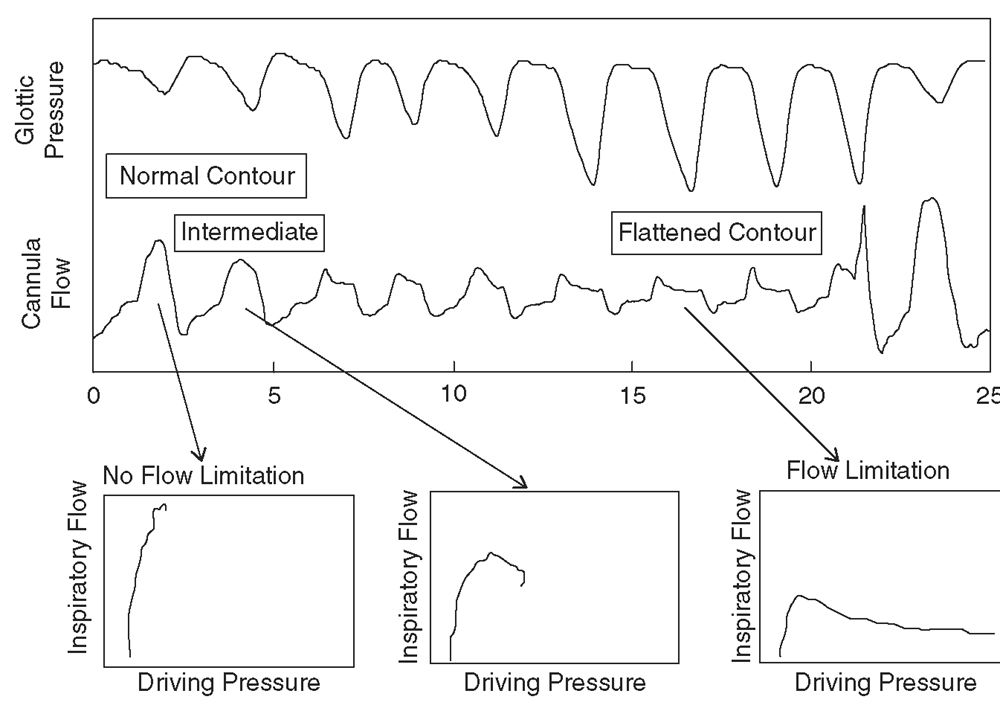
Figure 18.6: Pressure/flow relationships from nasal cannula/pressure transducer during a single respiratory event. The x-axis shows time in seconds. Breaths with normal, intermediate, and flattened flow contours are labeled and a plot of the driving pressure/flow relationship is shown. The flattened flow/time contour shows a nonlinear flow/pressure relationship characteristic of flow limitation. (From Hosselet JJ, Normal RG, Ayappa T, et al. Detection of flow limitations with a nasal cannula/pressure transducer system. Am J Respir Crit Care Med 1998;157:1461–1467.)
CO2 Detectors
Measuring the carbon dioxide (CO2) of expired air can serve as an alternative method of monitoring airflow (19,23). It is based on the principle that exhaled air contains 6% to 7% carbon dioxide, whereas inhaled air contains negligible amounts of CO2. In order to sample CO2 content, a cannula is inserted just inside the nostril and is connected to an infrared or mass spectroscopy analyzer. For routine clinical PSG, the small increase in sensitivity for detecting air movement using CO2 detectors does not usually warrant the added expense and technical demands. However, end-tidal PCO2 (PETCO2) monitoring is an essential component of assessing sleep-disordered breathing (SDB) in children. The clinical importance of PCO2 monitoring in pediatric sleep apnea has led to its wide application in pediatric sleep laboratories. The PETCO2 is prone to providing falsely low values in patients who are mouth breathers or who have a high degree of nasal obstruction. The use of supplemental O2 or CPAP also makes the recording inaccurate. End-tidal CO2 is often supplemented by transcutaneous PCO2 monitoring. However, the transcutaneous method provides only a semiquantitative measure of alveolar ventilation and varies significantly from measured PaCO2 (23).
Pneumotachography
Pneumotachography is the only method that allows direct quantification of ventilation during sleep. Pneumotachography uses a technology very similar to the NPT devices discussed earlier. However, the technique involves an uncomfortable tight-fitting mask and a flow-to-pressure transducer that offers considerable resistance to respiration. While technically superior to the other methods of monitoring airflow, the sleep disruption and increased respiratory resistance preclude the routine use of pneumotachography in clinical PSG (24).
Ventilatory Effort Monitoring
For many years, there was a great deal of variability in the use different techniques to monitor respiratory effort. Early techniques included intercostal EMG and strain gauges. More recently developed techniques included inductive plethysmography (IP) and piezoelectric belts. Esophageal manometry was available as well, but limited in its use due to its invasive nature and potential impact on sleep. In the 2007 AASM Scoring Manual, the recommendation was for use of calibrated or uncalibrated IP or esophageal manometry for the detection of respiratory effort (9). This has led to IP as the primary technique for monitoring respiratory effort. However, in the most recent update to the scoring manual in 2012, new information led to the piezoelectric belts being listed as an acceptable method of monitoring respiratory effort as well (10,25).
Inductive Plethysmography
IP utilizes a conductive wire that is sewn into an elastic band or mesh that encircles the chest or abdomen. With expansion of the body wall, the circle of wire enlarges and the inductance of the loop is changed. When an AC current is applied to this wire, the variable inductance can be displayed on an AC or DC polygraph channel. This technique is much more powerful than the early techniques utilized inasmuch as it provides a quantitative measure of airflow. This method also permits more accurate determination of lung expansion regardless of patient position (26,27). The instrument is carefully calibrated so that the sum of the chest and abdominal signals will be proportional to the volume of airflow. If the airway is obstructed, no air will be exchanged; any change in chest volume will be associated with an opposite change in abdominal volume (paradoxical respiration), and the sum of the two will be zero (representing no airflow) (Fig. 18.7). Theoretically, complete ventilatory monitoring can be accomplished with two bands around the chest. The three-output channels are rib-cage movement, abdominal movement, and total volume. Obstructive apneas are recorded as continued respiratory movement of both thorax and abdomen, but with no significant change in total volume signal (Fig. 18.8). In central apneas, all three signals are suppressed. Mixed apneas, as expected, show a central pattern followed by an obstructive picture. Hypopneas may also be quantified by this technique. Theoretically, an independent measure of airflow (thermistor) is unnecessary. However, because of difficulties in calibration (especially in obese patients) and slippage of coils, this technique usually requires an additional monitor of airflow. Although it increases cost and is more technically demanding, IP offers significant advantages over other methods of monitoring respiratory effort.
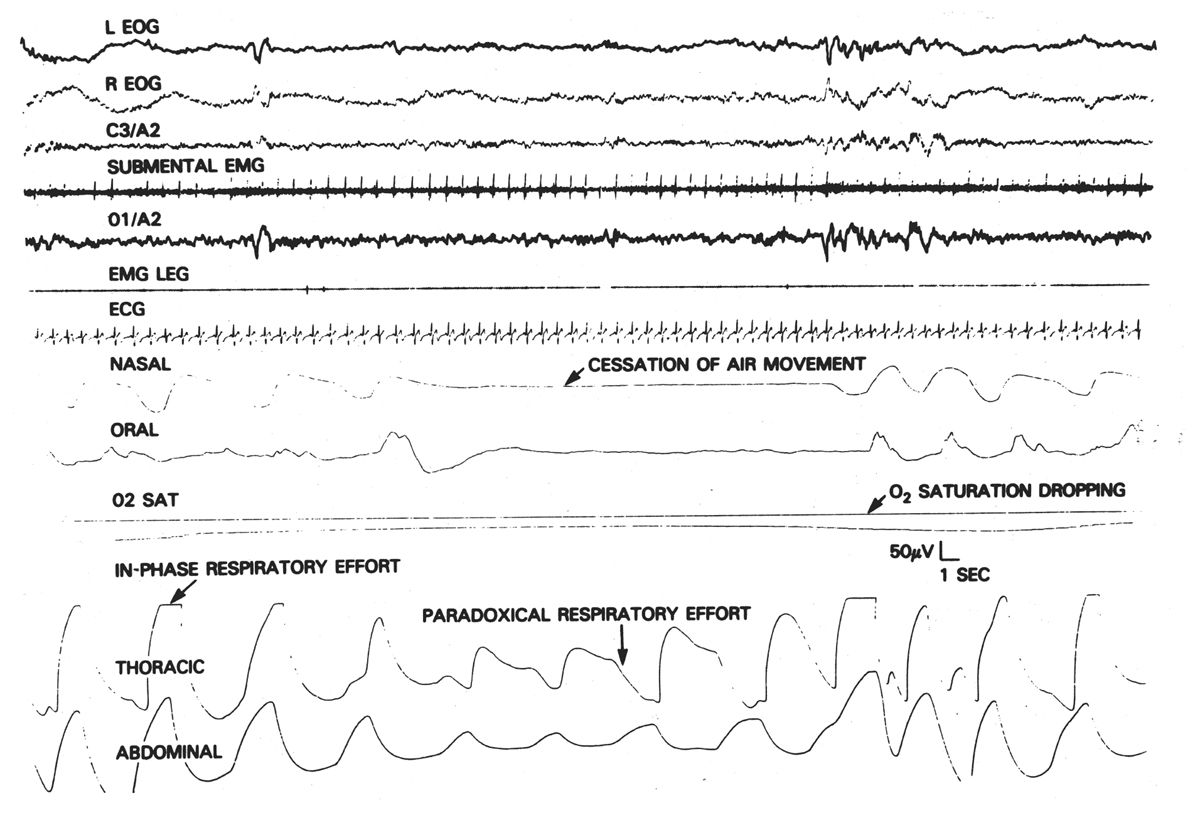
Figure 18.7: Obstructive apnea. Note the development of out-of-phase or paradoxical movement of thoracic and abdominal monitors during period of obstructive apnea. (From Mendelson WB. Human sleep. New York, NY: Plenum Press, 1987:159.)
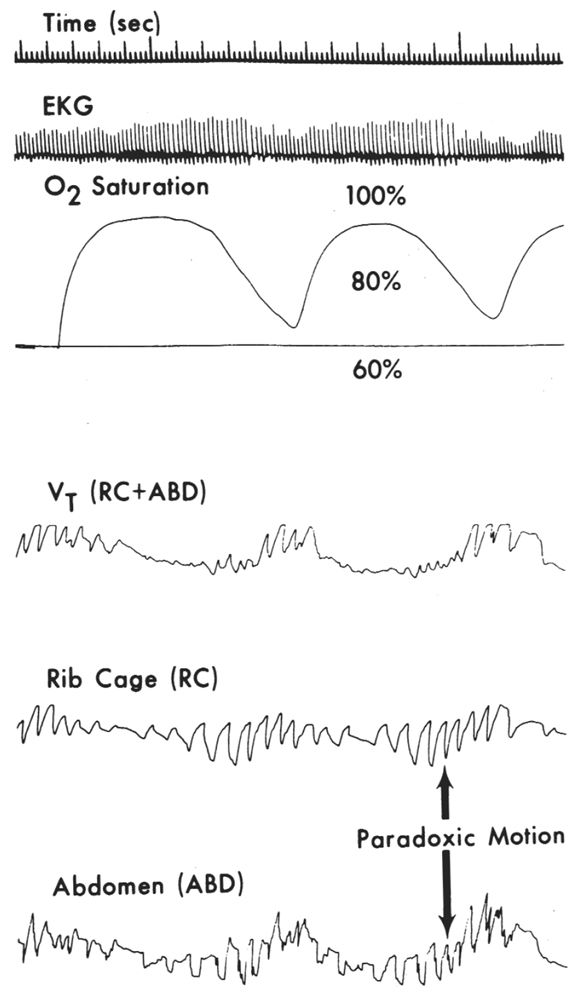
Figure 18.8: Recording demonstrating paradoxical motion of rib cage and abdominal signals along with absence of significant volume signal [VT(RC + ABD)] indicating decreased or absent airflow. Note accompanying oxygen desaturation. (From Cohn M. Respiratory monitoring during sleep: respiratory IP. In: Guilleminault C, ed. Sleeping and waking disorders: indications and techniques. Menlo Park, CA: Addison-Wesley, 1982:213–223.)
Esophageal Pressure Monitors
An esophageal pressure monitor (EPM) can be either a catheter-tip or balloon transducer that is placed through the nose into the distal esophagus (28). The output signal of the pressure/voltage transducer shows absolute pressure (with a DC amplifier) or variations in pressure (with an AC amplifier) on the polygraphic record. EPMs measure pleural pressure swings and are the most accurate devices for assessing ventilatory effort. However, the invasive placement and the inability of many patients to tolerate their use make EPMs less than ideal for routine PSG. However, in difficult cases, intraesophageal pressure measurement can accurately resolve ambiguities as to the nature of the apnea.
Piezoelectric Belts
This device incorporates a piezo crystal element transducer in an elastic belt. When stretched, the piezo crystal element provides a voltage signal proportional to the stress applied. It requires no power and connects simply to the electrode board or input cable. It incorporates good sensitivity to ventilatory effort along with simple and reliable technical application (25).
Intercostal EMG
Intercostal EMG can be recorded using surface electrodes placed in the intercostal space. The technique identifies thoracic ventilatory movements, but it is frequently inadequate in obese patients. While sometimes useful as a complementary technique, intercostal EMG alone is not an adequate index of ventilatory effort.
Arterial Oxygen Assessment
Determination of arterial oxygen desaturation is an important adjunct in assessing the severity of apneic episodes (29–31). Finger pulse oximetry is the technique that is most commonly utilized. It measures oxygen saturation (SaO2) by light transmission through the fingernail bed. SaO2 values obtained from pulse oximetry are continuously recorded on the record. The accuracy of pulse oximetry is compromised by the presence of carbon monoxide, hyperbilirubinemia, O2 saturations below 50%, dark skin pigmentation, or significant hypotension. The AASM guideline requires that the maximum acceptable signal averaging time is 3 seconds. It is important to note that the change in SaO2 associated with a respiratory event appears 20 to 40 seconds after the actual event. Incorporated in the delay are both circulation time to the finger and machine measurement delay.
Electrocardiogram
The ECG is monitored during sleep studies to detect arrhythmias that may be associated with SDB events. Documentation of an associated cardiac arrhythmia can affect treatment decisions in a patient with sleep apnea. In a PSG, the ECG is usually derived from two electrodes placed over the anterior chest wall. This avoids much of the movement artifact seen with the use of limb leads alone. The AASM guidelines recommend the use of a modified ECG Lead II during PSG recordings. This is achieved by placing one electrode in the second intercostal space between sternum and right shoulder and the second electrode in the sixth intercostal space above the left hip. In morbidly obese patients, movement artifact can sometimes be limited by placing this second electrode in the second intercostal space on the left, again halfway to the shoulder. This one channel recording is adequate to monitor heart rate, extrasystoles, and other arrhythmias. However, the differences in recording display, along with the limited derivation, will often not allow adequate assessment of P-wave and QRS abnormalities. If the precise rhythm disturbance cannot be determined from the PSG alone, then independent evaluation using an ambulatory ECG monitor or other dedicated ECG recording device is required. Routine filter settings for ECG are LFF = 0.3 and HFF = 70, with a sensitivity of approximately 50 μV per mm.
Recording Montage
PSG montages are selected depending on the clinical question. For screening studies of patients with possible sleep apnea, PSG variables recorded should include EEG, EOG, axial EMG, anterior tibialis EMG, ECG, airflow, ventilatory effort, and SaO2. A representative montage is outlined in Table 18.1. If there is a more specific clinical question, the montage can be adjusted accordingly. For example, if the primary concern is involuntary motor activity during sleep, additional channels recording arm and leg EMG can be added. To evaluate a patient for possible nocturnal seizures, additional EEG channels are needed (11). Present-day digital machines with expanded channel capabilities (e.g., 32 channels) allow greater flexibility in recording all the usual physiologic variables but also allow a choice of which variables to focus on in review. In general, assessment for nocturnal seizures is best performed using dedicated video-EEG monitoring designed for recording seizures. If sleep laboratory equipment is used for such a purpose, additional channels of EEG accompanied by simultaneous time-locked video are required and should be able to be displayed at 30 mm per second.
Screening PSG Montage
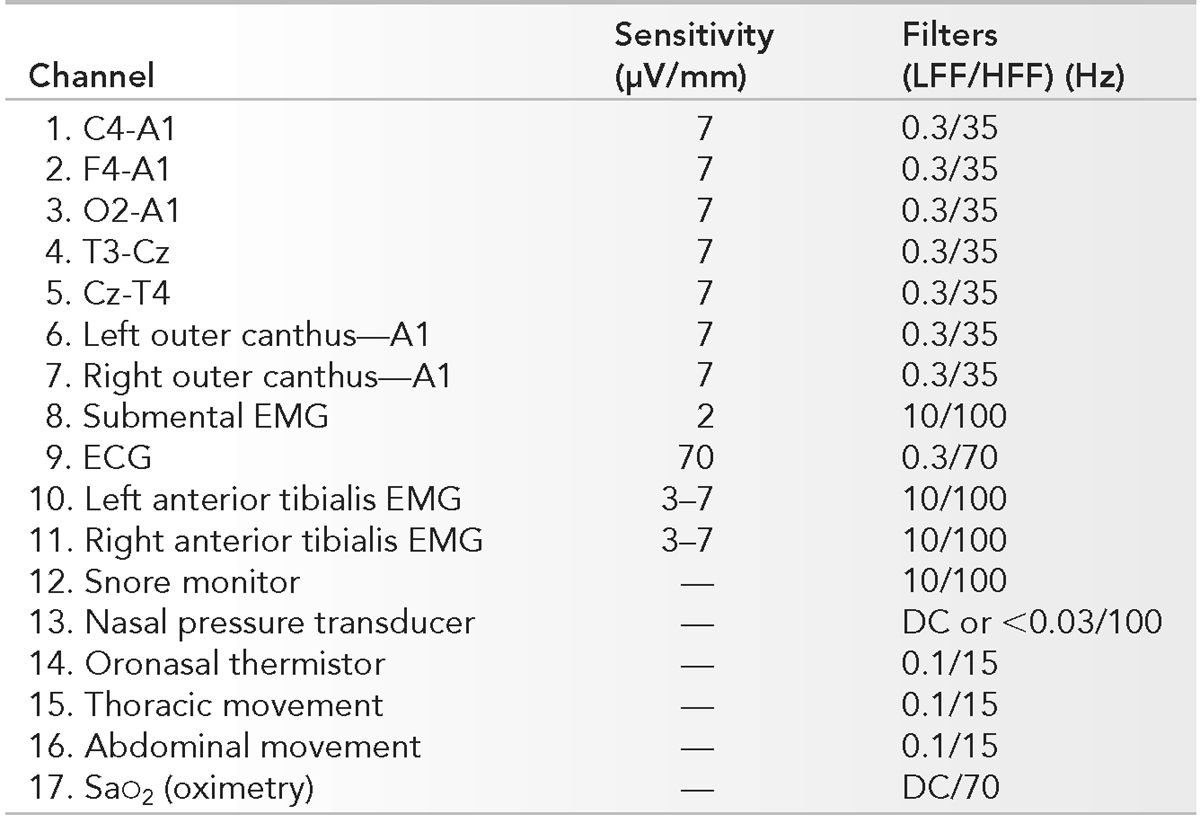
LFF, low-frequency filter; HFF, high-frequency filter; EMG, electromyogram; SaO2, oxygen saturation.
Ambulatory PSG Recording
Historically, ambulatory recording of sleep in the home environment for the evaluation of sleep disorders has not been commonly utilized owing to the inherent limitations of the technique and the lack of third-party reimbursement (32). With the recent CMS (Centers for Medicare and Medicaid Services) approval for coverage and the push to control health-care costs, the role of ambulatory or home sleep tests (HSTs) is being reevaluated and is being used with increasing frequency (33). The various technologies available have been classified into four separate types of sleep studies dependent on what parameters are recorded and whether a technologist is in attendance. In-lab PSG with the recording of seven or more channels and attended by a technologist is the gold standard for the evaluation of sleep disorders and is classified as a type 1 study. A full but unattended PSG (seven or more channels, including the recording of EEG) is classified as a type 2 study. Type 3 studies have four to seven channels and focus on the evaluation of respiratory parameters. Type 3 studies do not record EEG and therefore do evaluate sleep stages, arousals, or sleep duration. Type 3 studies have been the focus in the increasing use of ambulatory HSTs. A type 4 study is a one- or two-channel overnight recording, with at least one of them being oximetry. Type 4 studies have not been demonstrated to be a reliable screen for sleep-related breathing disorders in any patient population (34).
The usual routine for HSTs is for the patient to present to the lab the day of the study. The patient is educated regarding appropriate use of the equipment and placement of electrodes and recording devices. That night, after preparing for bed, the patient places the recording sensors and pushes a button as they get into bed. The button is pressed again upon awakening in the morning and a total recording time is determined. This is supplemented by a brief sleep log from the patient outlining any sustained periods of wakefulness or other important information that may impact on the clinical interpretation of the data. Recorded parameters usually include: nasal/oral airflow, respiratory effort, SaO2, body position, snoring, and heart rate. The studies are scored by automated scoring systems, but the data should be reviewed and edited by a technologist to assure that artifactual information is discarded and that the results represent a reasonable interpretation of the data. From this recording, an estimate of an apnea-hypopnea index (AHI) and oxygen desaturation index is obtained.
The recent guidelines from the AASM for unattended sleep studies outline minimal technical expectations for portable monitoring (35). HSTs should at a minimum record airflow, respiratory effort, and blood oxygenation, and should use the same sensors that are used in the laboratory studies. Accurate data collection is paramount to the successful use of the techniques, so the device should not be used by technologists or physicians that are inexperienced in sleep disorders and their evaluation. The devices must also allow review of the raw data to allow manual scoring and/or adjustment of the automated scoring algorithms.
The advantages of HSTs include lower cost and greater patient accessibility. Patients who cannot access in-lab studies due to lab backlog or physical immobility can be evaluated with a HST. Other patients with irregular or unusual sleep-wake cycles can also have an evaluation that does not have to fit into the usual lab schedule. The primary disadvantage is unreliable or lost data, which may require repeating the test. In addition, the lack of any assessment of sleep stage or quality may lead to a significant underestimation of apnea severity (due to inclusion of prolonged wakefulness) or more importantly, the lack of recognition of hypopneas if significant oxygen desaturations are not present (34).
Because of the obvious limitations, portable or ambulatory sleep studies are not appropriate in many clinical settings. These limitations are recognized by the CMS guidelines as well as those of the AASM. Both bodies agree that the HST may be used as an alternative to in-lab PSG for the diagnosis of obstructive sleep apnea (OSA) in patients with a high pretest probability of moderate to severe OSA. If positive, the caregiver can move forward with therapy for the significant respiratory abnormality. Additionally, HSTs can be helpful after CPAP therapy has been initiated to assess adequacy of treatment if there is a concern regarding response to therapy (33–35).
However, HST is not indicated for use in patients with significant comorbidity (e.g., chronic obstructive pulmonary disease, congestive heart failure, and neuromuscular disease) as the coexistence of these disorders may lead to a greater degree of inaccuracy. HST has not been evaluated in asymptomatic but high-risk individuals such as bariatric surgery patients or commercial truck drivers.
COMPUTERIZED PSG AND COMPUTER-ASSISTED SCORING
Visual sleep scoring has been the gold standard for analyzing sleep, and all subsequent standardizations of sleep scoring have emphasized visual analysis of the PSG (6,9). Any attempt to utilize computerized sleep scoring in clinical sleep studies has attempted to model itself after the visual sleep analysis. While extremely useful for quantifying easily identified events (e.g., oxygen desaturations), computerized scoring’s inability to adjust to hostile “pathologic states” such as frequent apneas, disrupted sleep, and movement artifacts has limited its clinical application. Although much of the commercially available PSG equipment does come with computerized analysis of sleep stage, the clinical standard remains visual scoring by a trained technologist or, at least, the review and overscoring of the computerized sleep staging by a technologist. Similarly, computerized identification of respiratory or movement events also requires review and editing by a technologist.
During the creation of the AASM Scoring Manual, a critical evidence-based look at computerized analysis of PSG was carried out. The consensus of the review suggested that “computer scoring and quantitative analysis is still in the formative stage of development” and have not been proven to be useful in clinical practice (36).
The real strength of computerized analysis of sleep is in its ability to look at sleep as a continuum, rather than the arbitrary definitions provided for identifying N1, N2, N3, and stage R sleep. Similarly, information regarding the microstructure of sleep is likely lost in the use of a 30-second epoch. It will be interesting to explore how computerized analysis may contribute to potential new methods for understanding sleep and its disorders (37).
POLYSOMNOGRAPHY: INTERPRETATION
The clinical interpretation of polysomnographic sleep studies is based primarily on the analysis of three main variables: EEG-related variables (sleep stage, arousals); respiratory-related variables (apneas or hypopneas); and movement-related variables (periodic leg movements). This discussion will focus on the guidelines for the scoring of these variables and the subsequent assignment of clinical significance. The development of the AASM Scoring Manual (and its recent update) has markedly improved the standardization of PSG recording techniques and interpretation, which improves the ability to compare sleep study results obtained in different laboratories (9,10).
Despite the improved standardization, a great deal of uncertainty persists as to the clinical significance of many of the observations noted during PSG recordings. While the International Classification of Sleep Disorders has labeled an AHI greater than 5 as abnormal, a large number of healthy, noncomplaining individuals will have significant elevations of their AHI. Similarly, a movement index of greater than 15 is listed as abnormal, but occurs in many normal subjects, and its clinical significance is unclear. Exactly where one should draw the line in attaching clinical significance to various PSG results remains uncertain. I will provide guidelines in this area based on my own standard of practice, but with the understanding that other experienced practitioners may have different opinions and that these standards are continually evolving.
EEG-Related Variables
Basic Sleep Scoring
In 1968, the publication of the Rechtschaffen and Kales sleep scoring atlas (6) represented the consensus agreement between sleep researchers of the time in an effort to standardize the scoring of sleep stages. It is truly remarkable that our most recent sleep scoring criteria (as published in the AASM Scoring Manual) vary only limitedly from this original document (9,10). The nomenclature of sleep stages has changed from those described in R&K Atlas. NREM stage 1 is now called stage N1, and NREM stage 2 is now stage N2. What had previously been NREM stages 3 and 4 (or slow wave sleep) is now unified into a single Stage N3. Stage REM is now labeled as stage R.
Normal sleep has a clearly defined architecture that is relatively stable from childhood through senescence (38). Sleep onset begins with a transition from wakefulness to stage N1. Stage N1 is normally brief and is followed by stage N2. Stage N3 (slow wave sleep) follows and is usually sustained, especially in children and young adults. Sleep then briefly lightens to stage N2 before an initial brief REM period. This first period of stage R occurs approximately 90 minutes after sleep onset and completes the first sleep cycle. This complete cycle is then repeated three to five times during the night, but the amount of stage N3 diminishes during ensuing cycles, while the amount of stage R increases. Histograms are useful to visually display the ultradian cycle within a night’s sleep (Fig. 18.9) (39).
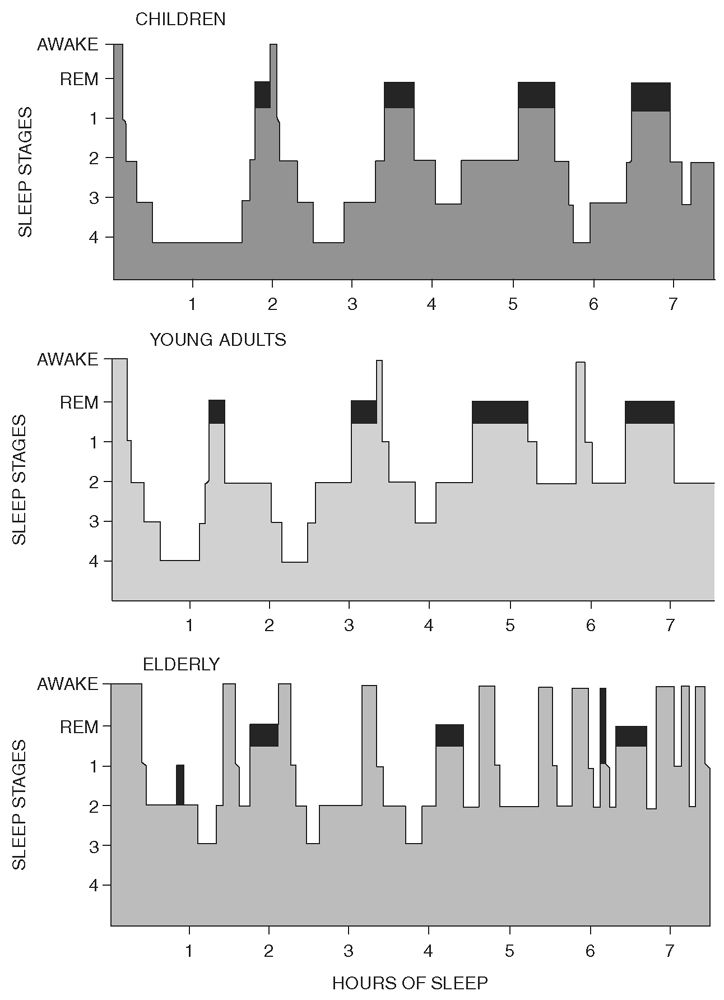
Figure 18.9: Histograms representing normal sleep cycles for age. REM sleep (darkened area) occurs cyclically throughout the night at intervals of approximately 90 minutes. REM sleep shows little variation in the different age groups, whereas stage N3 (labeled here as stages 3 and 4 sleep) can be seen to decrease with age. Note also the frequent awakenings and increase in total wake time seen in the elderly. (From Kales A, Kales J. Sleep disorders: recent findings in the diagnosis and treatment of disturbed sleep. N Engl J Med 1974;290:487–499.)
Stay updated, free articles. Join our Telegram channel

Full access? Get Clinical Tree


