EP can be produced by many types of stimuli. In the routine EP laboratory, however, sensory stimuli are used to obtain EP. The visual system can be stimulated with either flashes of light (flash VEP, FVEP) or a patterned stimulus (pattern reversal VEP, PRVEP). Various types of sounds can be used to stimulate the auditory system to produce auditory EP (AEP). AEP that occur within 10 milliseconds of stimulation are called brainstem auditory EP (BAEP), whereas those occurring after 50 milliseconds are referred to as long-latency AEP. Middle-latency AEP are between the BAEP and the long-latency AEP. BAEP are the most reproducible and used clinically. Further discussion of AEP will focus on BAEP. Peripheral nerves are stimulated with an electrical stimulus to produce SEP. Almost any nerve can be stimulated electrically to produce a SEP; however, most often, it is the median, ulnar, tibial, and peroneal nerves that are used.
Naming Convention
EP are a series of waveforms that are generated by various neural structures in response to a stimulus. These waveforms are named according to their polarity and typical latency or sequential number in which they appear. VEP and SEP waveforms are named according to the polarity/latency method. Thus the P100 of the VEP is a positive waveform that typically occurs at 100 milliseconds, while the N34 is a negative waveform that occurs approximately 34 milliseconds after tibial nerve stimulation. BAEP waveforms I–V are labeled according to the order in which they appear.
Negative and positive polarity waveforms are recorded in all types of EP. Unlike in other types of neurophysiologic tests, which have a convention about negative potentials being displayed upward, EP have no such conventional display. Whether negative potentials are displayed upward or downward is according to preference of the laboratory. Because of this lack of standardization, the display should clearly note the polarity convention used.
EP waveforms are of low amplitude and sometimes difficult to obtain despite optimal technique. Certain waveforms, however, are designated as “obligate” waveforms. This implies that absence of these waveforms is an abnormality. Other waveforms that are not obligate may be absent, yet the study may still be considered normal. Obligate waveforms for each modality are noted in the discussion on that modality.
Waveforms
Each EP has multiple waveforms. These waveforms are produced by various neural structures along the pathway being evaluated. A waveform is typically produced when an impulse travels along a fiber tract or passes through a synapse (1). If a fiber tract abruptly changes direction, that can create a waveform as well. It is tempting to think that each waveform has a single generator; however, it is likely that multiple neural structures contribute to each waveform, and one neural structure may contribute to more than one waveform (2). Despite this, various nuclei and fiber tracts are associated with various waveforms to aid with localization and interpretation.
The various waveforms recorded for each EP can be thought of as near- or far-field potentials. Near-field potentials are those for which the active recording electrode is placed on or very close to the generator site. The reference recording electrode is placed at a distance where the potential of interest is not present. Near-field waveforms can be recorded only from generators that are close to the surface so that an electrode can be placed in close proximity. Consequently, they are very sensitive to recording electrode placement; minor changes in position of the recording electrode can change the amplitude and morphology of these waveforms dramatically. These potentials are of higher amplitude than far-field potentials. Far-field potentials are recorded at a distance from their site of generation. The amplitude and morphology of these waveforms do not change with slight changes in recording electrode location. They are typically of lower amplitude than near-field potentials. BAEP and SEP contain both near- and far-field potentials, while VEP contain only near-field potentials.
Waveforms can also be thought of as cortical, subcortical, spinal, or peripheral. As their name implies, they are generated from the respective areas of the nervous system. Cortical waveforms are near-field potentials that are generated by cortical synaptic activity and thalamocortical projections. Subcortical waveforms are far-field potentials that are usually of low amplitude and generated by various nuclei and fiber tracts. Spinal waveforms are near-field potentials generated by ascending volleys in the spinal cord. Peripheral waveforms are also near-field potentials that are recorded from peripheral nerves.
Stimulation
The stimulation methodology varies depending on the type of EP being obtained. There are some basic principles that are universal. Regardless of how the stimulus for the EP is presented (visual, auditory, or somatosensory), its parameters can be adjusted. Stimulation intensity is adjusted to optimize the response being recorded. The amplitude of the response increases as the intensity increases, though not linearly. This is because of “central amplification” (3). This refers to a greater number of central compared with peripheral nerve fibers activated for each incremental increase in intensity. Thus, all central fibers will be activated before all peripheral fibers, and cortical and subcortical waveforms will reach maximum amplitude before peripheral waveforms. Stimulus duration refers to the time interval for which each stimulus that is applied to the end organ. The longer this time, the greater the degree of stimulation. This will also increase the amplitude of the response and is also subject to central amplification.
The number of stimuli delivered per second is the stimulation rate. The rate should not be an integer of 60 (50 in Europe) as that will make elimination of electrical line artifact very difficult. Typically, the slower the rate of stimulation, the better the morphology, the higher the amplitude, and the shorter the latency of the waveform. However, the slower the rate of stimulation, the longer it takes to obtain the EP. For each type of EP, a compromise rate is used, which produces reliable and reproducible waveforms without taking too much time. The rate of stimulation also depends on the typical latency of the waveforms being recorded. For VEP, the waveform of interest is the P100, which occurs about 100 milliseconds after stimulation. Typically, the recording time after stimulation, or the “analysis time,” should be at least two times the last waveform of interest. Thus for VEP, the analysis time is at least 200 milliseconds, and stimulation rate is 1 to 2 per second (maximum would be 5 per second [1,000 milliseconds / 200 milliseconds]). On the other hand, for BAEP, the last waveform of interest occurs 6 to 7 milliseconds after stimulation. An analysis time of 15 milliseconds is appropriate for BAEP. The typical rate of stimulation for BAEP is between 10 and 50 per second, depending on the application (maximum would be 66.6 per second [1,000 milliseconds/15 milliseconds]).
As implied by the stimulation rate, each stimulus must be delivered repeatedly and averaged to produce a recognizable EP (see later for discussion on averaging). The number of repetitions of the stimulus needed to produce a reliable and reproducible EP is inversely proportional to the amplitude of the response and directly proportional to the noise. Increasing the stimulation intensity and duration can increase the amplitude of the response within limits. Similarly, relaxing the patient and adhering to optimal technical standards reduces the noise. Both of these will result in the need for fewer repetitions. Once a waveform is obtained, it must be replicated to confirm that all waveforms are reproducible. Every EP should be replicated at least once. Repetitions should not be confused with replication.
Recording
As with stimulation, recording parameters vary with the EP modality. Basic principles will be reviewed here. Though various types of electrodes can be used to record EP, most often surface or cup electrodes are used. These are the same types of electrodes that are used for recording electroencephalograms (EEGs). They are usually applied with electrode paste, though at times collodion can also be used. Rarely, needle electrodes can be used, but these are invasive and painful for awake patients. At times, needle electrodes are used in comatose patients in whom EP are being done to evaluate prognosis. The placement of the recording electrodes depends on the type of EP being performed. Interelectrode impedances should be matched and below 5,000 Ω (4).
The amplifier is one of the most important parts of the recording system for all neurophysiologic signals. It has many components, and one of the most important is the differential amplifier. The differential amplifier has two main inputs (G1 or active and G2 or reference) and one output that displays the difference between the two inputs. A third input is the ground. Because the differential amplifier output shows the difference between the two inputs, signal that is present in both inputs will be cancelled out. This is referred to as “common mode” signal. Signal present in only one input will be displayed in the output. The ability of a differential amplifier to reject common mode activity is called the common mode rejection ratio (CMRR). This is defined as “the ratio of the amplifier output produced by a signal applied differentially to amplifier output produced by the same signal when applied in common mode” (1). The CMRR should be at least 10,000:1 at the highest sensitivity of the amplifier (4). If the electrode impedances are high or mismatched, the amplifier’s CMRR will be reduced and more artifact will be present in the recording.
Because EP signals are of low amplitude, often smaller than background noise, they must be averaged to obtain reliable responses (5). Averaging involves adding all the recordings and dividing the result by the number of stimuli. Since the EP is produced at a constant latency and has a constant shape while background noise is by definition random, averaging results in gradual cancellation of the noise and appearance of the EP. As noted earlier, the number of stimuli needed to average to obtain a reliable and reproducible waveform depends on the amplitude of the response and background noise.
In addition to improving the amplitude of the signal of interest and reducing the background noise, filters and artifact rejection can be used to reduce the number of repetitions needed to obtain a reliable EP. Low- and high-frequency filters (LFF, HFF) are used to eliminate waveforms below and above the frequencies of interest. The LFF is set to reduce the amplitude of the frequencies below the lowest frequency of interest; the HFF does the same for high frequencies. Additionally, the 60-Hz filter (50 Hz in Europe) can be used to eliminate electrical line artifact. These analog filters can introduce phase shifts in the waveforms and affect latencies. Consequently, EP should be obtained with filter settings that are consistent with how the filters were set when normative data was acquired. Digital filters are also available on EP machines. Unlike analog filters, digital filters have a very sharp cutoff frequency below or beyond which they filter. In many instances, they do not introduce phase shifts. A special type of digital filtering is called “smoothing.” In this, 3 to 5 consecutive data points are averaged to create one data point. This helps eliminate noise and “smooth” out the waveform (1). Amplifiers also have an artifact rejection feature. This recognizes activity that is greater than a particular amplitude and automatically “rejects” that response, preventing it from being averaged. By excluding such outlying responses, the averaging becomes more efficient. The artifact rejection feature is set to an amplitude that is several times higher than the expected amplitude of the waveform of interest.
Interpretation
Interpretation of EP involves analysis of the presence of waveforms, their latency, amplitude, and morphology. Numeric features of these waveforms are compared with normative data. Ideally, the normative data should be obtained in the same laboratory in which clinical studies are conducted. However, if published normative data are used, methodology used by the reference laboratory must be followed closely.
The first step in interpreting an EP study is identifying the waveforms of interest. These are often tagged automatically based on preprogramed algorithms. Additionally, the technologist labels waveforms and calculates various measurements. When the study is normal, these measurements are often correct, but with abnormal studies, they may be inaccurate. Verification of waveforms is thus always the first step in interpretation.
Waveforms are easy to identify when they are normal, but when they are abnormal, it can be much more complicated. Each EP has its own set of criteria for the identification of waveforms, but a few general principles should be remembered. Presence of waveforms should be established first. Waveforms of higher amplitude are easier to identify, and higher amplitude can be accomplished by increasing stimulation intensity and duration. This is especially true for SEP. However, sometimes intensity may be increased too much and extraneous waveforms may appear. This can happen with BAEP when waveforms beyond wave V appear. At times, a different montage may be necessary to elucidate a waveform that is difficult to identify or appears morphologically different. This may occur with VEP when the P100 waveform appears bifid, and a different montage (MO-Au vs. MO-MF) may resolve the issue.
Latency measurements are the most important parameter measured in EP. These measures are compared with normative data. Two types of latency measures are used, absolute latency and interpeak latency (IPL). The absolute latency, also known as the peak latency, is the latency from stimulus onset to a peak of interest. This is the time taken for the impulse to travel from the end organ stimulated to the presumed generator of the waveform of interest. This measurement includes conduction not only in the central nervous system (CNS) but also in a peripheral nerve before it reaches the CNS. Because of this, absolute latency measurements are not used as much as IPL measurements. The SEP P37 waveform latency measurement is an absolute latency. IPL is the latency between two peaks of interest. By choosing two peaks that arise from the CNS, peripheral conduction can be eliminated from measurement, and the IPL becomes a measure of central conduction. The BAEP wave III–V IPL and various SEP latencies such as LP-P37 are IPL that measure central conduction.
Amplitudes of various EP waveforms are also measured and compared with normative data as well. The same caveats about normative data noted for latency apply to amplitude measurement as well. Two types of amplitude measurements can be obtained. Peak-to-peak amplitude is calculated most often. This is the difference in voltage between two successive peaks. For any given peak, its amplitude can be measured relative to the peak before or after it, that is, ascending or descending limb of peak can be measured. Regardless of how measurements are made, the same technique that was used to obtain normative data should be used. Amplitude ratios can also be used. Here, the amplitude of one peak is compared with that of another peak. An example of this is in BAEP in which the wave V amplitude is compared with wave I amplitude. Additionally, the VEP amplitude of the P100 waveform obtained after stimulation of one eye can be compared with its counterpart obtained after stimulating the other eye. Amplitude abnormalities do not have the same significance as latency prolongations. When they are seen without latency abnormalities, they may be of uncertain clinical significance.
Various other measurements are also obtained with EP. These are related to the modality being tested. For example, for VEP, visual acuity (VA) is tested and noted. Hearing thresholds are noted for BAEP, and peripheral nerve conduction velocities are noted for SEP. It should be remembered that these parameters are not measured under optimal circumstances. For example, with SEP, supramaximal stimulation of the peripheral nerves is not used, and all nerve fibers of the nerve may not have been stimulated. If an abnormality is suspected, more definitive testing should be performed.
There may be considerable variability of EP even when obtained in the same patient at different time points. When patients are more alert, the cortical responses are of higher amplitude (6). This is particularly important in tibial SEP; the response from one side may be obtained with the patient awake, and by the time the other side is tested, the patient may have fallen asleep. The amplitude of the first response may be considerably greater than the second.
Normative Data
EP interpretation involves comparing various measurements with normative data. As noted previously, ideally normative data should be obtained for each modality in every laboratory in which it is performed. This data is obtained by evaluating patients that are disease free. If the data is normally distributed (Gaussian), at least 20 individuals should be tested. If the data is not normally distributed, a greater number of subjects will need to be tested. Both sexes should be included in testing when determining norms. Additionally, extremes of ages may require separate determination of normative data. The upper and lower limits of normal are defined as 2.5 or 3 standard deviations above and below the mean. Details of how normative data are obtained are presented elsewhere (4).
Abnormalities
As noted previously, latency prolongation is the most significant EP abnormality. It implies a lesion in the pathway but is nonspecific for the type of lesion. Prolongation of absolute latency can be due to lesions in the end organ stimulated, peripheral nerves, or the central pathways. Only in VEP is just the absolute latency evaluated. IPL can provide an assessment of central conduction. They are used more often to detect CNS lesions. Some IPL include parts of the peripheral pathway as well. Examples of the latter include BAEP wave I–III IPL and the median SEP EP-P14 IPL. The former evaluates the cochlea and the auditory nerve, whereas the latter evaluates the brachial plexus, dorsal nerve root, and the part of the dorsal column pathway up to the nucleus cuneatus.
Amplitude reduction can be an abnormality as well. This is not considered as significant as latency prolongation. Often the amplitude reduction and latency prolongation occur together. When amplitude reduction occurs without latency prolongation, its significance is uncertain. Amplitude ratios are also evaluated to compare various waveforms within one EP. Amplitude reduction in its most severe form causes loss of waveforms. Depending on which waveforms are absent, this can be a significant abnormality. If one of the obligate waveforms is absent, it is considered a significant abnormality. Technical problems must be excluded before loss of waveform is interpreted as an abnormality. This is particularly important if the first and all subsequent waveforms of an EP are absent. In this situation, it becomes uncertain if the end organ was adequately stimulated. If technical problems or severe disease of the end organ prevented adequate stimulation, latter waveforms and the remainder of the pathway cannot be evaluated.
The morphology of the waveforms is also evaluated. Bifid waveforms can sometimes imply an abnormality. However, unusual morphologies may be due to normal variations as well. The P37 waveform may appear to have an unusual morphology. Because this waveform is thought to be generated at the somatosensory cortex of the foot area near the vertex of the brain, the vector of the waveform may project ipsilaterally, contralaterally, or to the midline, making the waveform highly variable between patients. If an unusual morphology is present without latency and amplitude abnormalities, interpretation of abnormality should be made with caution.
Once abnormalities are identified in an EP, localization of the lesion can be attempted. Often an exact site cannot be determined; rather, two sites may be identified between which the lesion is likely. IPL prolongations are the most useful in identifying the site of abnormality. For example, if the BAEP waves III–V IPL is prolonged and the waves I–III IPL is normal, a lesion in the upper brainstem is likely. Absence of an obligate waveform can also aid in localization. An example is the absence of the median nerve SEP N20 waveform. This is suggestive of a lesion of the hand somatosensory cortex contralateral to the side of stimulation. Various types of EP can be combined to further localize abnormalities. Further localization of abnormalities will be discussed in the relevant discussions of the individual modalities.
VISUAL EVOKED POTENTIALS
VEP are obtained after stimulation of the visual pathway. These responses are unique in that they are large-amplitude responses that can often be seen in an EEG without averaging. Also, unlike other types of EP that contain a mixture of near- and far-field potentials, VEP contain only near-field cortical potentials.
Classification of VEP is based on the method of stimulation used to produce the response. Most often, a checkerboard pattern is used in which the dark and light squares alternate locations, and this provides the visual stimulation. This is known as a PRVEP and is sensitive to lesions in the visual pathway. This type of VEP is performed most often in patients who can cooperate with testing, and reliable normative data is available. A strobe light can also be used to provide a stimulus for VEP, and the response obtained with this type of stimulation is known as an FVEP. FVEP is insensitive for minor lesions and can detect only severe disruptions in the visual pathway. Interpretation is usually simply as present or absent.
PRVEP are further subdivided based on the field of stimulation used to obtain them. Each eye is tested separately, and typically the entire visual field (nasal and temporal halves) is stimulated simultaneously. This is known as full-field stimulation and is most useful for detecting prechiasmatic lesions. The nasal and temporal half fields can be tested separately, and this is called hemifield stimulation. Hemifields can be tested one eye at a time, or congruous hemifields of both eyes can be tested together (monocular or binocular hemifields). Hemifield stimulation is used for detecting chiasmatic and postchiasmatic lesions. Since these lesions can be detected with neuroimaging, hemifield stimulation is now seldom performed.
Anatomy and Waveform Generators
The visual pathway begins at the retina. Images are inverted on the retina as light crosses behind the lens. Thus, light from the temporal visual field is reflected on the nasal aspect of the retina, and light from the superior visual field is reflected on the inferior aspect of the retina. The retina contains two types of photoreceptor cells, cones and rods. Cones detect color vision in bright light, whereas rods function better in dim light. While rods are found at the periphery of the retina, cones are concentrated toward the center. The posterior aspect of the retina is called the macula, and the center of the macula is the fovea. The fovea has the highest concentration of cones and is the area of highest VA. This area represents the central 3° of vision. Cones and rods project to bipolar cells that project to ganglion cells. Axons of the ganglion cells make up the optic nerve. The retina and the optic nerve are considered a part of the CNS, and the optic nerve is wrapped in a central myelin sheath. A disproportionately large number of fibers in the optic nerve arise from the macula, and consequently, the macula has a disproportionately large representation in the visual cortex.
Optic nerve fibers are arranged according to their site of origin in the retina. Fibers from the nasal retina are present medially, while those from the temporal retina are present more laterally. As the two optic nerves meet at the optic chiasm, fibers from the nasal retina decussate to the other side, while fibers from the lateral retina remain ipsilaterally. The contralateral nasal retina fibers join with ipsilateral temporal retina fibers to create the optic tract. Nerve fibers of the optic tract travel to and synapse in the lateral geniculate nucleus. From there, the optic radiation projects to the occipital cortex. Fibers from the contralateral visual field project to the tip of the temporal horn of the lateral ventricle before projecting back to the occipital cortex. This is known as the loop of Meyer. The optic radiation enters the primary visual cortex in the occipital lobe. Almost one-third of the area of the primary visual cortex is devoted to fibers from the fovea. The area representing the fovea and macula wraps around the posterior aspect of the occipital cortex and extends to the medial surface. Because of this medial projection, the VEP vector projects to the contralateral hemisphere. However, there is considerable anatomic variability of the exact location of projection of the optic radiation fibers, and consequently, projection of the VEP vector (7).
The VEP has a single important waveform that is positive in polarity, has an average latency of 100 milliseconds, and is known as the P100 waveform. This waveform is preceded and followed by lower-amplitude negative peaks at approximately 75 and 145 milliseconds, called the N75 and N145 waveforms. All three of these waveforms are recorded from electrodes placed on the occipital area of the scalp. An electrode on the frontal area records a negative potential at 105 milliseconds called the N105. A recording derivation linking these occipital and frontal electrodes may produce a higher-amplitude P100 waveform as it will take advantage of not only the positive potential from the occipital cortex but the negative one from the frontal region.
All VEP waveforms are thought to have cortical generators. The N75waveform is thought to arise from the striate cortex, while the P100 waveform seems to be generated from the extrastriate cortex. The lateral occipital, occipitoparietal, and temporoparietal cortices produce the N145 waveform (8–10). The N105 waveform appears to arise from the prefrontal cortex (11).
A large component of the generator of the P100 waveform is the extrastriate cortex along the mesial aspect of the occipital cortex. When this area is activated, the VEP vector projects to the contralateral side. For example, activation of the nasal aspect of the left retina results in the activation of the right visual cortex, and the VEP is best recorded over the left hemisphere. Full-field activation of one eye leads to the activation of both visual cortices. Since the VEP vector projects contralaterally for both eyes, the waveform is best recorded over the midline. The exact projection of the VEP vector is variable between patients, some projecting more laterally while others project more medially, superiorly, or inferiorly.
Pattern Reversal Visual Evoked Potentials
Full-field PRVEP are the type of VEP performed most often and provide the most useful clinical information. In this section, the technique for obtaining and interpreting PRVEP will be discussed. PRVEP obtained with hemifield stimulation are infrequently performed.
Methodology
The stimulation and recording techniques have a significant impact on VEP. It is especially important to adhere to the methods used in obtaining normative data when performing clinical studies.
Stimulation
The method in which the stimulus for PRVEP is presented can greatly affect the latency and shape of the response. Patient and stimulus variables are important to consider.
Patient cooperation is essential in obtaining a PRVEP. The patient must be alert and seated comfortably. VA should be measured and corrective lenses, if used, should be worn. The latency of the P100 waveform can be affected if VA is not corrected (Fig. 15.1). Each eye is successively stimulated, while the other eye is covered to obtain a full-field PRVEP. The patient is instructed to look at the center of the stimulus. The technologist must watch the patient’s eye to confirm that he/she keeps looking at the stimulus. Looking away from the stimulus or intentionally defocusing the image by the patient will affect the response.
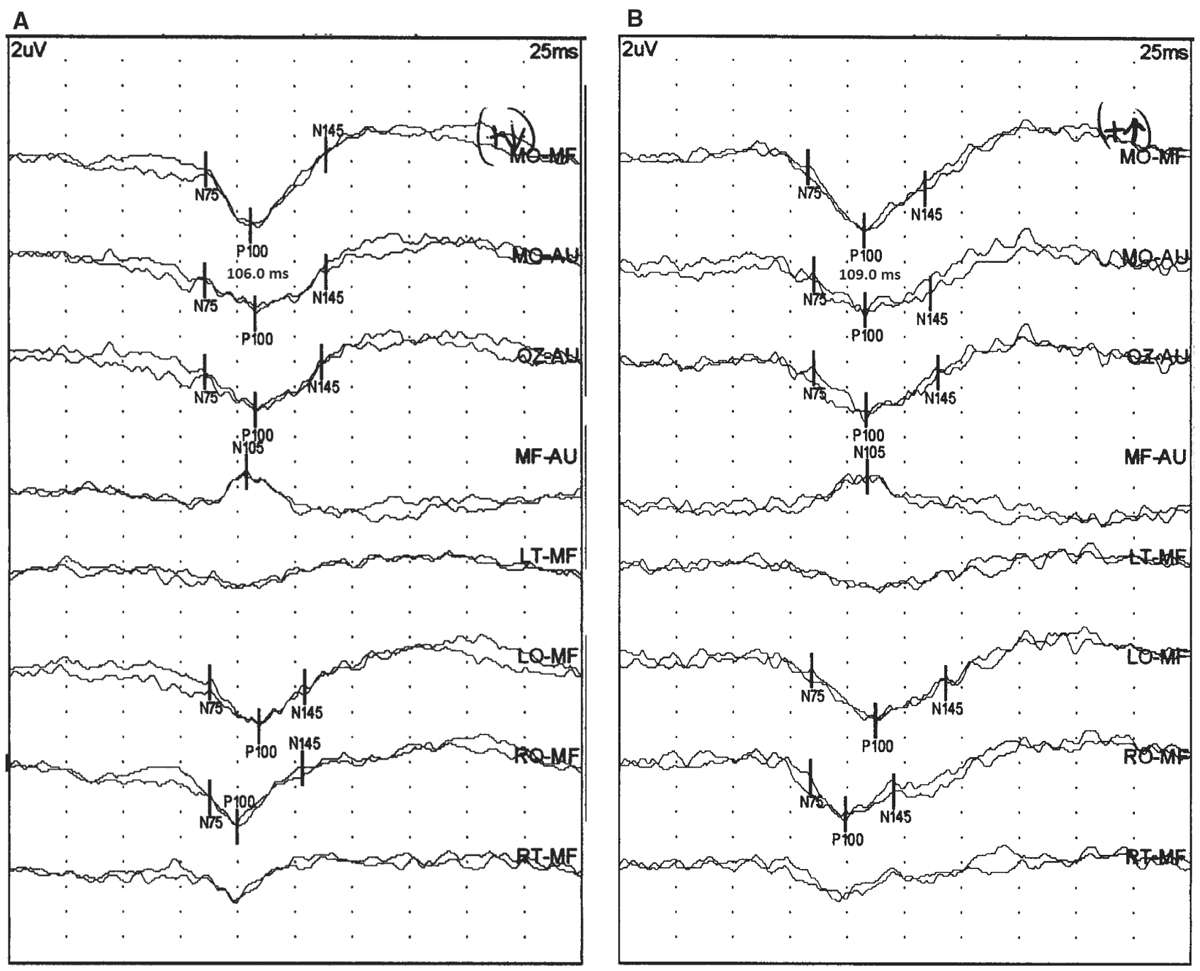
Figure 15.1: PRVEP obtained from the right eye of a 41-year-old patient with (A) and without (B) corrective lenses. The VA was 20/20 with corrective lenses and 20/50 without corrective. Notice that the P100 latency increases from 106 to 109 milliseconds without corrective lenses. (©AMH.)
Several stimulus variables are important to consider as well. The stimulation rate should be between 1 and 4 per second. Since the last peak of interest in a PRVEP is the P100, the minimum analysis time should be 200 milliseconds. This means that the fastest rate possible would be 5 per second. Slower stimulation rates result in more reliable responses with the shortest latencies, highest amplitudes, and best morphologies. However, slow rates take more time to complete an average, and this may lead to loss of attention or defocusing on the checkerboard pattern. This will result in the prolongation of latency and worsening morphology. A common rate used that balances both of these competing issues is 1 to 2 per second.
The luminance, or brightness, of the screen on which the stimulus is presented and the contrast between the dark and light squares are related, and both can affect the PRVEP. Luminance can be measured with a photometer. With very low luminance and contrast between the checks, the latency and amplitude will be affected. However, once the contrast between the dark and light checks exceeds 40%, further changes in PRVEP measures are slight. For most clinical studies, the contrast is kept between 95% and 99%. It is important not to change the luminance of the screen after normative data has been obtained and to check it periodically to make certain that it remains stable.
The checkerboard stimulus is presented on a computer screen. Most laboratories obtained normative data using cathode ray tube (CRT) monitors to present the stimulus. These displays are becoming less available and are being replaced by liquid crystal display (LCD) monitors. The manner in which both of these screens refresh is different, with the LCD being considerably slower. Using even the fastest LCD monitors can result in considerable prolongation of P100 waveform latency (Fig. 15.2) (12). CRT monitors should not be replaced with LCD monitors without recollecting normative data.
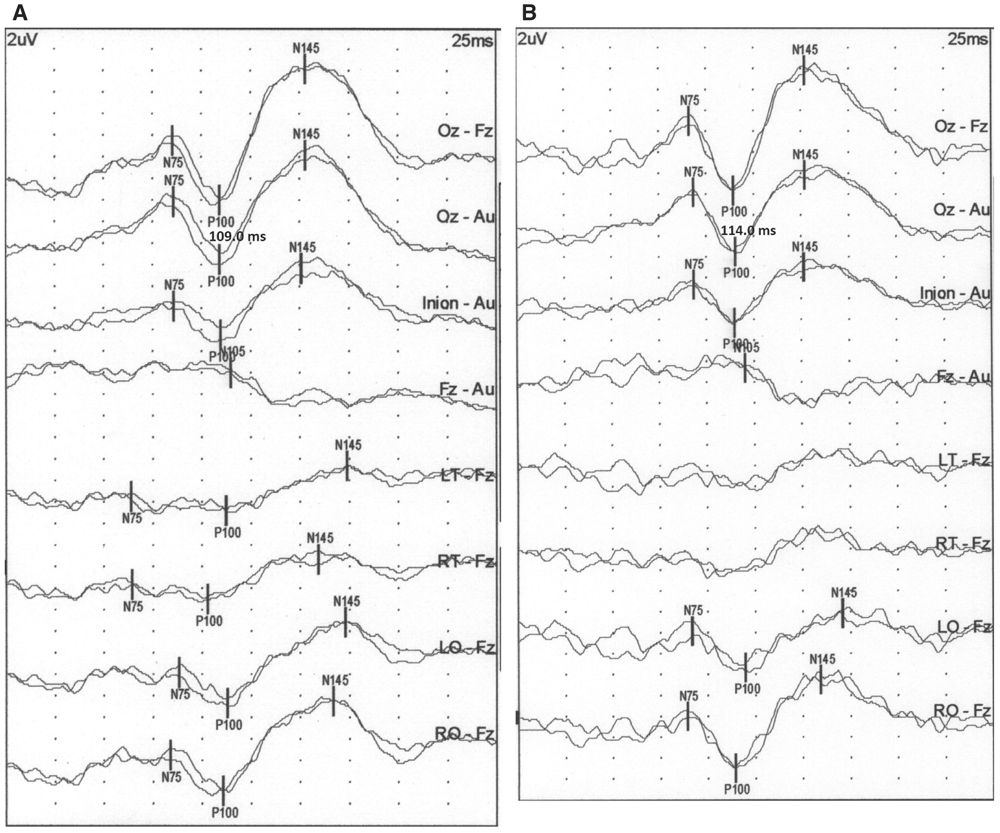
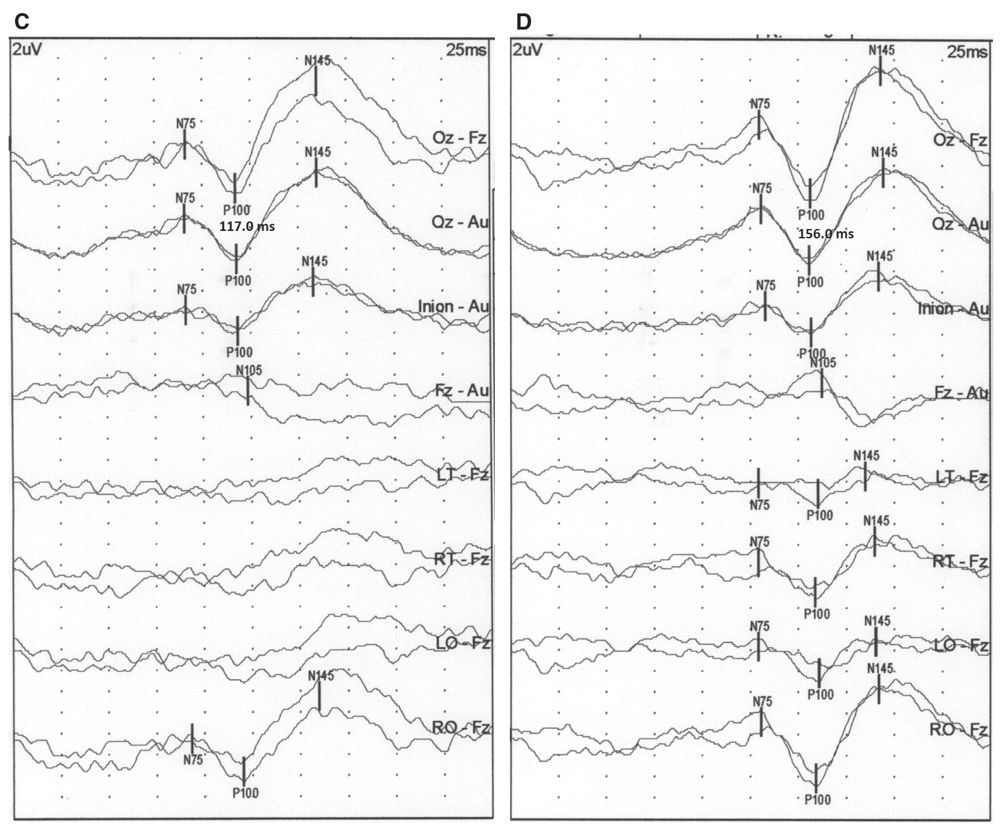
Figure 15.2: PRVEP obtained from the right eye of a neurologically normal subject using a CRT monitor (A), LCD monitors with 2 milliseconds (B), 8 milliseconds (C), and 30 milliseconds (D) refresh rate. The P100 latency changes from 109 milliseconds with the CRT monitor to 114 milliseconds for the 2 milliseconds, 117 for the 8 milliseconds, and 156 for the 30 milliseconds refresh rate LCD monitors. (©AMH.)
The size of the squares of the checkerboard has a major impact on the PRVEP waveform. The visual angle is the measure of the size of the image of the square created on the retina, and is expressed as “a/b,” where “a” is the check size and “b” is the distance from the eye. Thus, larger check sizes increase the visual angle, and increasing the distance decreases the visual angle. Check sizes are expressed in minutes of arc of the angle (1° = 60 minutes). Common check sizes used are 15′, 30′, and 60′. The smaller check sizes stimulate the central retina and fovea, whereas larger check sizes stimulate more of the peripheral retina. Smaller check sizes produce shorter latency waveforms as the fovea is selectively stimulated. However, if the check becomes too small and the distinction between the dark and light squares begins to blur, the latency starts to prolong. The smallest check size that can be readily distinguished should be used. Often this is 30′ visual arc, but with poor VA, it may be 60′ and 15′ for individuals with excellent vision.
Recording
Recording techniques can affect the PRVEP waveform as well. There is some variability in recording methods, particularly in recording electrode positions. The number of channels used is also variable.
Recording electrode placement is not standardized for PRVEP. Many laboratories use the “Queen Square” method in which electrodes are placed at a fixed distance from anatomical landmarks. Alternatively, the International 10–20 system for electrode placement can also be used. The recording electrodes used and their labeling according to the Queen Square system is presented in Table 15.1. The corresponding International 10–20 system electrode positions are also noted. These electrode locations are also presented visually in Fig. 15.3. Notice that the Queen Square electrodes along the posterior aspect of the head are at a slightly higher plane than the International 10–20 system electrodes. In most patients, electrodes placed according to the Queen Square method provide better PRVEP morphology and higher amplitude (13).
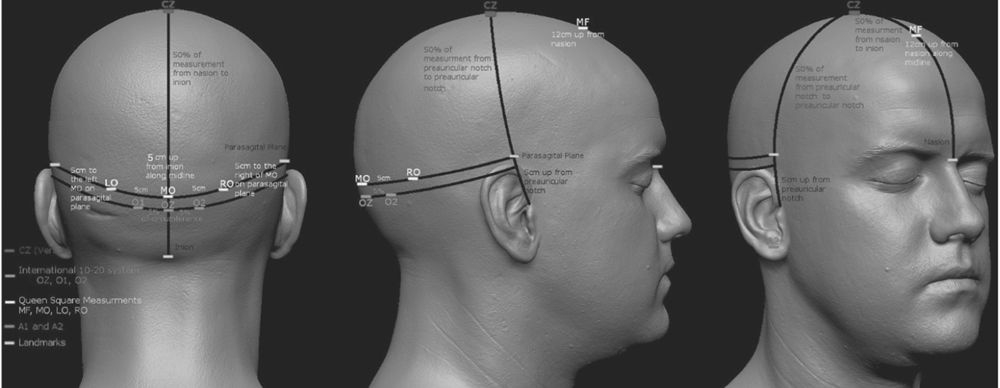
Figure 15.3: Graphic representation of the PRVEP recording electrodes; both Queen Square and International 10–20 system locations are noted. (Adapted by Kale E, CNIM from http://www.ir-ltd.net/uploads/posts/Infinite-ZB_Shots.jpg. ©EK/AMH.)
PRVEP Recording Electrodes
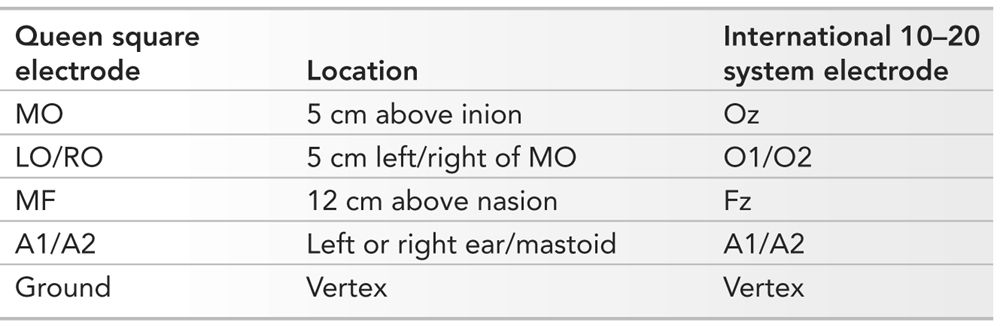
MO, midoccipital; LO/RO, left and right occipital; MF, midfrontal; A1/A2, left and right ear/mastoid.
A four-channel montage is recommended for obtaining PRVEP (13). This recommended montage is presented in Table 15.2. Often, additional channels are added if the morphology is unusual and needs to be better defined. An additional channel that is often added is the MO-Au (both ears).
PRVEP Recording Montage Recommended by the ACNS
Channel 1 | LO-MF |
Channel 2 | MO-MF |
Channel 3 | RO-MF |
Channel 4 | MF-A1 |
LO, left occipital; MF, midfrontal; MO, midoccipital; RO, right occipital; A1, left ear.
American Clinical Neurophysiology Society. Guideline 9B: guidelines on visual evoked potentials. J Clin Neurophysiol 2006;23(2):138–156.
The amplifier filters are set to 1 to 100 Hz, and the analysis time is set at 200 to 250 milliseconds since the last peak of interest is the P100. Because the P100 waveform is usually of high amplitude, many repetitions do not need to be averaged. Typically, a reproducible response is seen after 100 to 200 repetitions. Since there is no standardized polarity convention, the P100 waveform can be displayed upward or downward. Whichever way it is displayed must be clearly marked.
Interpretation
Interpretation of PRVEP involves determining the presence of expected waveforms. The P100 waveform is the most important of these waveforms and is identified as the prominent positive potential in the occipital electrodes. The N75 and N145 waveforms precede and follow the P100 waveform and are also best recorded from the occipital electrodes. The N105 waveform is a small response noted in the frontal region.
The MO-MF derivation is often the best for recording the P100 waveform. It takes advantage of the positive potential in the occipital region and the negative potential in the frontal region, which occur at about the same latency, thus maximizing the amplitude of the P100 waveform. The MO-Au derivation typically has a P100 waveform that is lower in amplitude, but it is a better reflection of the true amplitude of this waveform since it does not have the N105 waveform contribution. The MF-Au derivation shows only the N105 waveform as that is the only potential recorded from the frontal region. The parasagittal derivations, LO/RO-MF, are useful for demonstrating the activation of one occipital cortex, and their symmetry helps establish equal activation of both occipital cortices, as would be expected in a normal full-field PRVEP (Fig. 15.4).
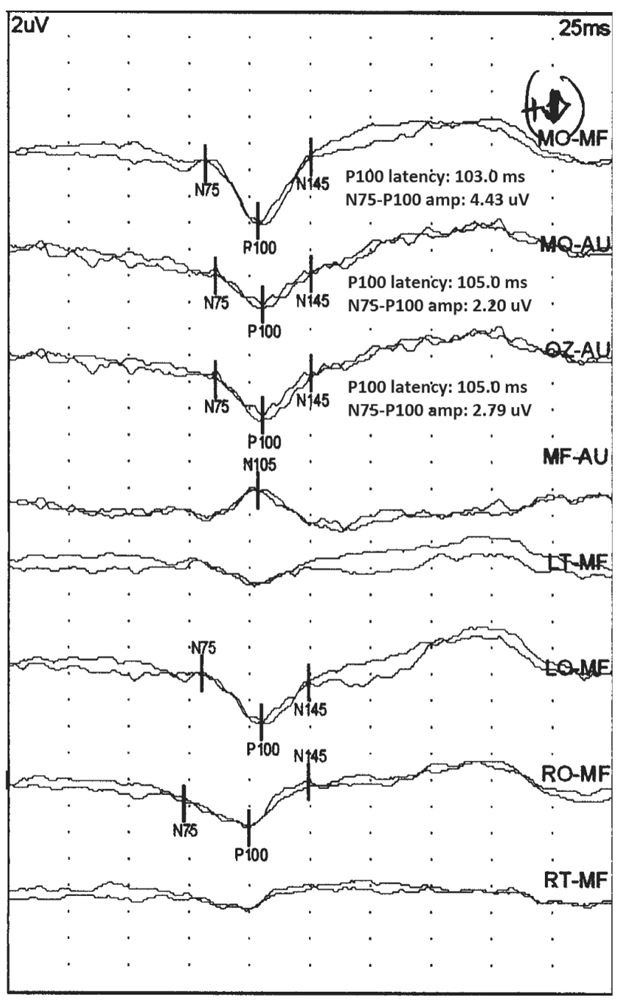
Figure 15.4: Normal PRVEP obtained with stimulation of the left eye of a 25-year-old patient. Notice that the highest amplitude P100 is present in the MO-MF derivation. The amplitude is slightly smaller in the MO-Au derivation. In these two derivations, the N75 and N145 are also seen. The N105 is seen in the MF-Au derivation. The LO/RO-MF derivation show symmetric P100. (©AMH.)
The P100 waveform latency is the most important parameter to measure in the PRVEP. Laboratories differ on how this is measured. Most often, the peak latency to the P100 waveform in the MO-MF derivation is noted. If the P100 waveform is better visualized in the MO-Au derivation, it can be used instead. The typical latency of this waveform is between 90 and 115 milliseconds (1). The latency should be compared with normative data. Normative data may be adjusted on the basis of head size. Head size is measured from the preauricular point on one side to the preauricular point on the other side (P–P distance). Alternatively, some laboratories may have separate norms for females and males. Sample normative data from the author’s laboratory for various head sizes is presented in Table 15.3. In addition to determining the peak latency, the latency difference between the P100 waveform obtained after left and right eye stimulation is also determined. Even if both are within normal limits but are asymmetric, the study is considered abnormal. In the author’s laboratory, a latency asymmetry greater than or equal to 8 milliseconds is considered abnormal.
PRVEP Normative Data from the Author’s Laboratory
P–P (cm) | Latency (ms)a |
30 | 106.5 |
31 | 107.5 |
32 | 109.0 |
33 | 110.0 |
34 | 111.0 |
35 | 112.0 |
36 | 113.5 |
37 | 114.5 |
38 | 116.0 |
39 | 117.0 |
40 | 118.5 |
Stimulation rate approximately 4 per second.
Interocular latency asymmetry less than 8 milliseconds.
Interocular amplitude asymmetry (larger/smaller) less than 2.0.
Parasagittal amplitude asymmetry (larger/smaller) less than 2.5.
a Latency values least square fit + 3 SEM.
Amplitude of the P100 waveform is also measured; however, it is less important a measurement than the latency. The N75–P100 or the P100–N145 peak-to-peak amplitude is measured, or the average of the two is noted, per protocol of the laboratory. Rather than the amplitude serving as an absolute measure of abnormality, the P100 waveform amplitudes after left and right eye stimulation are compared. In the author’s laboratory, an interocular amplitude ratio greater than or equal to 2.0 is considered abnormal. The side with the lower amplitude is abnormal.
The morphology and topography of the P100 waveform is important to analyze as well. As noted above, the normal P100 waveform consists of a large positive wave preceded and followed by smaller negative waves. Various derivations can be used to better visualize the morphology of the P100 waveform. The amplitude of the P100 waveform in the parasagittal derivations (LO/RO-MF) is also noted. In the author’s laboratory, the interhemispheric P100 waveform amplitude ratio should be less than 2.5. The side with the lower amplitude is abnormal.
Abnormalities
Abnormalities of the P100 waveform can be in latency, amplitude, morphology, and topography. Latency abnormalities are the most significant, but the others are important as well, particularly in identifying lesions of the optic chiasm and optic tracts. Latency abnormalities are either prolongations of the P100 waveform latency beyond the upper limit of normal or a side-to-side asymmetry. The side with the longer latency is abnormal. Unilateral P100 waveform latency prolongation is most consistent with a prechiasmatic lesion on the side of the stimulated eye. Bilateral latency prolongations are harder to localize and may be prechiasmatic, chiasmatic, or postchiasmatic. Analyzing the topography and morphology of the P100 waveform distinguishes between these possibilities.
Amplitude abnormalities in their most severe form result in complete loss of the P100 waveform. Alternatively, abnormally low-amplitude or side-to-side amplitude asymmetry may be present. Unilateral loss of waveform is most likely due to a prechiasmatic lesion. Prior to attributing an absent waveform to pathology, technical issues causing an absent waveform must be ruled out. Unilaterally low amplitude is the same as a high side-to-side amplitude ratio. A unilaterally low-amplitude and prolonged latency P100 waveform is also most likely due to a prechiasmatic lesion. When the amplitude is low and latency is normal, an ocular abnormality should be considered. Bilaterally low amplitude of the P100 waveforms is of uncertain clinical significance. This pattern can, however, be seen with prechiasmatic, chiasmatic, or postchiasmatic lesions.
The morphology of the P100 waveform can be abnormal, but if that is the only abnormality, the clinical significance is uncertain. The most common abnormality is the “W-shaped” P100 waveform, and there are several reasons why this may occur (Fig. 15.5). Neither peak of the “W” should be considered the true P100 waveform, and an attempt should be made to identify the correct P100 peak. Typically, the W-shaped waveform is seen in the MO-MF derivation. The P100 waveform in this derivation has contributions from the P100 positive potential over the occipital region and the N105 negative potential over the frontal region. If the latencies of the P100 and N105 waveforms are substantially different, the P100 waveform in the MO-MF derivation has a W-shaped morphology. In this situation, the MO-Au derivation should be analyzed to see whether a single-peak P100 can be identified. Sometimes a W-shaped waveform results due to activation of too much of the peripheral retina. Central retinal and foveal fibers conduct impulses faster than peripheral retinal fibers. Thus, excessive peripheral retinal activation results in the PRVEP arriving at the occipital cortices at different times, resulting in the bifid shape of the P100 waveform. More focused stimulation of the central retina with a smaller check size may improve the morphology. Retinal diseases may result in abnormal activation of fibers from the central retina, resulting in an abnormal P100 waveform shape. Use of hemifield stimulation may correct this problem.
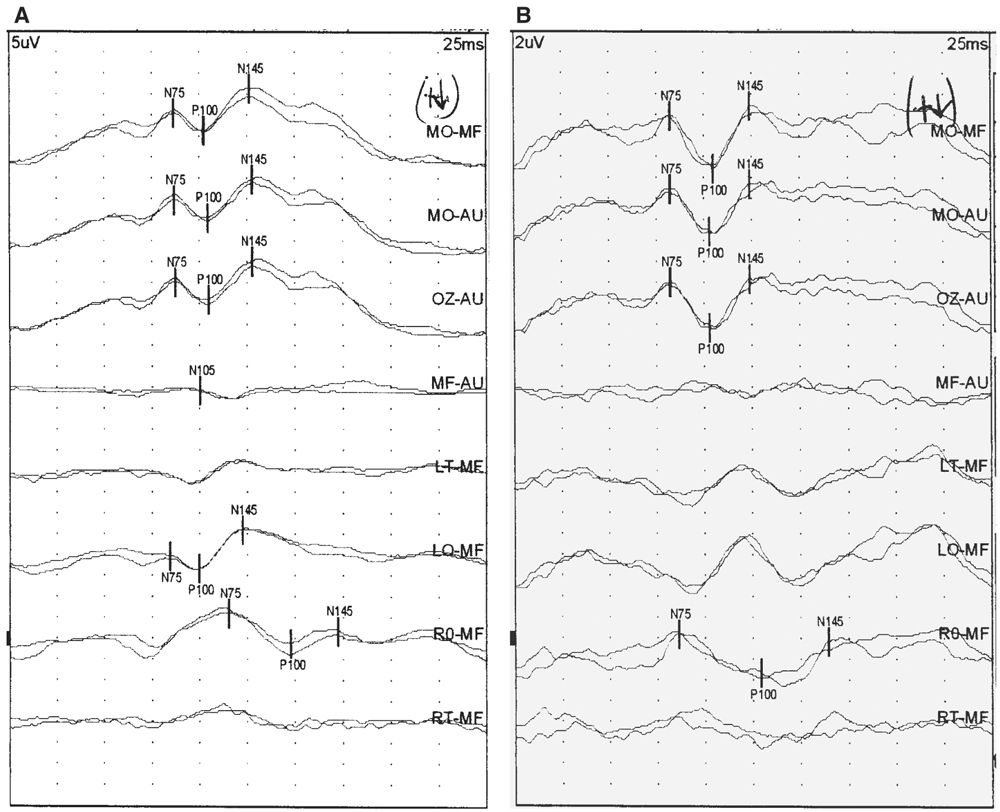
Figure 15.5: PRVEP obtained after stimulation of the left eye of a 46-year-old patient. A was obtained with 60-minute check size. Notice the “W-shaped” waveform. Stimulation with a 30-minute check size (B) improved the morphology. (©AMH.)
Topographic analysis of the PRVEP involves comparing the P100 waveform amplitude in the parasagittal (LO/RO-MF) derivations after stimulation of each eye. If the interhemispheric P100 waveform amplitude ratio is greater than or equal to 2.5, it is suggestive of a chiasmatic or postchiasmatic lesion. The side with the lower amplitude is the abnormal side. If after stimulation of both eyes, one side consistently has the lower amplitude (i.e., LO-MF has lower amplitude than RO-MF after full-field stimulation of both left and right eyes), this is known as an “uncrossed asymmetry” and implies a postchiasmatic lesion contralateral to the side of the low amplitude (i.e., right postchiasmatic abnormality in the example mentioned earlier) (Fig. 15.6). Recall that the P100 waveform seen in the LO-MF derivation is a reflection of the activation of the right occipital cortex and vice versa. Alternatively, if the side with the lower P100 waveform amplitude changes after stimulation of the left and right eyes (i.e., LO-MF has a lower amplitude after stimulation of one eye and RO-MF has a lower amplitude after stimulation of the other eye), that is known as a “crossed asymmetry” and implies a chiasmatic lesion. A graphic summary of topographic analysis is presented in Fig. 15.7. When a chiasmatic or postchiasmatic lesion is suspected based on topographic abnormalities of the P100 waveform, further testing should be done to confirm this. This may be in the form of hemifield stimulation or other types of imaging. Neuroimaging is sensitive in detecting these lesions and is often preferred over VEP obtained with hemifield stimulation. Thus, hemifield testing is seldom performed clinically, and will not be discussed further in this chapter.
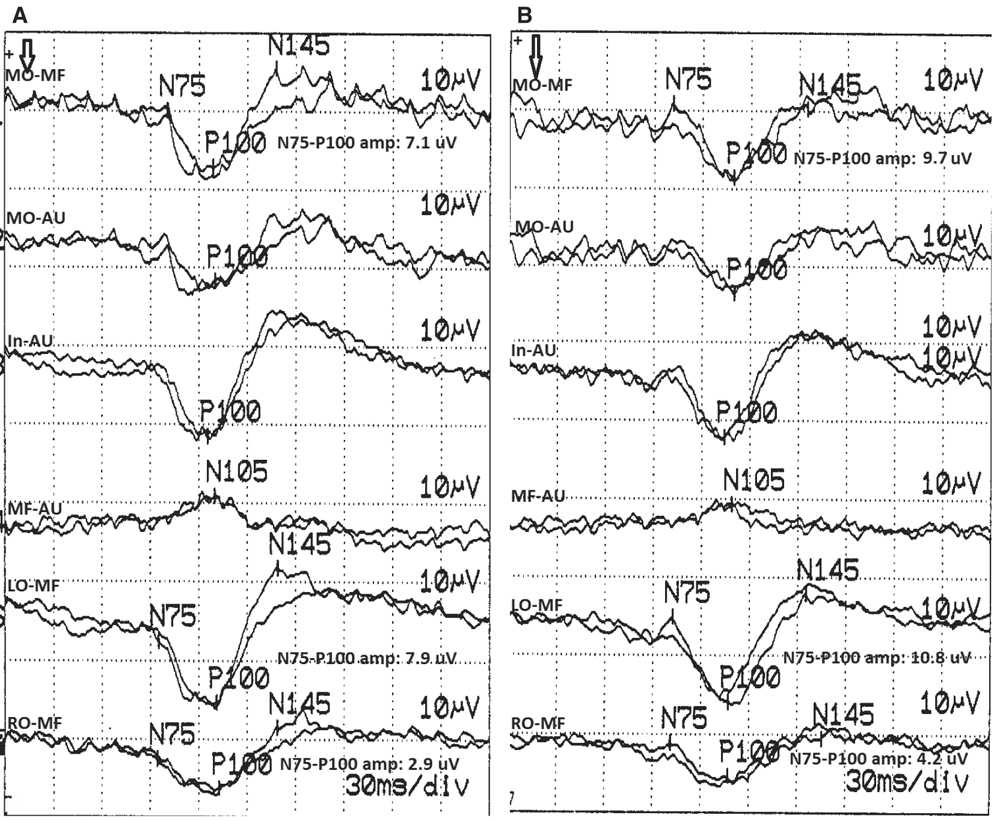
Figure 15.6: PRVEP obtained after stimulation of the left (A) and right (B) eyes of a 74-year-old patient. This study shows an “uncrossed asymmetry” of the parasagittal P100 waveforms. The P100 waveform seen in the RO-MF derivation after stimulation of both eyes has lower amplitude than the P100 waveform seen in the LO-MF derivation. The LO/RO amplitude ratio after left eye stimulation (A) is 2.7 and after right eye stimulation (B) is 2.6. Both of these are abnormal, implying a left hemisphere/optic radiation lesion. The left to right eye MO-MF amplitude ratio is 1.4, which is normal. (©AMH.)
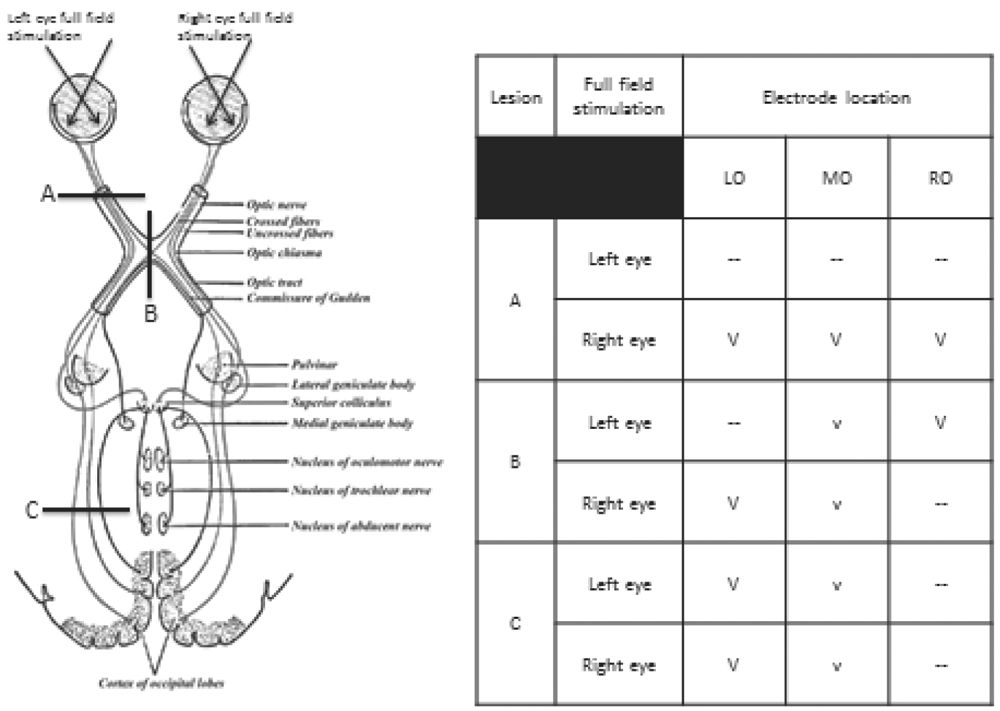
Figure 15.7: Graphic representation of interpretation of amplitude and topographic abnormalities of the PRVEP. Lesion A is at the left optic nerve, lesion B is at the optic chiasm and lesion C is in the left optic radiation. The table shows the amplitude and topography of the P100 with left and right eye full-field stimulation with each of these lesions. See text for details. V, normal amplitude P100; v, low amplitude P100; —, absent P100; LO/MO/RO, left, middle, right occipital. (©AMH.)
Flash Visual Evoked Potentials
FVEP are obtained in situations where PRVEP are not possible. This is the case in very young children or other patients who cannot maintain focus on a checkerboard pattern or patients whose VA is so poor that they cannot differentiate between the dark and the light squares. Differences between FVEP and PRVEP will be highlighted in this section.
Methodology
A bright, noncolored light flash is used as the stimulus for FVEP. This is produced with either light emitting diode (LED) embedded in goggles worn by the patient or a strobe lamp. LED goggles are preferred as they are placed over the patient’s eyes and do not require any cooperation from the patient. The patient’s eyes may be open or closed. If a lamp is used, the patient is encouraged to look in the direction of the lamp, and this should be monitored by the technologist. Stimulation frequency is 1 to 2 per second.
The recording montage is simpler than that used for PRVEP. Often a single derivation is used, MO-Au (13). If a response is not seen in this derivation, others such as LO-Au, RO-Au, or vertex-Au can be considered. Filter settings and analysis time settings are the same as for PRVEP. The response is usually of high amplitude and relatively few repetitions are needed to generate a reliable response. Each response must be replicated, however.
Interpretation
Several peaks are seen in a FVEP. The first three peaks are best seen over the occipital cortex, whereas subsequent ones are better seen over the vertex. A positive peak occurring between 50 and 100 milliseconds is the most prominent peak and is called the P1 (14). A negative peak may precede and follow this positive peak, and these are referred to as N1 and N2 (Fig. 15.8). All of these peaks are highly variable within and between patients. Alteration in alertness can affect the latency and amplitude. Because of the variability of the latency and amplitude of the FVEP, most laboratories do not compare latencies of P1 responses with normative data. Rather, FVEP are interpreted simply as being present or absent. The P1 latency and amplitude can be compared between left and right eye stimulation, but any asymmetry should be evaluated very cautiously.
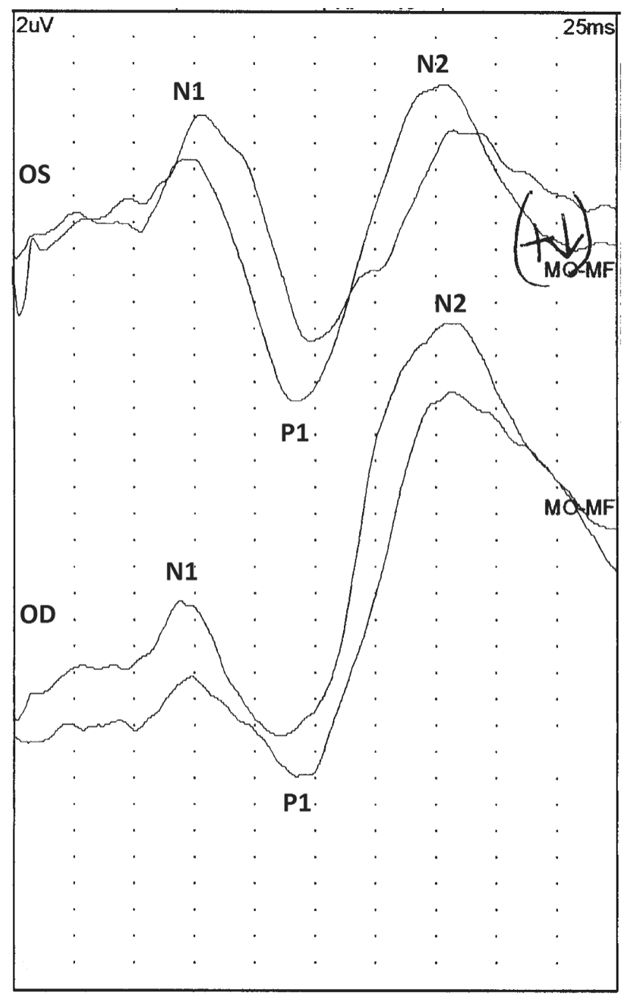
Figure 15.8: A normal FVEP after stimulation of the left (OS) and right (OD) eyes of a 1-year-old patient. Notice the P1 response, which is preceded and followed by smaller negative potentials (N1 and N2). (©AMH.)
FVEP provide only a very rudimentary assessment of the visual pathways. A normal response, one in which a P1 is present, does not indicate normal VA. Rather it simply implies that at least some parts of the visual pathway between the retinae and the occipital cortices are intact. Conversely, if technical problems are excluded, an absent FVEP suggests lack of functional integrity between the retinae and the occipital cortices (Fig. 15.9). Presence of any vision in such a situation is extremely unlikely (15,16). Performing an electroretinogram (ERG) may help localize the lesion further. If the ERG is absent, the lesion is likely in the retina, and if it is present, the optic nerve or more proximal parts of the visual pathway are most likely the site of pathology (17,18).
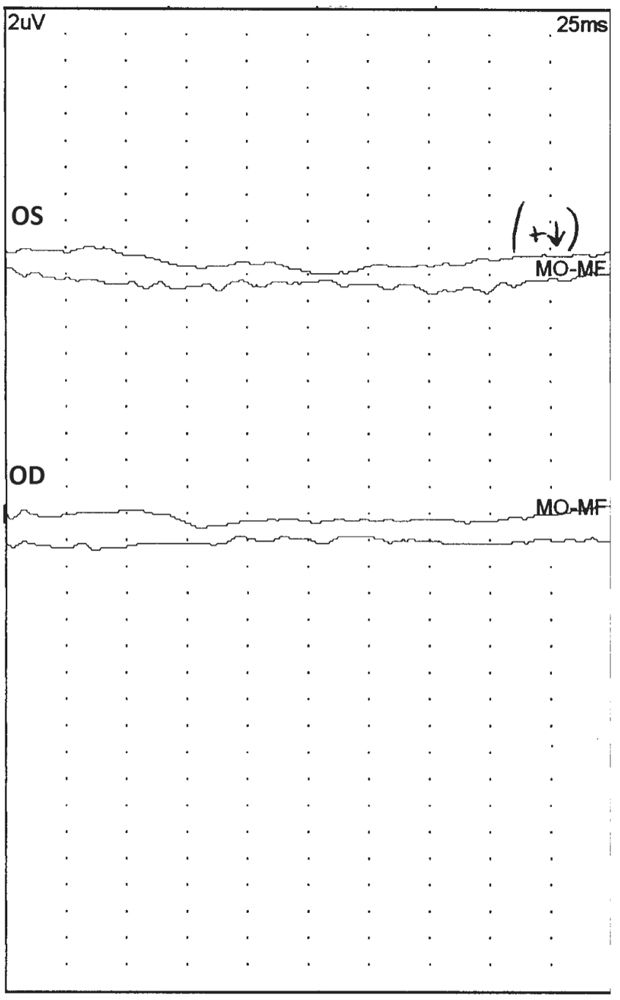
Figure 15.9: An abnormal FVEP after stimulation of the left (OS) and right (OD) eyes of a 1-year-old patient. Notice that there is no reliable, reproducible waveform present. (©AMH.)
Pediatric Considerations
VEP are a useful way to assess the visual pathway in young children who may not be able to cooperate with other types of visual system testing. While many of the interpretative criteria for children are similar to those for adults, there are significant issues relevant to maturation that must be considered.
Maturational changes have been studied with FVEP as they are easier to obtain in small children than PRVEP. At 22 weeks conceptional age (CA), a large negative peak can be seen at about 300 milliseconds. A few weeks later, a positive peak can be seen before this large negative peak. By term, the positive peak occurs at about 200 milliseconds. This positive peak becomes bifid by 44 weeks CA, and the initial part of the waveform has a latency of approximately 100 milliseconds. By 6 months of age, the positive peak at about 100 milliseconds becomes the dominant waveform and changes little thereafter. This is the P1 waveform (19). PRVEP changes in a similar manner, and a dominant P100 waveform can be seen by 6 to 8 months of age (20).
Stimulation for FVEP in children is similar to the technique described previously. When PRVEP are used in young children, maintaining attention on the checkerboard pattern can be a challenge. However, PRVEP have been successfully obtained in children as young as 4 to 6 weeks of age (21,22). In very young children, larger check sizes are used: less than 2 months of age, 120 minute check size; 2 to 3 months, 60 minutes; beyond 6 months, 30 and 15 minutes (21). Stimulation rates should be slower than used for adults, typically about 1 per second.
FVEP in children are interpreted as normal or abnormal depending on whether the P1 response is present or absent. Whereas a present P1 does not necessarily imply visual perception, an absent response makes visual perception very unlikely. When the P1 is absent, an ERG may be helpful for further localization of the pathology, as noted previously. PRVEP in children are interpreted the same way as for adults, with latency being the most important parameter. Amplitude, morphology, and topography should also be considered, however. Ideally, each laboratory should have normative data for latency measurements for various age groups. Practically, this is very difficult, and most laboratories use published norms. If this is done, the methodology used by the reference laboratory should be followed.
Clinical Correlations
Neurologic and ophthalmologic problems can cause dysfunction of the visual pathways. VEP are most useful in assessing the neurologic problems, and various ophthalmologic tests can be used to evaluate ocular pathology. Of the neurologic problems that are best evaluated by VEP are prechiasmatic lesions. Lesions in this location are hard to visualize by neuroimaging. Chiasmatic and postchiasmatic lesions can also be evaluated by VEP; however, neuroimaging is more often used for this purpose. As with other types of EP, VEP abnormalities are seldom specific to a particular condition. They identify the presence of a problem but cannot identify the etiology.
Optic neuritis is a common prechiasmatic lesion for which VEP are often used. With acute optic neuritis, there may be complete loss of the P100 waveform. Over several weeks, the P100 waveform reappears at a very prolonged latency and gradually increases in amplitude. Even as vision improves, the P100 waveform does not shorten in latency. A unilaterally prolonged P100 waveform with preserved morphology is most likely to be due to demyelination of the optic nerve (Fig. 15.10) (23). Other neuropathies and compressive lesions can also affect the optic nerve. Anterior ischemic optic neuropathy (AION) affects the amplitude of the P100 waveform more than the latency (24). Other types of primarily axonal optic neuropathies produce similar findings. Tumors also affect the amplitude of the P100 waveform more than the latency and cause topographic abnormalities (side-to-side asymmetries) (25). Certain metabolic diseases, such as the leukodystrophies, can affect both the optic nerve and the postchiasmatic visual pathway. Testing in these conditions is often with FVEP as patients with these conditions cannot cooperate with PRVEP. In Krabbe disease, the FVEP is normal (P1 present) until later in disease course when severe disease results in loss of the P1 (26,27). Other types of leukodystrophies display similar changes (28,29). Hysterical blindness does not result in changes in the PRVEP (30). However, the patient may not look at the checkerboard pattern or may not attentively focus on it. This may result in an absent or morphologically abnormal P100 waveform. In these situations, the technologist must make sure the patient is cooperative with the test. FVEP will be present in hysterical blindness even if the PRVEP is absent due to the patient’s inattention.
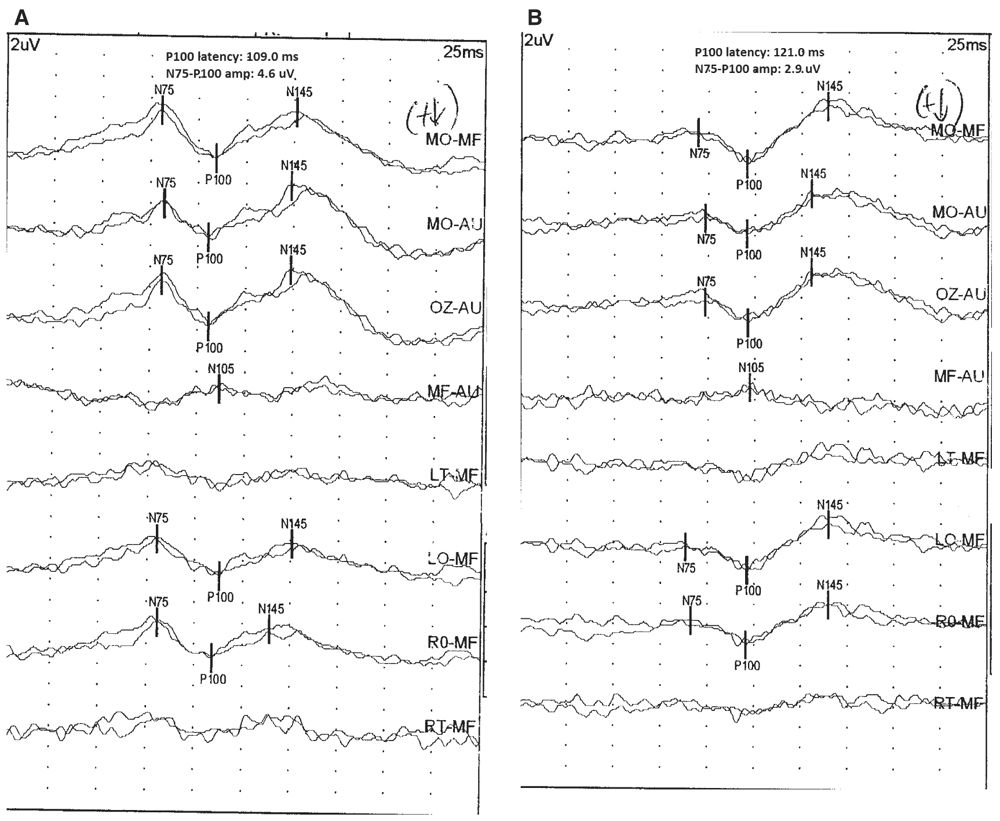
Figure 15.10: PRVEP obtained after stimulation of the left (A) and right (B) eyes of a 26-year-old patient. The PRVEP is abnormal after stimulation of the right eye, showing P100 latency prolongation to 121 milliseconds and a normal PRVEP after stimulation of the left eye (P100 latency of 109 milliseconds). Notice the preserved morphology of the P100 after right eye stimulation, despite the latency prolongation. This is a typical finding in conditions that cause demyelination of the optic nerve, such as optic neuritis. (©AMH.)
Chiasmatic lesions such as tumors of the sella turcica can produce changes in the PRVEP as they compress the optic chiasm. The most significant change produced by these lesions is abnormal topography of the P100 waveform (31). There is interhemispheric amplitude asymmetry of the P100 waveform, and a “crossed asymmetry” of the parasagittal P100 waveform is noted after stimulation of the left and right eyes (see earlier). The latency of the P100 waveform may or may not be prolonged in these cases.
Any disease affecting the cerebral cortex diffusely can result in a postchiasmatic lesion of visual pathways. This includes conditions such as stroke, tumors, and demyelinating and metabolic diseases. As noted previously, various metabolic diseases can affect pre- and postchiasmatic visual pathways. Similar to chiasmatic lesions, postchiasmatic lesions affect the topography of the P100 waveform, resulting in a P100 waveform interhemispheric amplitude asymmetry. However, with postchiasmatic lesions, there is “uncrossed asymmetry” of the parasagittal P100 waveform after stimulation of the left and right eyes. The latency of the P100 waveform is affected little in these cases (1). Diseases that affect the cerebral cortex symmetrically can cause symmetric changes in the P100 waveform, and an interhemispheric amplitude asymmetry may not be seen (31). When chiasmatic and postchiasmatic lesions are suspected based on full-field PRVEP, this should be confirmed with other methods of testing, such as hemifield stimulation or imaging.
Whereas VEP are not used to test ophthalmic disorders, they may be present and affect the VEP. The most common are refractive errors. These affect VA, which may make obtaining PRVEP more challenging, and larger check sizes may be needed for those patients. Similarly, other ocular disorders can also affect VA and, in turn, the VEP. Patients presenting to the VEP laboratory should be asked about their vision history and VA with corrective lenses should be noted. Patients with advanced-stage cataracts can have dimming of vision. The luminance of the stimulus may be affected and causes changes in VEP amplitude and latency.
BRAINSTEM AUDITORY EVOKED POTENTIALS
Stay updated, free articles. Join our Telegram channel

Full access? Get Clinical Tree


