The previous chapter covered the normal adult EEG and introduced the major necessary concepts to analyze EEG. Pediatric EEG interpretation builds on these essential skills but requires one additional element: a thorough knowledge of EEG ontogeny, or the orderly maturational changes in pediatric EEG. Children are not small adults, and at first glance their EEGs could not appear more distinct, but the same techniques used to systematically analyze the adult EEG can be applied to children once one appreciates the organizational themes of pediatric EEG. Accordingly, this chapter will not recapitulate elements from the prior chapter, but instead will focus on the development of pediatric EEG from the premature to adolescence.
To make the discussion as practical as possible, the pediatric EEG will be described in the same order in which it is typically analyzed, noting first the continuity and then, in turn, the organization of the principal components, the interhemispheric symmetry and synchrony of these components, and the presence of various special features that often serve as signposts of maturation. Finally, abnormalities are noted and described. The discussion will begin with the most premature babies and will continue through to adolescence.
Before the visual analysis (VA) is discussed, there are a few technical matters that must be addressed. The international 10–20 system of electrode placement is modified for neonatal EEG recording because of neonates’ small head size and the relative lack of EEG activity in the extreme frontopolar regions (Fig. 6.1a,b). The standard neonatal montage includes electrodes Fp3 (halfway between Fp1 and F3), Fp4 (halfway between Fp2 and F4), C3, C4, T3, T4, 01, 02, Fz, Cz, Pz, A1, and A2 (1). If the earlobes are too small, mastoid leads (M1 and M2) may be substituted. Fp3 and Fp4 electrodes are used because electrographic background activity and frontal physiological sharp waves are better visualized there than at the usual frontopolar locations (Fp1 and Fp2) (2). Beyond 6 weeks of age or a head circumference of 40 cm, many laboratories will use the same complement of electrodes found in adult tracings. At the same time, most EEGers in North America will change the display to 30 mm per second, again resembling adult tracings.
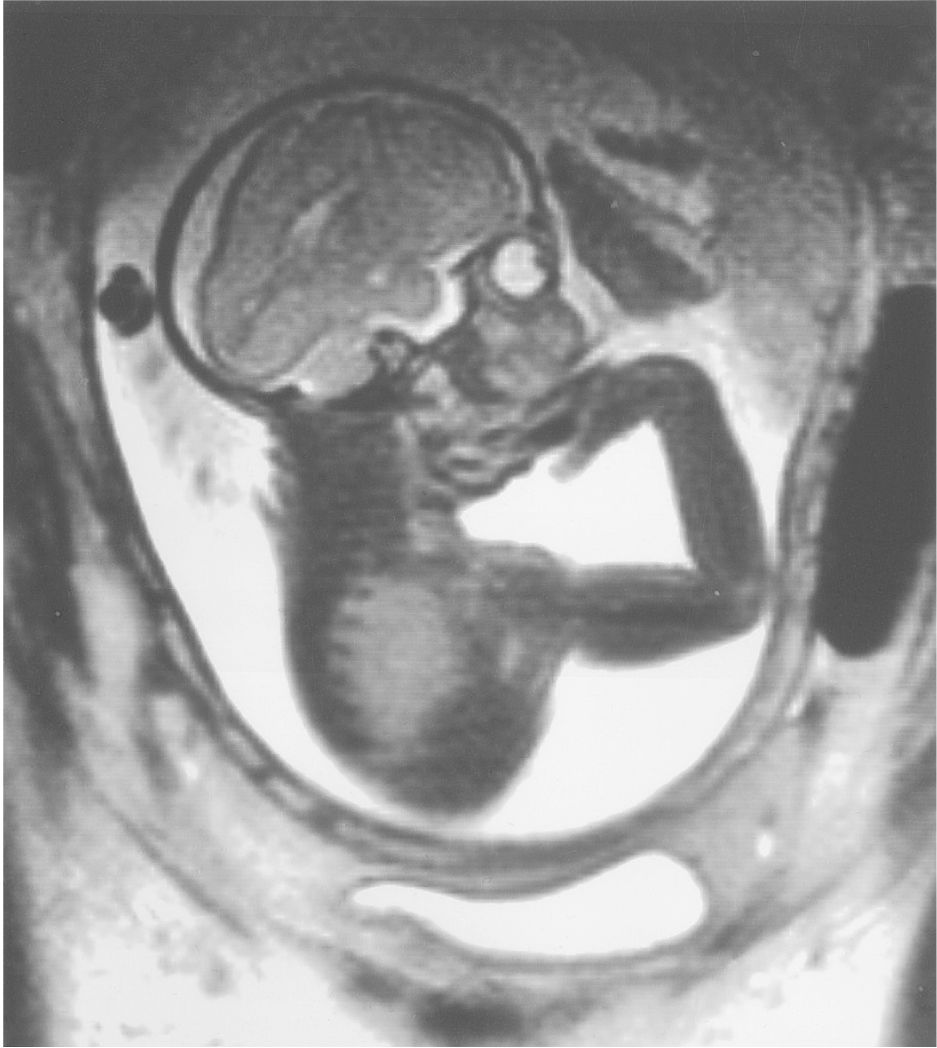
Figure 6.1a: Intrauterine MRI of fetus 30 weeks of estimated gestational age. Notice the relatively simple convolutional markings of the frontal lobes in comparison with the occipital cortices.
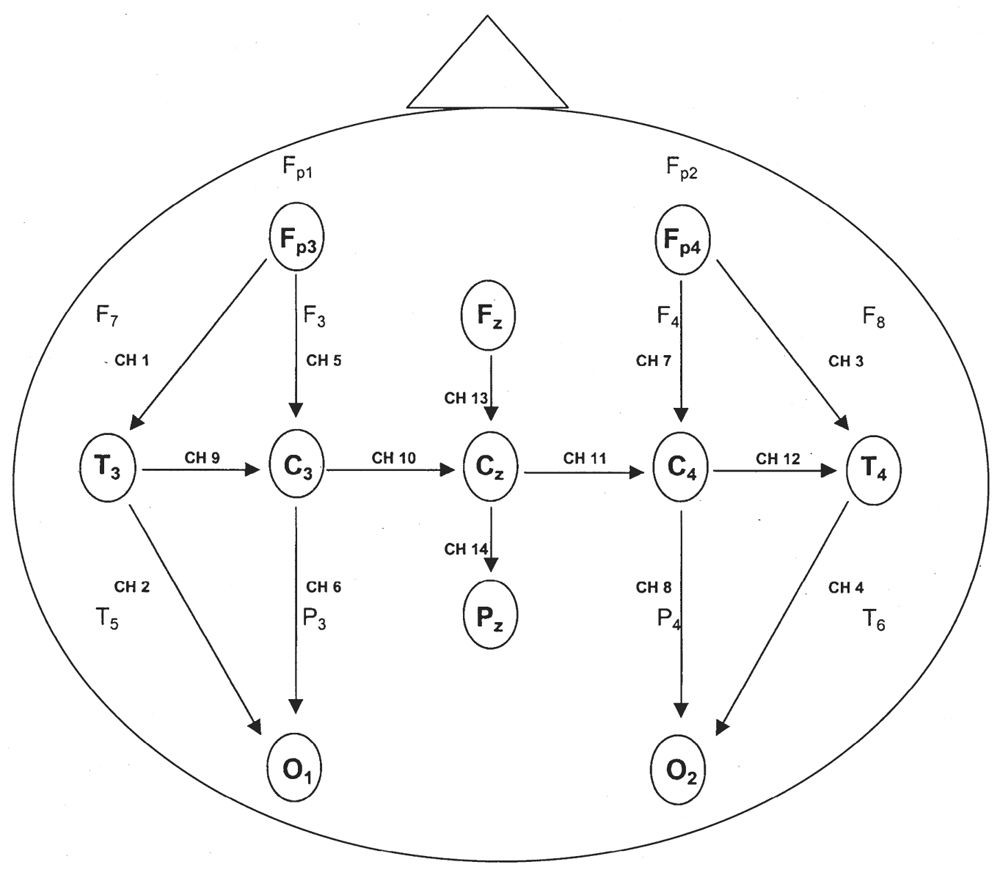
Figure 6.1b: Modification of the international 10–20 system commonly used in neonates. A single montage includes anteroposterior, transverse, and midline arrays. Fp3 and Fp4 replace the usual Fp1 and Fp2 electrode locations.
The one piece of extraneous information that is needed to properly interpret a pediatric EEG is the age of the patient (although in many circumstances the skilled EEGer can develop a fairly accurate estimate). In neonates and young infants, the most relevant is the conceptional age. This is determined by adding the number of weeks since birth to the estimated gestational age (EGA). The EGA is the age of the fetus since conception, calculated from the time of the mother’s last menstrual period to the day of the infant’s birth. Newborns are considered premature if born before the 37th week. Term infants are born between the 37th and 42nd weeks of gestation, and postterm infants are born after 42 weeks of gestation. In an arbitrary but practical manner, we stop counting children’s ages in months sometime beyond the second or third year, and convert to years, or fraction of years (e.g., 2.5-year-old child).
VISUAL ANALYSIS
State and Continuity
The VA begins with an assessment of the state of the child and the continuity of the background. For all pediatric EEG tracings, there should be a tight concordance between state and EEG background, and the tracing should be continuous in all states. The notable exception is the neonatal period where tracings are normally discontinuous in the premature. Indeed, an accurate assessment of the quantity and quality of the continuity of the background in the various states is the single most important factor in neonatal EEG.
Simple definitions of state suffice: in sleep, the eyes are closed, and in wakefulness, the eyes are open. In a well-developed newborn in active sleep, there are a variety of small and large body movements, sucking, and even crying behaviors that are punctuated by bursts of predominantly horizontal rapid eye movements—the REM phase of active sleep. Brief apneas are relatively common, especially before term. Newborns often enter into active sleep from wakefulness. This pattern of sleep onset continues until about 3 to 4 months postterm, at which time quiet sleep precedes active sleep, just as it will throughout adult life.
In a well-developed newborn and infant in quiet sleep, there are few head, trunk, or limb movements. Respirations are regular, deep, and slow. Apnea is uncommon. Occasional startles or arousals may briefly interrupt quiet sleep. Since quiet sleep is most vulnerable to adverse medical or neurological conditions, it is essential to try to capture quiet sleep for a thorough assessment. In newborns and infants with mild encephalopathies, the awake and active sleep recording may appear normal, but quiet sleep recordings reveal previously unrecognized abnormalities.
Even in healthy newborns, much of sleep is indeterminate or transitional: That is, even with a good-quality EEG and careful behavioral observation, it is not possible to determine precisely whether the child is in active or quiet sleep. This is clearly the case when the infant transits from one behavioral state to another (transitional sleep), but it also applies when an exact designation of active or quiet sleep cannot be assigned. A large proportion of total sleep time is indeterminate at term and increases in the setting of medical or neurological illness (Fig. 6.2).
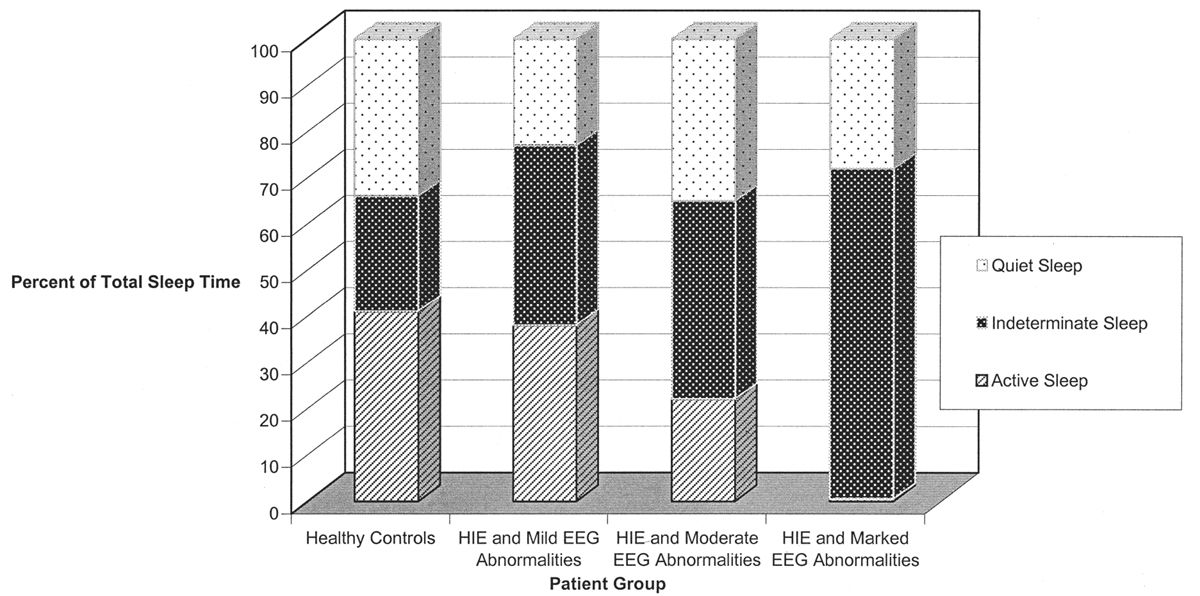
Figure 6.2: The percentage of total sleep time occupied by indeterminate sleep is significantly increased in sick newborns with abnormal electroencephalographic backgrounds. (Adapted from Watanabe K, Miyazaki S, Hara K, et al. Behavioral state cycles, background EEGs and prognosis of newborns with perinatal hypoxia. Electroencephalogr Clin Neurophysiol 1980;49:618–625.)
The earliest vestiges of EEG activity are believed to arise after the 8th week of gestation where the EEG tracing appears as a completely discontinuous recording in which brief periods of electric activity (“bursts”) are interrupted by periods of quiescence (“interburst” intervals or IBIs). With the development of central nervous system (CNS) maturity and the increased influence of the deep grey structures that modulate cortical function, the duration of the burst (burst interval [BI]) increases, whereas the length of the IBI decreases. EEG signals that regularly vary between the high-amplitude “on” periods of the bursts and low-amplitude “off” periods of the IBI are called discontinuous EEGs. Those that display a relatively steady amplitude are considered continuous.
The duration of the IBIs is a semiquantitative measurement of one aspect of the neonatal EEG. A typical, representative portion of the discontinuous portion of the EEG is selected for review, and the duration of the IBIs is measured and counted over a specific period of time: for example, a 10-minute sample. In that representative portion of time, numerous measurements of the IBI are made, and the mean, median, and longest IBI values can be measured. The prime determinant of measures of the IBI is the infant’s conceptional age. A typical median IBI at the conceptional age of 24 weeks is 10 seconds; this gradually decreases at older conceptional ages to values around 2 to 4 seconds (Fig. 6.3) (2–12).
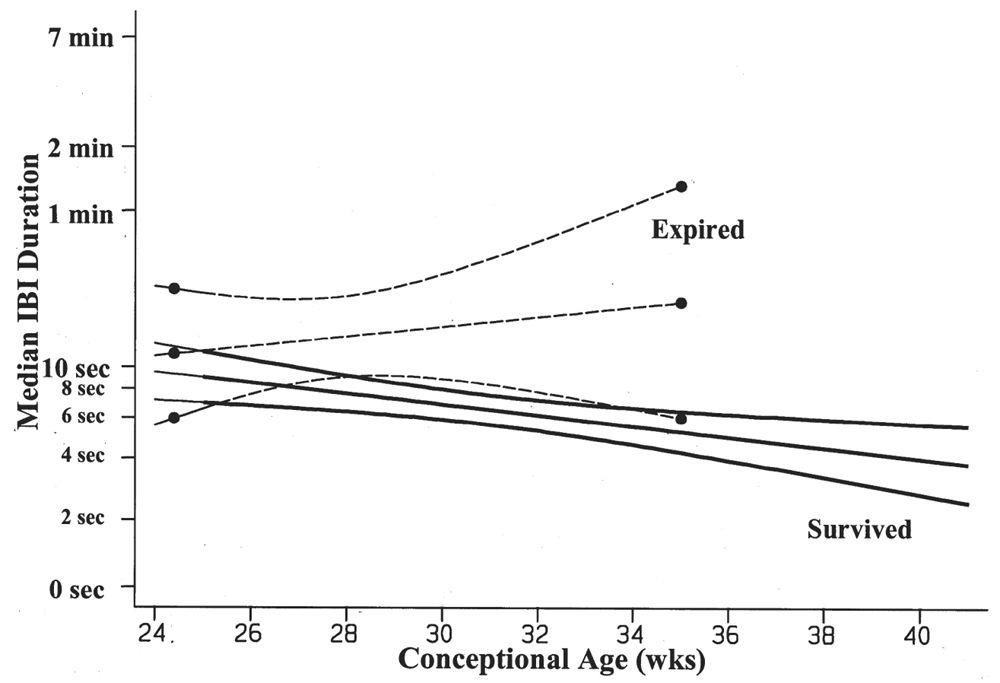
Figure 6.3: Median IBI duration decreases with advancing conceptional age in survivors of prematurity. The premature infants who died are characterized by IBIs that are significantly longer in duration than the IBIs of survivors. (Adapted from Clancy R, Rosenberg H, Bernbaum J, et al. Survival outcome prediction in premature infants with IVH by cranial ultrasonography and EEG. Ann Neurol 1994;36:489.)
Beyond 2 months of age, the EEG tracing should be continuous in all states. The importance of this fact cannot be overstated. Any older infant with a discontinuous background is demonstrating signs of an encephalopathy, and this is one of the most powerful prognostic features in a wide variety of clinical settings, including epilepsy.
Organization and Principal Components
Newborns do not have a consistent anterior to posterior voltage and frequency gradient, but all older infants and children should. This develops by 3 months and from this point forward becomes the second most important general feature of the pediatric EEG. In contrast to adults where low voltage undifferentiated backgrounds may be seen as a normal variant, this is virtually unheard of in infants and children. Awake children beyond 3 months should have a clear gradient. This is disrupted in drowsiness and sleep; therefore, if the gradient is not present, one must wonder whether the child is drowsy or encephalopathic.
The gradient is composed of three principal rhythmic components located in the posterior, central, and frontal regions, corresponding to the alpha, mu, and beta rhythms, respectively. While these more mature organized rhythms are absent in the newborn, there are other named patterns that are important to recognize. These named patterns are not truly precursors to the more mature components and are not obligatory like the posterior dominant rhythm, but important signposts of maturation, nonetheless. Therefore, these components of neonatal EEG will be briefly mentioned in the overview of the ontogeny and then in detail in the following section on principal components.
Interhemispheric Symmetry and Synchrony
Normal EEG activity arising from the two hemispheres or homologous brain regions should be essentially symmetrical at any age, including the newborn. It may be difficult for the reader unaccustomed to pediatric EEGs to accurately judge whether the absolute quantity of various frequency elements is normal for age, but it is still possible to determine whether these same elements are symmetric. There are two facets of background symmetry to be judged: amplitude and waveform composition (Figs. 6.4 and 6.5). Amplitude symmetry implies that, in a suitably large sample of cerebral electrical activity, the background voltages between the hemispheres or specific regions are approximately equal. There is no universal agreement as to what amount of amplitude asymmetry constitutes an electrographic abnormality. A useful interpretation guideline is that an abnormality may be suspected if the amplitude difference between two regions exceeds a 2:1 ratio (11,13–15). Likewise, guidelines for the complexity of the waveforms are not well established, and therefore this is usually left to the discretion of the reader to decide whether the frequency components are relatively similar between two regions or hemispheres.
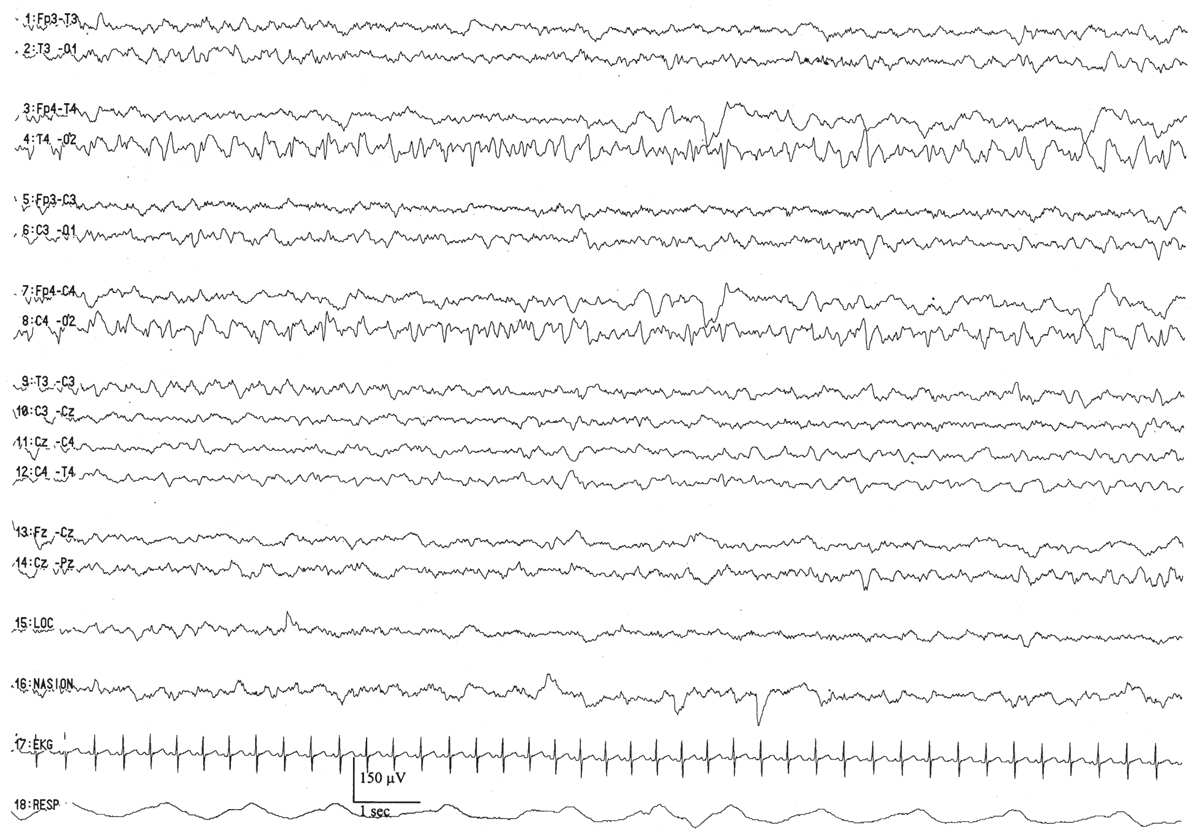
Figure 6.4: Asymmetry secondary to cerebral pathology in an infant 41 weeks of conceptional age with Sturge-Weber syndrome affecting the right hemisphere. The right occipital region is slow and contains sharp waves, in comparison with the normal-appearing left hemisphere.
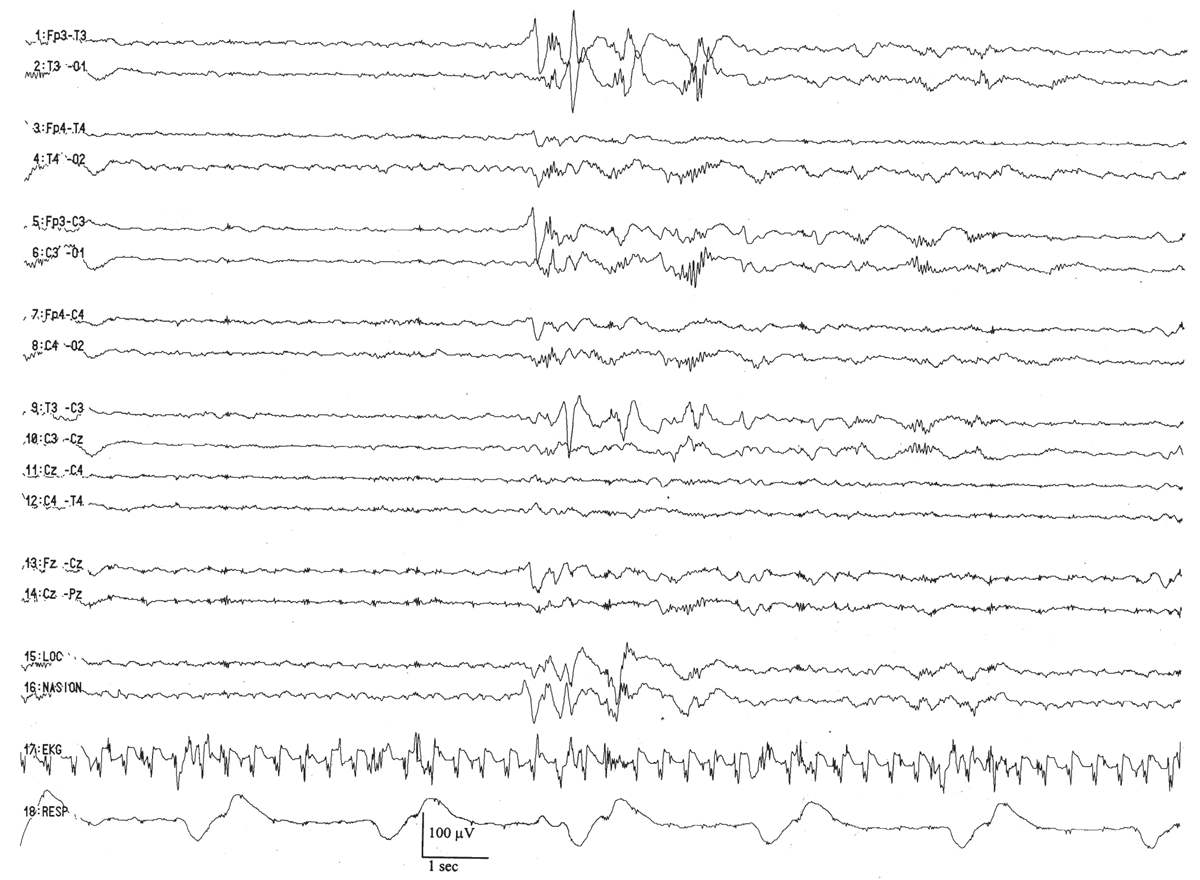
Figure 6.5: Asymmetry secondary to scalp edema in an infant 41 weeks of conceptional age with tetralogy of Fallot and seizures. The infant’s head was turned to the right, and marked right scalp edema was present. The amplitude is decreased on the right side, but the background composition is similar to that of the left. The asymmetry disappeared after the scalp edema resolved.
Interhemispheric synchrony is another measure reflective of CNS maturation. In the neonates, interhemispheric synchrony is measured during the discontinuous portions of the EEG. Asynchrony is defined as bursts of morphologically similar EEG activity in homologous head regions separated by more than 1.5 to 2.0 seconds (Fig. 6.6). Somewhat paradoxically, neonates at a conceptional age of less than 30 weeks exhibit hypersynchrony, whereby the majority of bursts arising within the two hemispheres appear at the same time (Fig. 6.7). The physiological basis for interhemispheric hypersynchrony is unknown. After the conceptional age of 30 weeks, hypersynchrony gives way to the appearance of asynchronous bursts of cerebral electrical activity between the two hemispheres. About 70% of bursts during quiet sleep are synchronized at the conceptional age of 31 to 32 weeks, increasing to 80% at 33 to 34 weeks, 85% between 35 and 36 weeks, and 100% after 37 weeks (2,11,14,16).
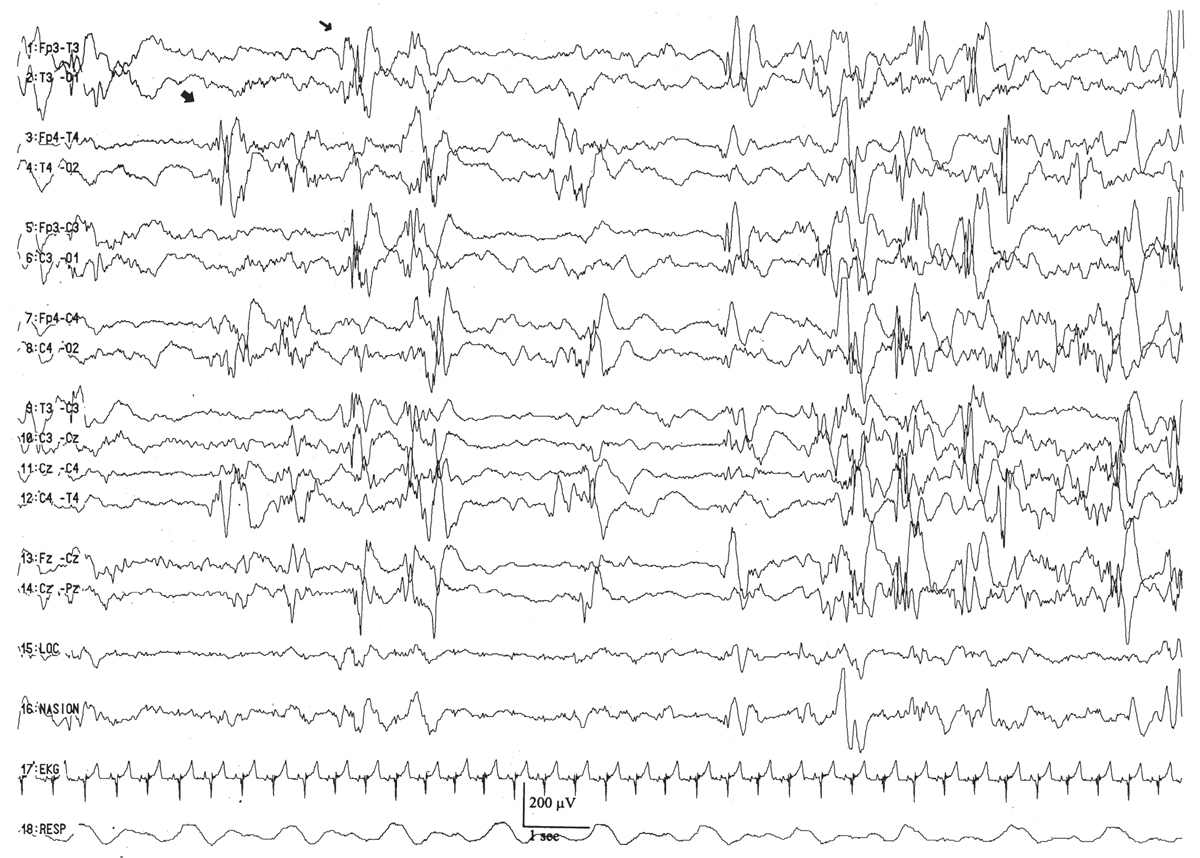
Figure 6.6: Excessive asynchrony in an infant 46 weeks of conceptional age with nonketotic hyperglycinemia. Bursts of right (large arrow) and left (small arrow) hemispheric activity are not synchronized.
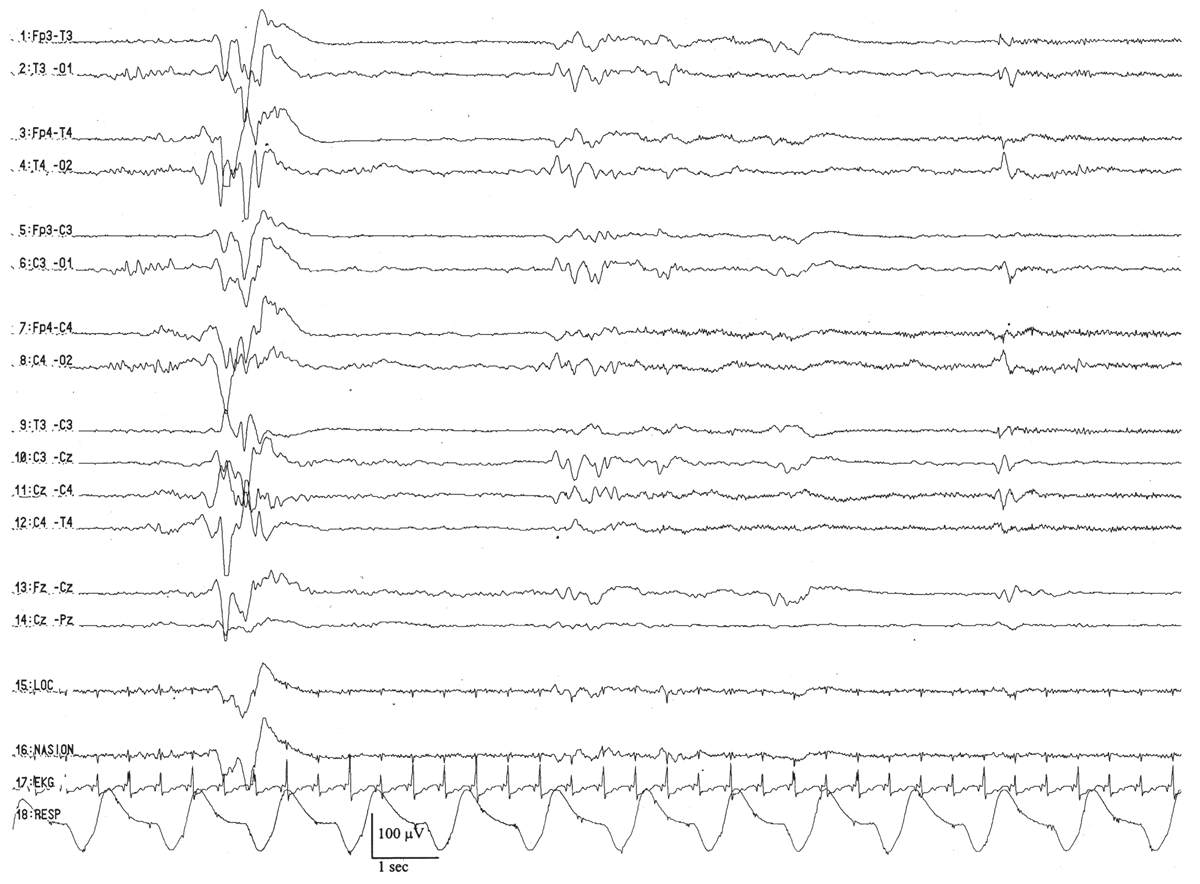
Figure 6.7: Synchrony in a premature infant 27 weeks of conceptional age with dysmorphic facial features. Cerebral activity is well synchronized between the hemispheres.
In older infants, synchrony is largely judged by sleep architecture. Sleep spindles and vertex waves are normally asynchronous until 18 to 24 months, at which point they are expressed simultaneously across the hemispheres along with K complexes.
Special Features
A variety of special features are encountered in the pediatric EEG that are unique to this age or have a clinical significance that is different from that seen in an adult. In neonatal, infant, and childhood EEGs, some of these special features can be helpful signposts of maturation and will be discussed in some more detail. The reader encountering these features for the first time is encouraged not to get lost in the details but to retain the general gestalt. Overtime, it is critical to master the identification of these special features because these are the elements that are most likely to be confused with pathological waveforms and may therefore lead to erroneous conclusions in the interpretation. One example is the exuberance of rhythmic slowing normally seen in state transitions or during hyperventilation (HV) in the young. The authors’ have seen these patterns misinterpreted as “paroxysmal discharges” when, in fact, they are completely normal for age.
Abnormalities
Many abnormalities such as slowing and attenuation have very similar significance in pediatric EEGs as in adult studies, but the clinical significance of certain abnormalities like sharp waves and spikes varies as a function of age and location. This is most critical in the newborn, and therefore the special significance of sharply-contoured discharges will be reviewed in some detail. Finally, neonatal seizures will be discussed—even though they are never normal—as no review of neonatal EEG would be complete without some discussion on this important topic.
OVERVIEW OF ELECTROENCEPHALOGRAPHIC ONTOGENY
The development of the fetal brain undergoes explosive changes with regard to its overall anatomic appearance, synaptic connectivity, time-dependent genetic expression of neurotransmitter receptor subunits, and their consequent functional abilities. In parallel with these anatomical and functional changes is an orderly, predictable pattern of neonatal EEG characteristics that emerge simultaneously with advancing maturity of the fetal brain (Fig. 6.8). EEG maturation continues at a rapid pace during infancy, slows during childhood, and nearly plateaus in adolescence, whereupon it settles into a form that remains relatively stable for the next seven to eight decades. For practical reasons, the discussion of EEG ontogeny begins with the infant at 24 weeks EGA, near the current boundary of fetal viability (7). It will proceed through infancy, into childhood, and finally adolescence. The general hope of this chapter is to provide a fluid discussion of pediatric EEG interpretation from the premature to adolescence, with a consistent method of reading that can be used throughout the age spectrum.
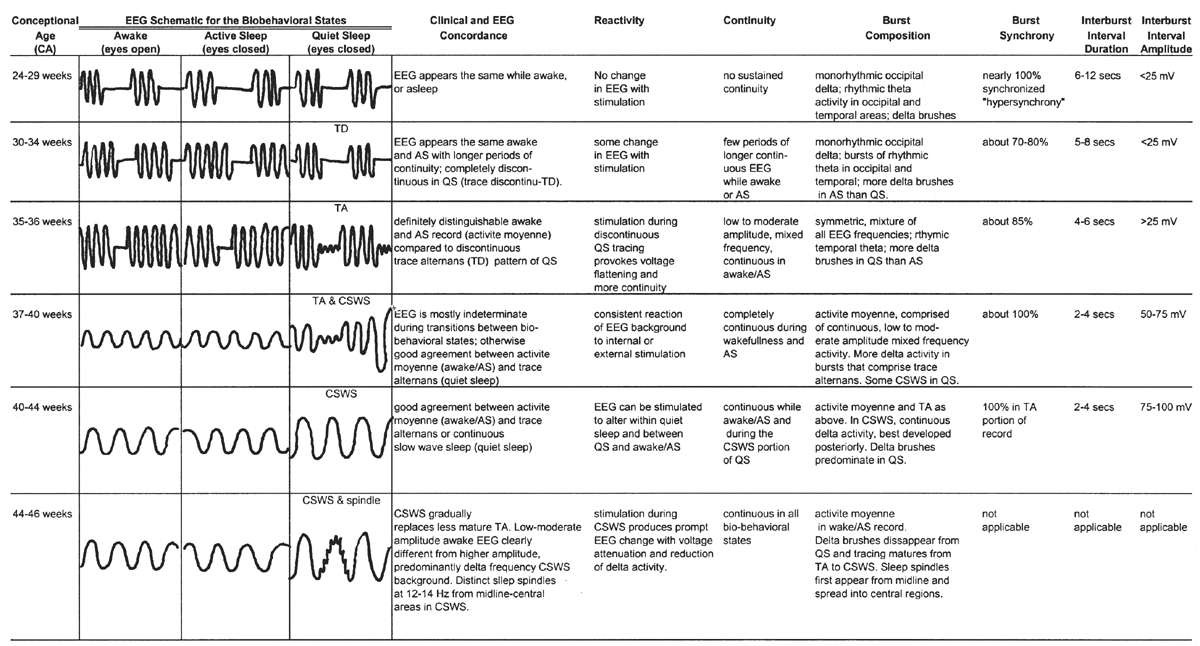
Figure 6.8: Overview of development of electroencephalographic background between 24 and 46 weeks of conceptional age.
24 to 29 Weeks of Conceptional Age
EEGs obtained from the very premature infant are, for the most part, discontinuous recordings where low-voltage (<25 μV) quiet periods are punctuated by brief epochs of moderate-amplitude activity. The latter are composed of various recognizable, named patterns such as the delta brush, monorhythmic occipital delta activity, and bursts of rhythmic occipital and temporal theta activity. The duration of the low-voltage IBIs varies with age, being longer in the youngest patient and decreasing in duration as the brain matures. The typical IBI averages about 6 to 12 seconds in physically healthy infants at this age. Most of the EEG bursts are well synchronized, appearing simultaneously (within 1.5 to 2.0 seconds) between the left and right cerebral hemispheres. Although infants clinically cycle through awake/asleep periods with eye opening (i.e., wakefulness) and eye closure (i.e., sleep), there is qualitatively little difference in the appearance of the EEG background. In other words, there is little concordance (agreement) between the clinical and electrographic expressions of the biobehavioral state at this conceptional age.
30 to 32 Weeks of Conceptional Age
By this conceptional age, there first appears some differentiation of the EEG pattern that distinguishes wakefulness (or REM/active sleep) from non-REM, or quiet, sleep. There is some concordance between the appearance of the background EEG and the behavioral state. During wakefulness or active sleep, the EEG begins to “fill in” some of the low-voltage IBIs that had previously remained monotonously invariant. The awake/active sleep EEG is relatively more continuous, with longer-duration BIs. The actual composition of the bursts still largely resembles that at earlier gestational ages, dominated by the synchronized, monorhythmic occipital delta activity, some of which are incorporated into posterior delta brushes. The brief bursts of rhythmic theta activity have migrated more from the occipital to the temporal areas. There are still many portions of the record that are discontinuous, even during wakefulness and active sleep, but the IBIs are a little briefer, about 5 to 8 seconds on average. During well-developed quiet sleep, the record is persistently discontinuous and is distinguishable from the awake/active sleep tracing. The term trace discontinu (discontinuous tracing) is first applied to this early form of a healthy quiet sleep recording in which bursts of normal cerebral electric activity are regularly interspersed with low-voltage (<25 μV) periods of quiescence. The record may be marginally reactive to external stimulation: if the patient is provoked during quiet sleep, there is a visible change of the actual EEG background (not just EMG or movement artifact from patient motion) with the appearance of a more continuous background resulting from the arousal.
Trace discontinu is an important EEG maturational milestone, inasmuch as it is the first EEG pattern to emerge that differentiates wakefulness from sleep in the premature infant. With the development of trace discontinu, there is, for the first time, some concordance between the infant’s clinical state and the EEG background. During quiet sleep, the trace discontinu pattern develops; it consists of bursts of high-amplitude (≤200 μV) activity separated by periods of relative quiescence with amplitudes of less than 25 μV (Fig. 6.9). The bursts are composed of normal theta and delta activity, and the acceptable range of the IBIs durations is determined by the conceptional age.
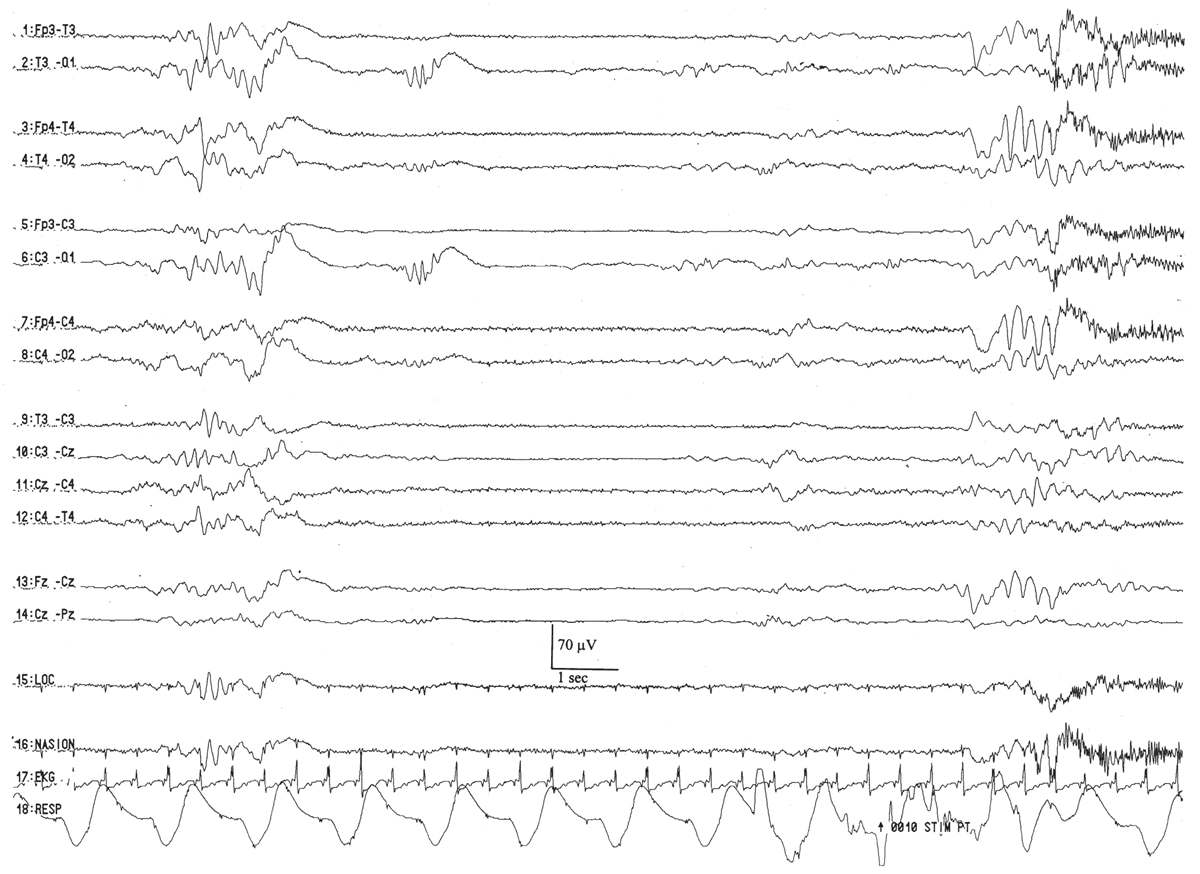
Figure 6.9: Trace discontinu in an infant 31 weeks of conceptional age with apnea. The tracing is discontinuous. Bursts of activity are composed of normal patterns for age, and the amplitude of the IBI is less than 25 μV.
By 32 to 34 weeks of conceptional age, the trace discontinu pattern is well developed. Wakefulness and active, quiet, and indeterminate (transitional) sleep EEG stages emerge with improved clinical concordance. Trace discontinu remains the EEG pattern of quiet sleep until 36 weeks of conceptional age, when the IBI amplitude exceeds 25 μV, which defines the more mature pattern of quiet sleep, trace alternant.
33 to 34 Weeks of Conceptional Age
By this conceptional age, there is further consolidation of the biobehavioral states: active and quiet sleep are more clearly distinguishable both clinically and electrographically, and the concordance between the appearance of the EEG and the behavioral state is easier to recognize. Less of the EEG is indeterminate—that is, lacking in the distinguishing characteristics that allow definitive classification into specific biobehavioral states. In the awake and active sleep record, the background is more continuous, with further filling in of the gaps between the EEG bursts. The IBIs are fewer and briefer than before. The monorhythmic occipital delta activity is fading, and most of the bursts of rhythmic theta activity appear in the temporal regions. Up to this conceptional age, there are more delta brushes per minute in the awake and active sleep portions of the recording than during quiet sleep. Trace discontinu continues to be the quiet sleep pattern, and the IBIs range from 5 to 8 seconds, but the synchrony of the bursts is, paradoxically, less than at earlier conceptional ages. Only about 70% to 80% of the bursts in the discontinuous portions of the study are synchronized, occurring within 1.5 to 2.0 seconds between the two hemispheres.
35 to 36 Weeks of Conceptional Age
By this conceptional age, biobehavioral states are easily distinguished, and the EEG shows definite and reproducible reactivity to external stimulation. In wakefulness and active sleep, the EEG is essentially continuous and is composed of low- to moderate-amplitude, mixed-frequency activity. This normal pattern that typifies the awake and active sleep record is commonly called activité moyenne (“average activity”). There is little left of the high-amplitude monorhythmic occipital delta and only few remnants of the rhythmic theta bursts. The signal is composed of admixed, coexisting frequencies ranging from delta to beta frequencies and a few delta brushes in the occipital, central, and temporal areas. The quiet sleep record remains discontinuous, but the amplitude of the IBI gradually increases as the duration further declines. At this point, the typical IBI duration is about 4 to 6 seconds, and its amplitude clearly exceeds 25 μV. The name of this normal immature, discontinuous quiet sleep pattern is trace alternant, indicating a pattern that alternates between high-amplitude BIs and low-amplitude IBIs.
Between 34 and 36 weeks of conceptional age, the trace discontinu pattern of normal quiet sleep begins to evolve into the more mature pattern of trace alternant (Fig. 6.10) (5). In both trace discontinu and trace alternant, the tracing is discontinuous. The fundamental distinction between trace discontinu and trace alternant lies in the amplitude of the IBI. In trace discontinu, it is less than 25 μV, whereas in trace alternant, it is greater than 25 μV. The bursts of cerebral activity in trace alternant consist of symmetrical delta activity, admixed with faster frequencies, with amplitudes of 50 to 300 μV. The duration of the bursts varies considerably, but is typically more than 2 seconds. The composition of the IBI of trace alternant resembles the EEG during wakefulness and active sleep and consists of mixed frequencies with amplitudes of 25 to 50 μV. The duration of the IBI shortens as term approaches and normally does not exceed 2 to 4 seconds by 38 to 40 weeks of conceptional age (2). Trace alternant itself begins to wane by 38 to 40 weeks of conceptional age, although fragments may persist until 44 to 46 weeks of conceptional age. Trace alternant is gradually replaced by the more mature pattern of continuous slow-wave sleep (CSWS) (6,17).
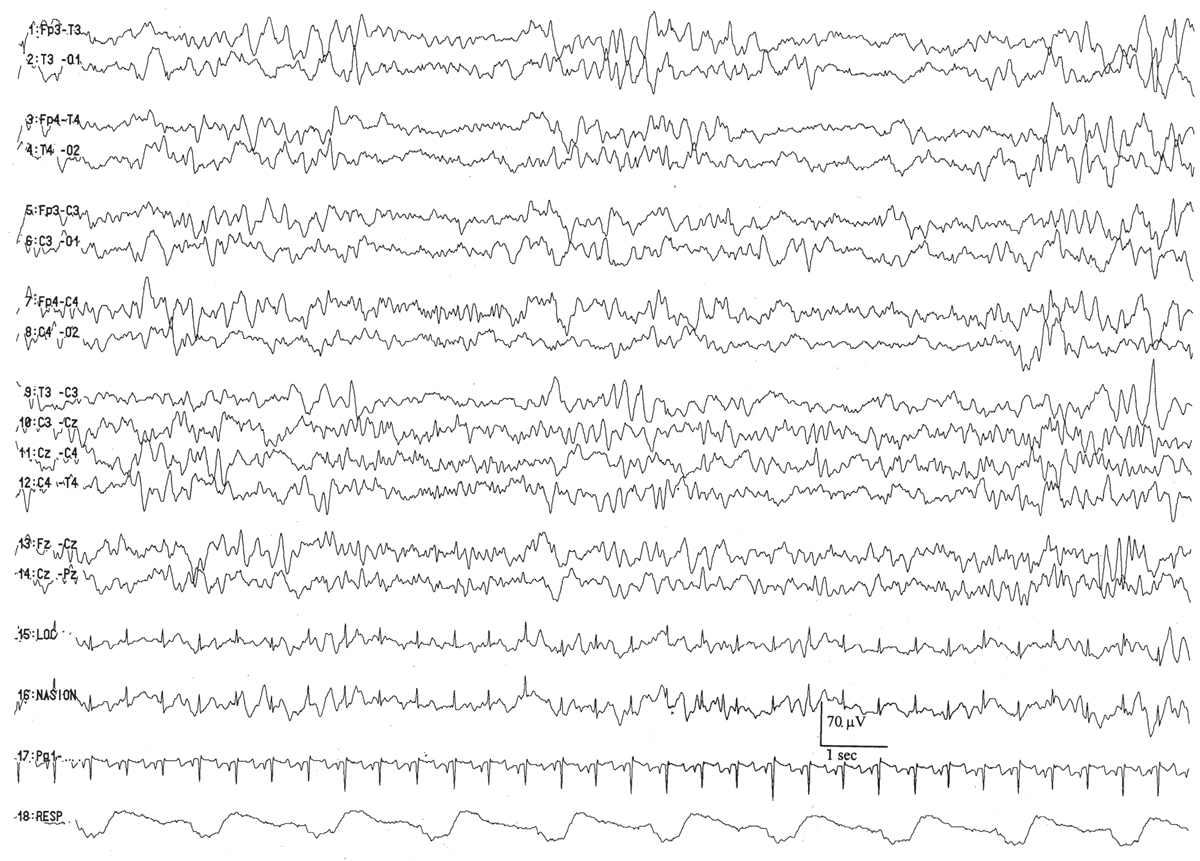
Figure 6.10: Trace alternant in an infant 37 weeks of conceptional age with hypotonia. The tracing is discontinuous. Bursts of higher amplitude patterns, which are normal for age, alternate with lower amplitude activity. The amplitude of the IBIs exceeds 25 μV.
These bursts are typically more synchronized than at the prior conceptional age; about 85% appear simultaneously between the two hemispheres. Delta brushes are more abundant in quiet sleep than in active sleep, and much of the record can be assigned to definite sleep categories.
37 to 40 Weeks of Conceptional Age
The waking EEG resembles the background of the onset of active sleep, composed of low-amplitude (<25 μV), predominantly 4- to 7-Hz theta and low-amplitude delta activity (Fig. 6.11). There are two basic active sleep patterns in neonates older than 36 weeks of conceptional age.
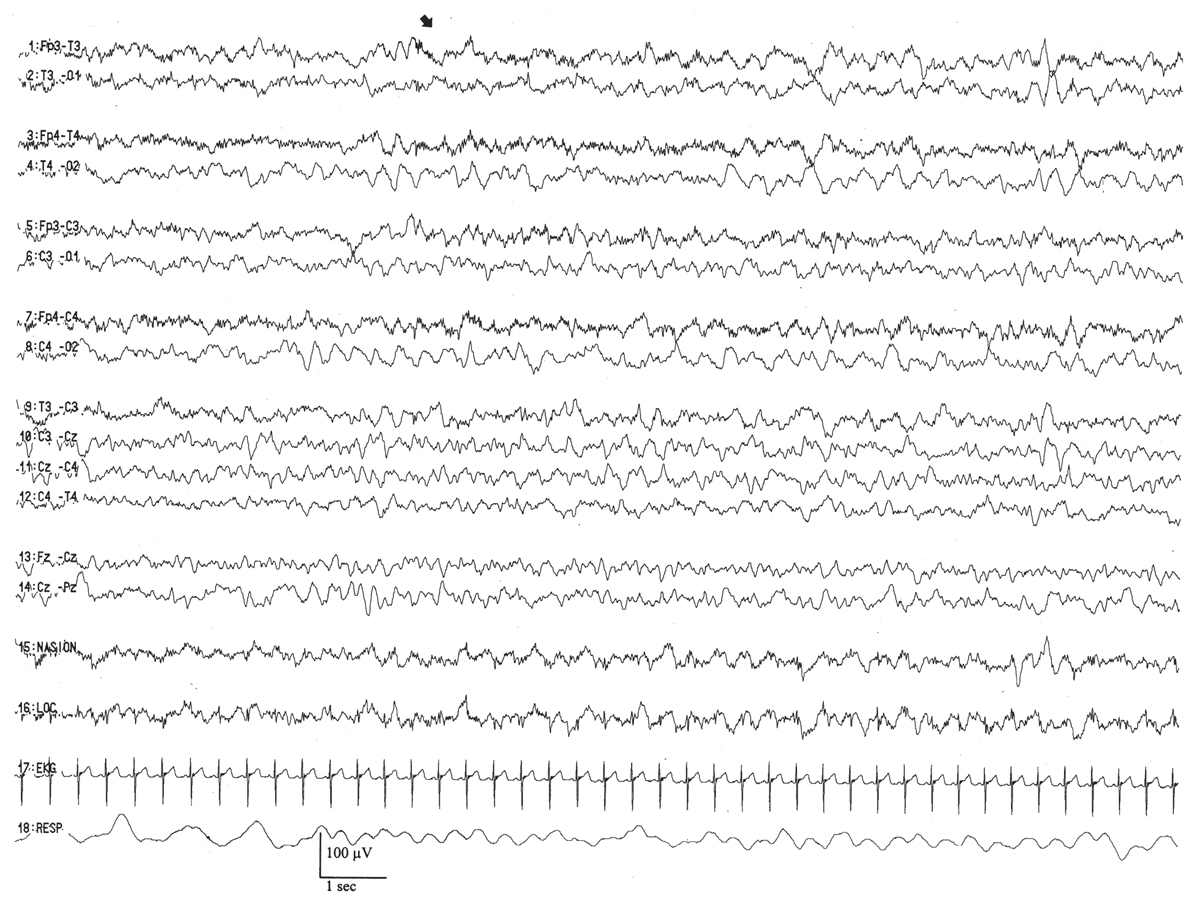
Figure 6.11: Wakefulness in an infant 41 weeks of conceptional age evaluated for staring episodes. The tracing consists of continuous, mixed-frequency activity of low to medium amplitude (activité moyenne). Muscle activity (arrow) suggests wakefulness and helps to distinguish this pattern from that of active sleep.
Neonates usually enter their sleep cycle in active sleep, and the duration of active sleep cycles varies between 10 and 45 minutes. As the infant enters active sleep the first time, the background is composed of moderate-amplitude (25- to 50-μV) irregular theta and delta activity with relatively few frontal transients (encoches frontales) (5). Subsequent cycles of active sleep have lower amplitude, more theta activity, and less delta activity, and resemble the EEG of the awake state (activité moyenne).
In healthy full-term infants, there are clearly and easily recognizable periods of wakefulness/active sleep and quiet sleep. About 25% of total sleep time is occupied by indeterminate sleep (18). Once quiet sleep is established, trace alternant first appears with typical IBIs of 2 to 4 seconds, and essentially all of the bursts arise synchronously. If the infant remains asleep for a while, trace alternant gives way to a moderate- to high-amplitude, uninterrupted delta activity, the earliest expression of CSWS.
CSWS is the final major stage developed in the ontogeny of the EEG in quiet sleep. CSWS consists of nonstop delta and theta activity with amplitudes of 50 to 300 μV; it resembles stage-3 and -4 sleep seen in older patients. Discontinuity with BIs and IBIs is no longer present. The first fragments of CSWS emerge around 35 weeks of conceptional age. In one study, CSWS accounted for about 10% of total quiet sleep time at 36 weeks of conceptional age, 40% at 40 weeks, and 100% by 44 to 45 weeks (17) (Fig. 6.12).
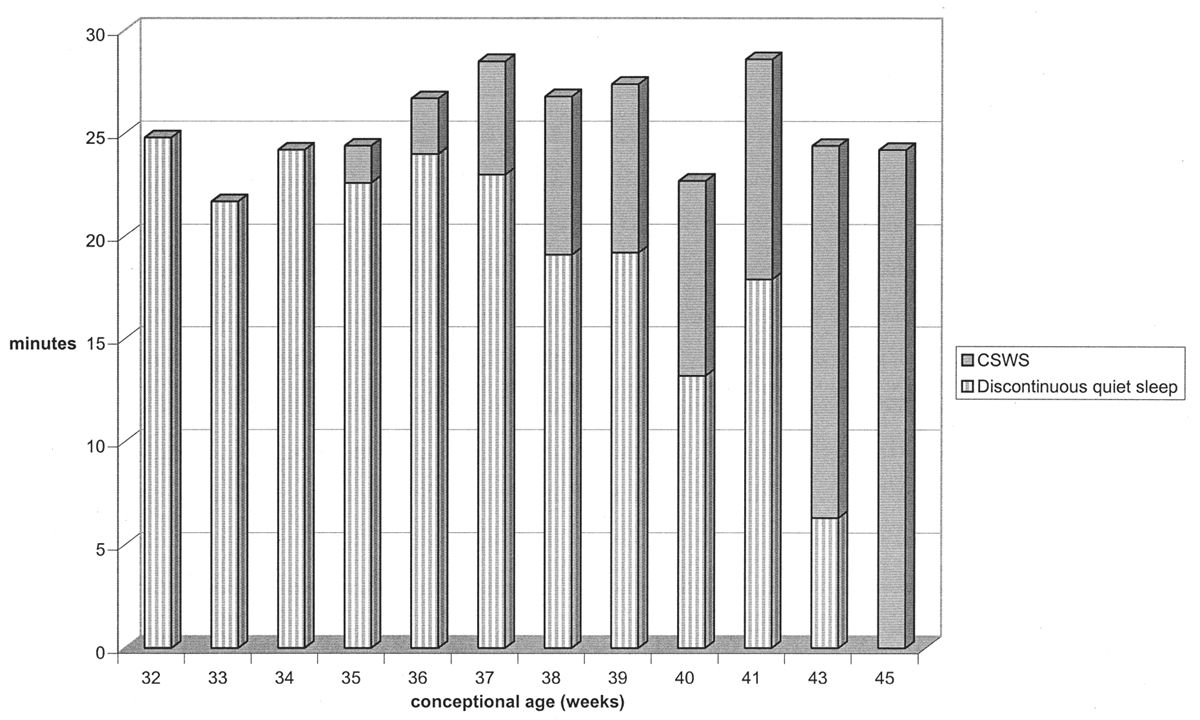
Figure 6.12: Evolution of quiet sleep from immature trace alternant to CSWS in normal infants. At 32 weeks of conceptional age, all quiet sleep is discontinuous. By 46 weeks, all quiet sleep in CSWS. (Adapted from Watanabe K, Iwase K, Hara K. Development of slow-wave sleep in low-birthweight infants. Dev Med Child Neurol 1974;16:23–31.)
This sets the stage for the EEG background that typifies quiet sleep for the rest of the life span. Trace alternant and CSWS comingle at this age. Delta brushes remain more abundant in quiet sleep than in active sleep, and the amplitude of background delta activity is highest posteriorly, an early expression of a frequency-amplitude gradient (19).
41 to 44 Weeks of Conceptional Age
In healthy infants of this conceptional age, activité moyenne continues to constitute the background during wakefulness/active sleep, whereas delta brushes gradually disappear by 44 weeks. On occasion, the awake EEG displays broad biphasic lambda waves in the occipital regions bilaterally, coincident with visual fixation. In quiet sleep, CSWS gradually replaces trace alternant, except at the onset of quiet sleep. The bursts of activity in trace alternant are well synchronized, but the IBI durations are quite brief, typically less than 2 to 4 seconds, and their amplitudes exceed 50 μV. By the end of this epoch, all of the discontinuous portions of quiet sleep have been “filled in,” and trace alternant is completely replaced by CSWS.
45 to 46 Weeks of Conceptional Age
The distinguishing characteristic of this period is the first appearance of sleep spindles in CSWS (6,20) (Fig. 6.13). Once they arise, they appear with their usual frequency (about 12 to 14 Hz) and are typically centered over the midline (Fz-Cz region), spreading to the neighboring left or right central regions (C3 or C4). In the course of the entire quiet sleep record, there are about the same numbers of sleep spindles spreading into the left and right central regions (i.e., they are symmetric), but they are not well synchronized.
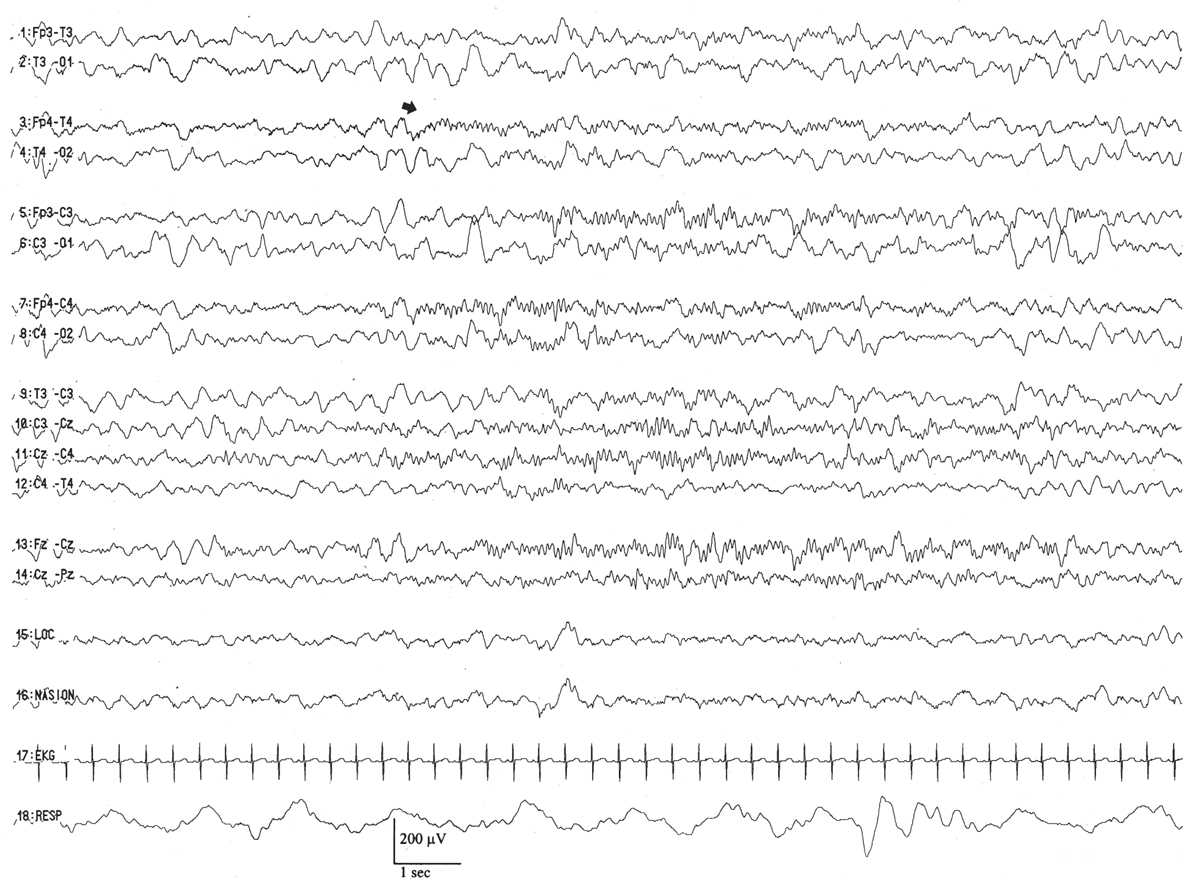
Figure 6.13: CSWS with sleep spindles in an infant 48 weeks of conceptional age with episodes of staring and stiffening. Arrow indicates sleep spindles, arising asynchronously between the two hemispheres.
Early Infancy: 46 Weeks to 1 Year
The tracé alternant pattern gradually fades away over the next 4 to 6 weeks as do frontal sharp transients and brushes. Active sleep continues to precede quiet sleep until about 3 months, at which time a quick transition will be made to non-REM sleep onset. EEGs after 46 weeks conceptional age and before 3 months of legal age are challenging to interpret because of the inherent disorganization and lack of well-defined markers. By 3 months, an anterior to posterior voltage and frequency gradient appears. Shortly thereafter, occipital rhythmic activity responsive to eye opening will appear in three-fourths of normal infants between 3 and 4 months of age. This dominant rhythm begins in a poorly sustained fashion and has a frequency of 3.5 to 4. In young children, the alpha rhythm may totally block during eye opening, so the true dominant rhythm will only be recorded with passive eye closure. Sometimes, spontaneous sustained eye closure will only occur just as the infant is about to go to sleep, and this may give a false impression of a slowed dominant rhythm due to unrecognized drowsiness. Sleep spindles will be present, as early as 4 weeks. Vertex waves will often become apparent by 3 months and are certainly found by 6 months.
From 3 months onward, the waking tracing becomes more complex and differentiated. This is perhaps most evident in the posterior head regions where the dominant rhythm becomes increasingly well modulated and maintained. By 6 months, it matures to 4 Hz, and reaches 6 Hz by the first year. Central theta rhythms are present by 6 months, and similar to the mu rhythm seen in older children and adults have an arcuate morphology. Central rhythmic theta activity may be strictly unilateral, bilateral, or shifting in character. More anteriorly, there is low-voltage fast activity clearly visible throughout the wake tracing.
By 6 months, sleep spindles and vertex waves are both present in light sleep. They are normally asynchronous at this age, but should be roughly symmetrical when comparing one side with the next. They will be more posteriorly located compared with their final mature location, and during the first year of life may occur in remarkably long monomorphic runs, sometimes covering the entire 10-second page. Another interesting and common feature of sleep recoding are the so-called cone waves—large negative occipital slow-wave transients that appear like an ice cream cone—and usually present in either side, seldom bisynchronously.
Conscious infants do not enjoy the experience of having strangers measure their head and apply electrodes. As a result, it is very common for the routine tracing to begin with ample movement and sobbing artifact. In addition to the myogenic potentials, this overbreathing will produce a buildup of diffuse or posteriorly predominate rhythmic delta activity, which should not be interpreted as pathologic. Very experienced technologists can sometimes apply electrodes with impunity, but in most circumstances, a brief period of crying is inevitable. Once the deed of connection is done, the next task is to settle the infant as quickly as possible. Here rhythmic patting artifact often becomes evident, or slower movement artifacts related to rocking. Sucking artifact is also common at this time. In a short time, the exhausted infant will often begin to slumber, giving very valuable sleep recordings. After even a brief nap, the infant appears refreshed, seems to be amnestic for the antecedent hookup event, tolerates the electrodes very well, and awake tracings can be of remarkably good quality. Infants do not apparently hold a grudge, and as a consequence, if one is patient, a very good sample of EEG can be obtained after gently waking the baby.
It may be difficult to precisely gauge how much slowing should be seen in an infant’s EEG, and this is a matter of some experience, but certainly, the degree of slowing should be very symmetric between the two sides. It is convenient to frequently compare the activity of homologous groups of electrodes, awake and asleep.
Late Infancy: 1 to 2 Years
The second year of infancy remains very active from the EEG standpoint. The posterior dominant rhythm matures so that it reaches 8 Hz by 2 years of age in most cases. Activity in the central region similarly increases in frequency, and the low-voltage fast activity in the frontal derivations remains apparent. Overall, the tracing shows increasing complexity, and the anterior to posterior voltage/frequency gradient becomes more striking. Owing to the maturation of the background, it becomes easier to find admixed focal slow activity, since the predominate activity is no longer in the delta or slow theta frequency range.
In this manner, it is important to recall that most infants show a marked increase in slow-wave activity during drowsiness, which from time to time may appear asymmetrically, and sometimes dominates a good portion of the tracing. The critical thing is not to overinterpret this slowing. A skilled technologist will recognize that the baby is drowsy, and make appropriate gentle attempts to alert the infant. Evidence of slow lateral eye movements may help to indicate drowsiness, in addition to fragmentation of the dominant rhythm. Look for portions of the tracing where there is clear motion and movement artifact indicating that the infant is more active, and spontaneous eye opening and closing. If the previously noted slowing markedly improves, it is most likely physiologic and related to unrecognized drowsiness.
Sleep architecture becomes more and more synchronized so that by 18 to 24 months sleep spindles and vertex waves are simultaneously distributed. K complexes are seen for the first time. Sleep architecture can become very sharply contoured and must be carefully differentiated from epileptiform activity. This is usually not difficult, and a few tips may be helpful: most bona fide so-called generalized epileptiform discharges have a frontal predominance in older children and a posterior predominance in very young children. Sleep architecture will be maximal at the vertex and in the frontocentral region. If in doubt, compare the topography of the patient’s sleep architecture with the discharges of concern. Generalized spikes in children with epilepsy are usually easily seen, and not solely admixed or fused with sleep architecture. If the only discharges that appear “spikey” are in combination with the sleep architecture, beware. It is most likely that these are simply sharply-contoured sleep features; if uncertainty remains, they could be mentioned in the body of the report, but should not contribute in any meaningful way to the clinical impression.
Childhood: 2 to 10 Years
The EEG tracing already has all of the major components seen in adults by the second year of life. From this point forward, there is steady maturation of the tracing, which can be highlighted by considering several domains.
The posterior dominant rhythm increases its frequency until it reaches a life maximum of approximately 10 Hz somewhere in late childhood or early adolescence. Throughout this period, it becomes progressively better sustained and modulated. Posterior slow waves of youth, which are sometimes admixed with the PDR in the immature, become progressively less obvious. These can be distinguished from pathologic slowing by their attenuation with alerting maneuvers and eye opening. Slow alpha variants, a harmonic of the usual alpha, can still occur.
By age 10 years, the EEG is very similar to that seen in adults with some exceptions. There will be a slight excess of theta activity compared with the adult and a more dramatic buildup of slow-wave activity with HV. In certain populations, photoparoxysmal responses are seen in up to 15% of normal adolescent girls, indicating that this can be an asymptomatic genetic trait with drowsiness, frontal alpha rhythms are sometimes present. Stage II sleep continues to show very sharply-contoured waveforms. Sometimes, the very first few K complexes have a notched appearance and may resemble spike waves, but in the authors’ experience, it is very rare for spike waves to appear only in this setting. Comparison of the morphology and topography with other sleep architecture later in the tracing can be very helpful. True generalized spike waves have a different spatial distribution and configuration compared with vertex waves or K complexes. If the only suspicion for spike wave is found in the first few complexes of sleep activity, it is best not to draw undue attention.
Beyond adolescence, of course, is adult life. What is noteworthy to a pediatric electroencephalographer is the incredible preservation of the fundamental EEG characteristics from this point forward, well up to senescence. There are few changes, and the EEG patterns are remarkably constant. Even healthy elderly people maintain their alpha rhythms. After the first two decades of explosive growth and dynamic changes, the EEG settles into a very reliable and predictable constancy for many decades to come. The basic rhythms once established stay entrenched to serve the primary functions of informational processing and execution of function. It is a remarkable phenomenon, and one that probably allows for more diagnostic precision or detection of subtle pathology since the degree of normal variability is markedly reduced. Once one is well trained in pediatric EEG, it is not difficult to interpret adult tracings, but the converse is not necessarily true because of the aforementioned range of normal findings as a function of age. Skilled pediatric EEG interpretation takes substantial experience.
COMPOSITION OF ELECTROENCEPHALOGRAPHIC BACKGROUND ACTIVITY (NAMED PATTERNS)
EEG background refers to the presence of all the aggregated patterns, waveforms, and frequencies that collectively constitute the ongoing cerebral electric activity. As such, it represents an infrastructure or stage that may be punctuated by fleeting EEG transients (physiological or pathological sharp waves) or electrographic seizures. The appearance and composition of the background varies with state and conceptional age, but the predominant frequencies that constitute the neonatal EEG are represented by theta and delta activity. There are, however, several specific components appearing in premature and full-term infants that warrant individual description and illustration.
Neonatal
Monorhythmic Occipital Delta Activity
This activity represents a conspicuous, stereotyped run of monomorphic, high-amplitude, surface polarity–positive, 0.5- to 1-Hz delta waves, often appearing synchronously in the occipital scalp regions (Fig. 6.14). A run of monorhythmic occipital delta activity can last from 2 to 60 seconds and appears relatively symmetrically and synchronized bilaterally. It is present at the conceptional age of 23 to 24 weeks, peaks in abundance between 31 and 33 weeks, and then significantly fades by 35 weeks. Persistence of well- developed monorhythmic delta activity after 35 weeks of conceptional age is often considered evidence of electrographic “immaturity.” This pattern represents the dominant rhythmic activity in the posterior brain regions and serves as the delta constituent of occipital delta brushes (see later discussion). This is also a sturdy rhythm in that it may persist in the presence of severe, acute encephalopathies, long after other specific patterns have disappeared.
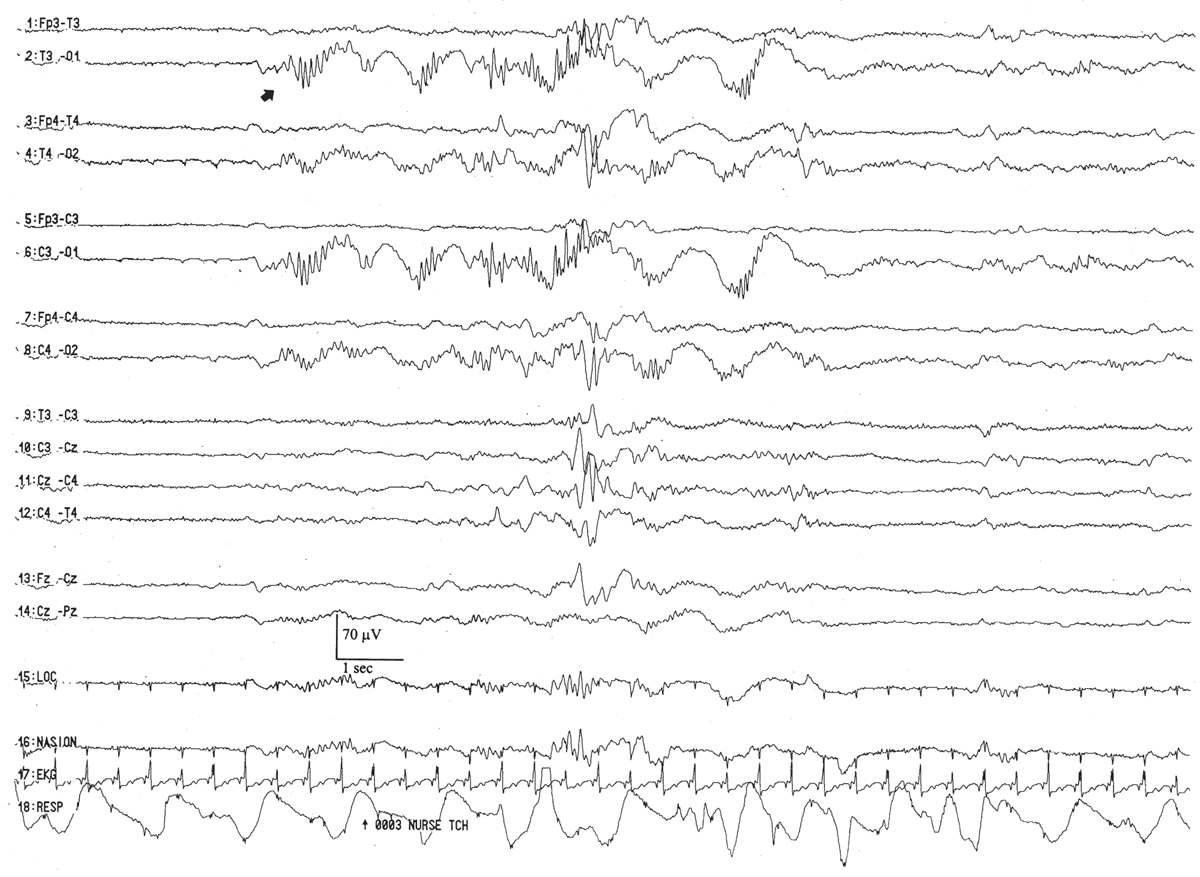
Figure 6.14: Monorhythmic occipital delta activity in an infant 31 weeks of conceptional age with apnea. Occipital delta activity with delta brushes (arrow) is present. Note that the occipital delta transients are synchronized between the two hemispheres.
Rhythmic Occipital Theta Activity
This specific pattern appears as brief (2- to 10-second) bursts of stereotyped, rhythmic, sinusoidal 4-Hz theta activity in the occipital regions (Fig. 6.15), sometimes spreading into the temporal regions. These bursts commonly mingle or superimpose on coincident monorhythmic occipital delta activity. They are present in the awake or sleeping infant and are apparent at the conceptional age of 23 to 24 weeks. They peak in abundance by 30 weeks and then fade from the occipital areas by 33 weeks; the rhythmic theta pattern migrates anteriorly to the temporal areas at older ages.
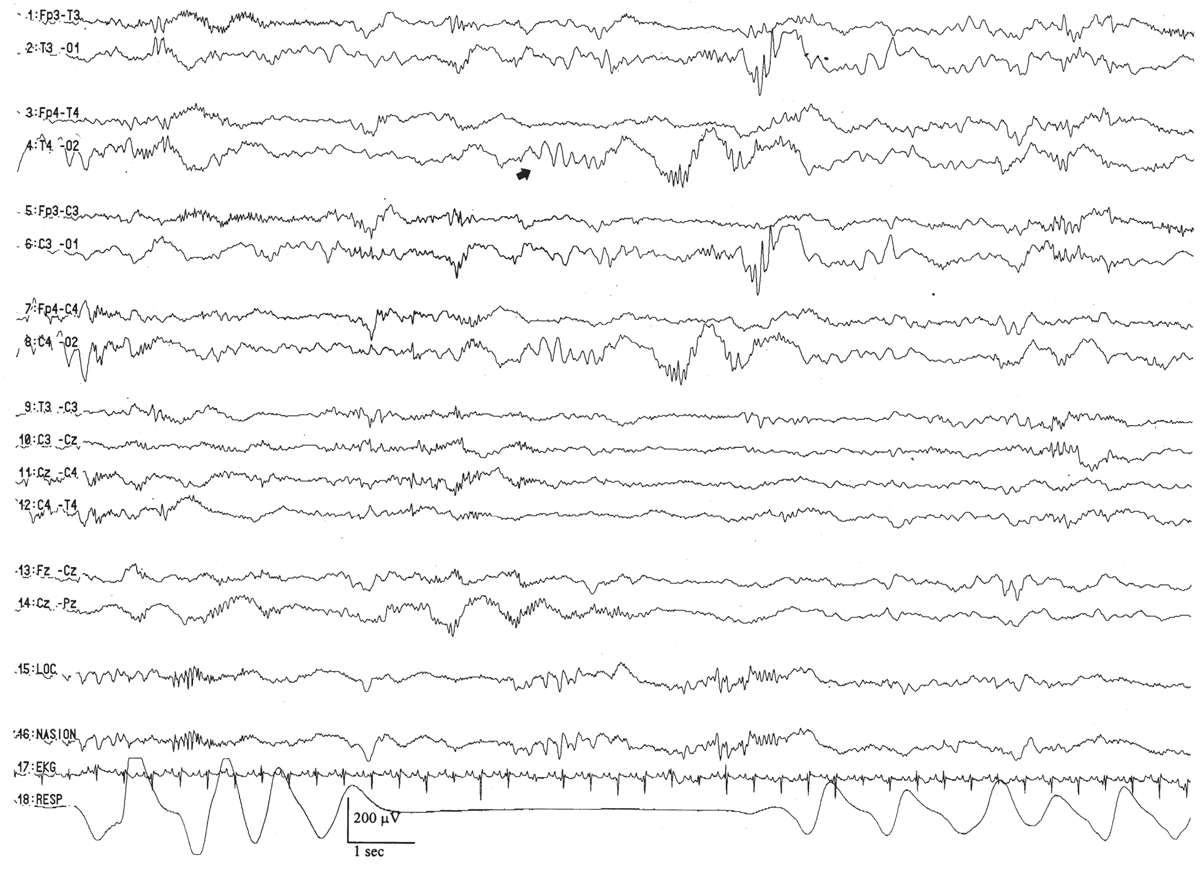
Figure 6.15: Rhythmic occipital theta activity in an infant 30 weeks of conceptional age who underwent fetal surgery for repair of myelomeningocele. Bilateral rhythmic occipital theta activity (arrow) is present, although more on the right side than on the left.
Rhythmic Temporal Theta Activity
This pattern is morphologically similar to that arising in the occipital regions. It peaks between the conceptional ages of 31 and 33 weeks. It appears as brief paroxysms simultaneously or independently in the temporal areas (Fig. 6.16). However, over a long time period, these bursts are equally represented bilaterally. They are occasionally “sharply” contoured, which raises the concern that they are a brief ictal discharge, but they do not evolve in morphology or frequency. On occasion, an abortive or larval burst of this pattern gives rise to a “sharp wave,” but close examination shows that it is merely a morphological fragment of an abbreviated run of rhythmic temporal theta activity.
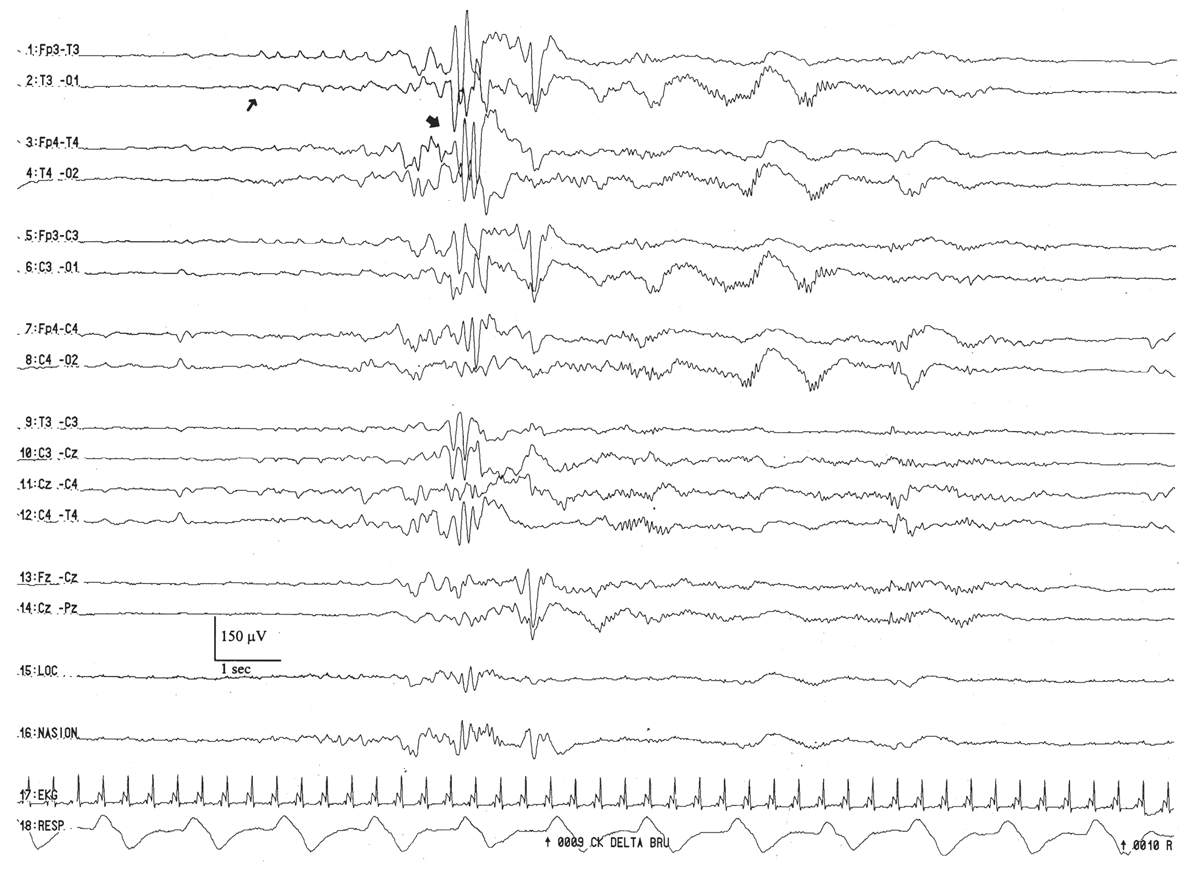
Figure 6.16: Rhythmic temporal theta activity in an infant 31 weeks of conceptional age with pneumonia. Sharply-contoured rhythmic temporal theta activity (large arrow) is present. Also, note a run of low-amplitude, positive left temporal sharp waves (small arrow), which are considered normal transients for age.
This pattern is represented by the intermittent appearance of sustained trains of conspicuous, 0.5- to 2-Hz delta activity, often with a prominent surface-positive polarity in the C3–C4 to T3–T4 areas (Fig. 6.17). They may appear semirhythmically, but they are not usually as regular and well modulated as monorhythmic occipital delta activity. This pattern serves as the delta wave foundation for rolandic and temporal brushes. It peaks by the conceptional age of 30 weeks and fades after 33 weeks.
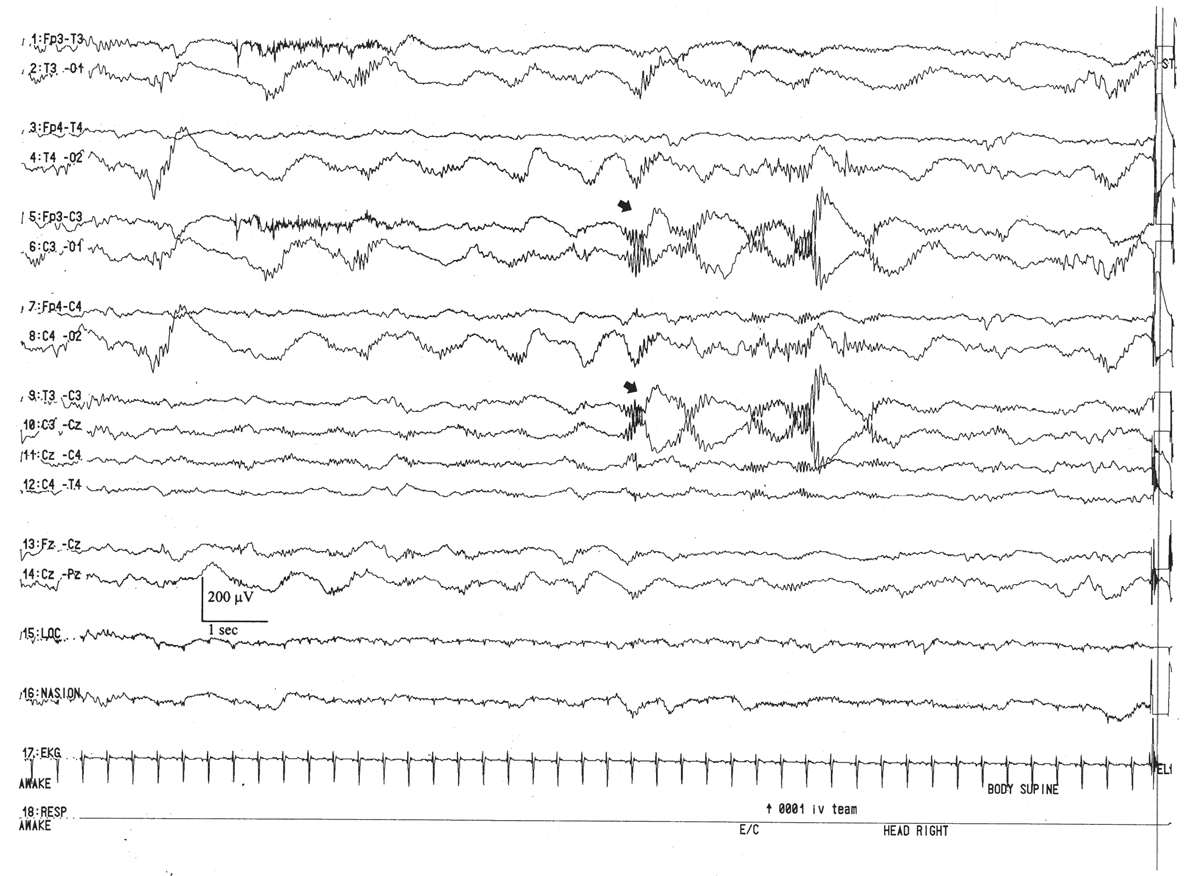
Figure 6.17: Rhythmic centrotemporal delta activity in an infant 31 weeks of conceptional age with dysmorphic facial features. Arrows indicate left centrotemporal delta activity admixed with delta brushes.
These patterns (also called “brushes,” “ripples of prematurity,” and “spindle-like fast rhythms”) are often considered the premier electrographic signature of the premature infant. The pattern is composed of a combination of a specific delta frequency transient with a superimposed “buzz” of 8- to 20-Hz activity (see Figs. 6.14 and 6.17). Brushes are symmetrically represented between the two hemispheres and homologous brain regions. They are not commonly displayed synchronously except when they arise in concert with runs of monorhythmic occipital delta activity. They appear in awake and sleeping infants, and so they should not be considered a type of precursor of the “spindle” of mature quiet sleep, which first appears around the conceptional age of 46 weeks. Up to the conceptional age of 33 weeks, there are more brushes per minute in active sleep than in quiet sleep. After the conceptional age of 34 weeks, brushes are more numerous in quiet sleep. Brushes may appear in any scalp region but are scarce in the frontal areas. In the youngest premature infants, brushes are mostly expressed in the rolandic regions. At their peak expression (during the conceptional ages of 32 to 34 weeks), they arise mostly in the occipital, central, and temporal areas. By term, brushes may still persist in immature trace alternant but have largely vanished from the awake and active sleep portions of the recording. By 1 month postterm, they are no longer in evidence.
Anterior Dysrhythmia
This pattern appears as paroxysmal, brief bursts of frontally dominant, 50- to 100-μV, semirhythmic delta activity (Fig. 6.18). Their morphological features may subtly evolve over a few seconds and acquire a sharp contour, commonly admixing and blending with a related rhythm, encoche frontale (Fig. 6.19). Runs of anterior dysrhythmia tend to arise symmetrically and synchronously between the frontal regions and may be present in all behavior states. They are most conspicuous in the transition from active to quiet sleep, but scarce in the period of active sleep immediately after quiet sleep. Despite the usual connotation of the “dys-” prefix, anterior dysrhythmia is a normal developmental electroencephalographic pattern. However, in the wake of definite encephalopathies such as hypoxia-ischemia or meningitis, its excessive presence may be considered a nonspecific electrographic abnormality (9,21,22). Marked and persistent asymmetries of their number, morphology, or amplitude may also represent an electrographic abnormality. Its counterpart pattern, frontal sharp waves (encoches frontales) are described later.
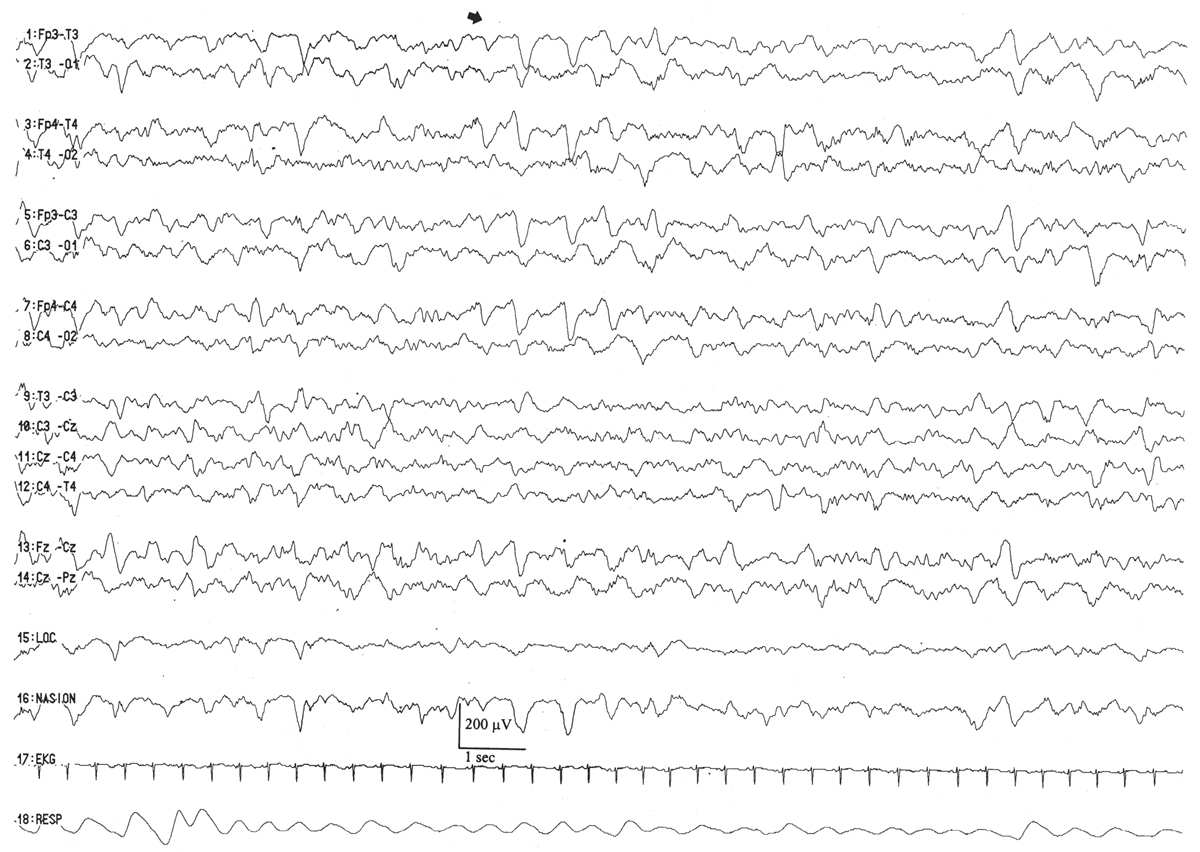
Figure 6.18: Anterior dysrhythmia in an infant 40 weeks of conceptional age with pneumonia. Bilateral frontal anterior dysrhythmia (arrow) is admixed with poorly formed encoches frontales.
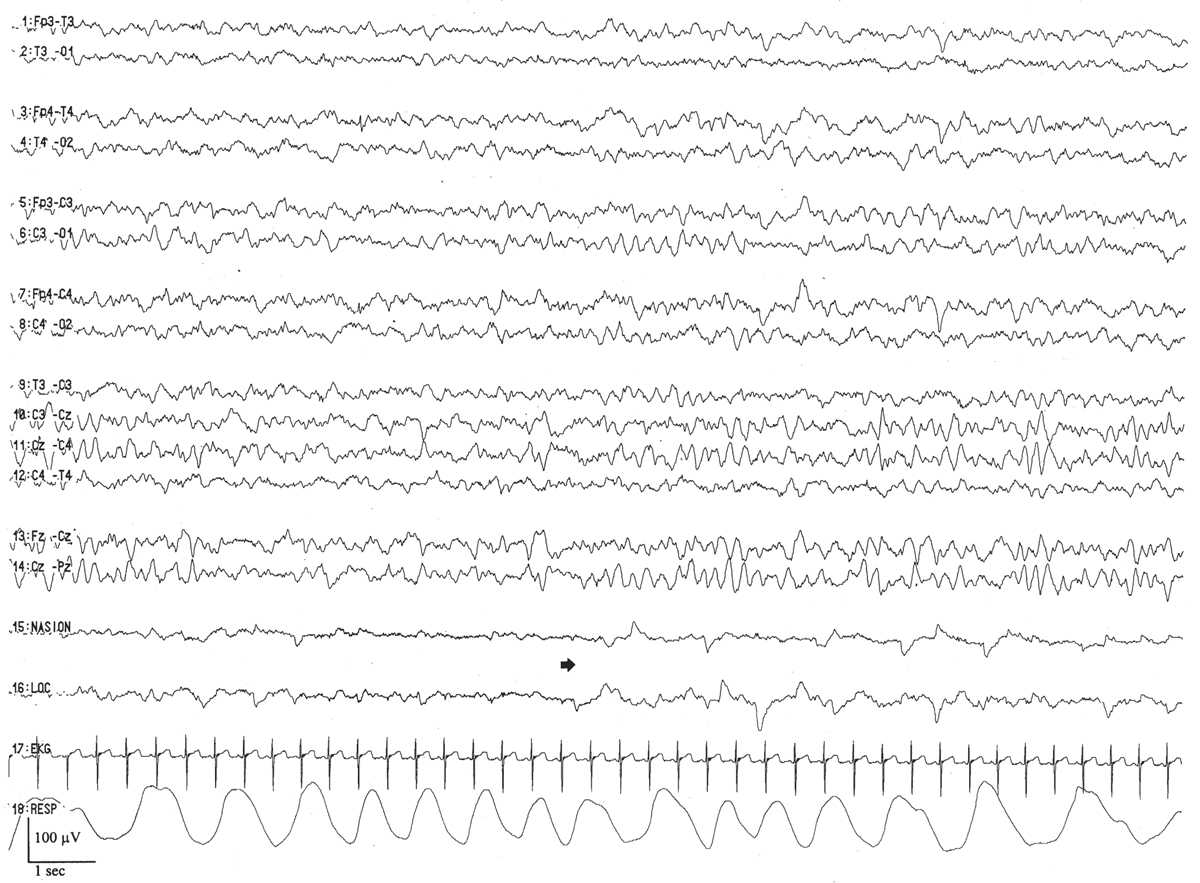
Figure 6.19: Active sleep—in the same infant as in Fig. 6.11. The tracing also consists of continuous activity of low to moderate amplitude (activité moyenne). REMs (arrow) and the lack of tonic muscle activity indicate active sleep.
Infancy and Childhood
The Alpha Rhythm
The posterior dominant rhythm is well developed in children, and its precursor can be seen in infants as early as 3 months. It is responsible for the appearance of the frequency and voltage gradient and is one of the most important objective criteria we have for judging the integrity of the overall cerebral electrical activity. For all these reasons, we discuss it first.
Frequency of the Posterior Dominant Rhythm
The normal frequency of the posterior dominant rhythm as a function of age has been studied in different populations. The findings of one representative study are shown in Fig. 6.20. An occipital rhythmic activity responsive to eye opening appears in approximately 75% of normal infants between the 3rd and 4th months after (full-term) birth. Initially, this activity is not well sustained and has a frequency of approximately 3.5 to 4.5 Hz. The frequency increases rapidly, reaching 5 to 6 Hz in approximately 70% of children by 12 months of age. At age 36 months, 82% of normal children born at full term show a mean occipital alpha rhythm frequency of 8 Hz (range, 7.5 to 9.5 Hz). By the age of 9 years, the mean alpha rhythm frequency is 9 Hz in 65% of controls; in the same percentage of persons, the mean is 10 Hz by the age of 15 (23,24).
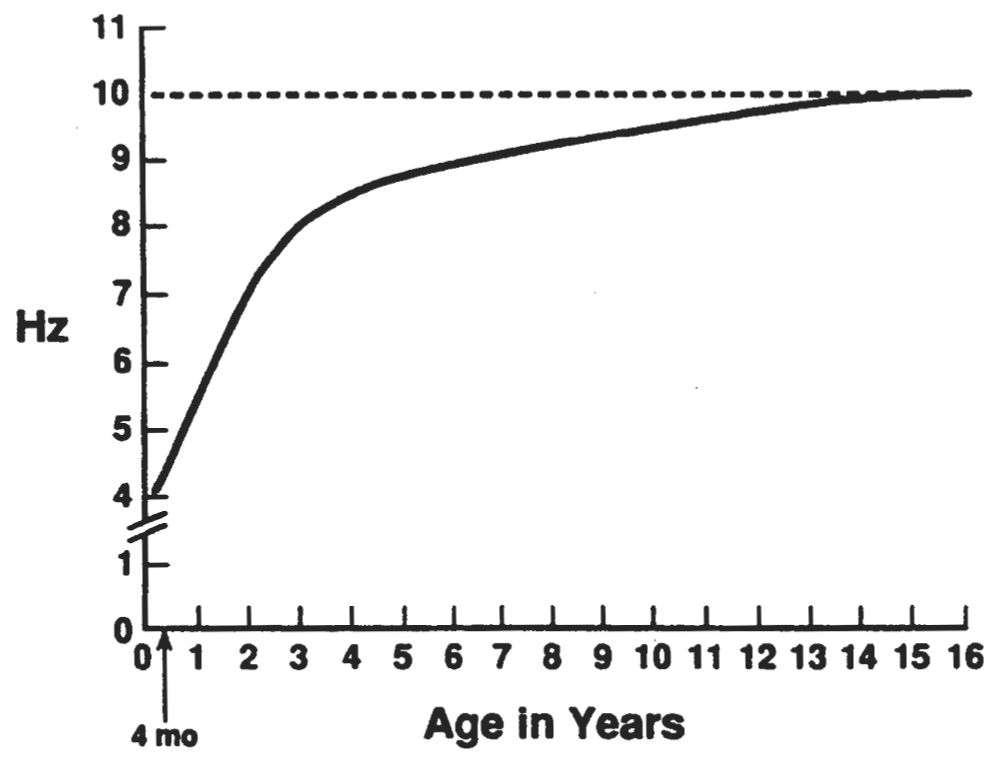
Figure 6.20: Curve showing the development of the occipital alpha rhythm between the ages of 4 months and 16 years. Some rhythmic 3- to 4-Hz activity is present in the electroencephalograms of awake infants aged 2 to 4 months, but it is not reactive to eye opening. From the time rhythmic activity that is reactive to eye opening first appears, the frequency increases rapidly, reaching 5 to 6 Hz by 12 months and 8 Hz by 36 months. At that age, there is a sharp inflection in the rate curve, and the frequency increases only 2 Hz over the next 6 years. (From Kellaway P, Noebels JL, eds. Problems and concepts in developmental neurophysiology. Baltimore: The Johns Hopkins University Press, 1989.)
Using a systematic history and neurological examination, normative EEG data were developed in Swedish schoolchildren ascertained in the late 1960s. Remarkably, the average alpha rhythm between 1 and 2 years of age was 8.5 Hz. An equally meticulous study has not been fully replicated, perhaps due to the arduous nature of the work. As a result, carefully characterized normative data in heterogeneous populations, such as those found in North America, are currently lacking. It is possible, therefore, that some of the figures commonly used for normal tracings are inaccurate for the target population.
In infants and young children, the occipital alpha rhythm may totally block with the eyes open, and slower activity may be mistaken for the occipital alpha rhythm. For this reason, a portion of the awake EEG should be recorded during passive eye closure. Infants and very young children usually do not close their eyes until they become drowsy and are ready to fall asleep; at that time, the occipital rhythm may slow before disappearing. Young children do not appreciate having their eyes closed by strangers, so it is best to ask the parent to gently close the eyes or to play a game, like peek-a-boo. In contrast to adults, it is extremely unusual for a normal child not to have a posterior dominant rhythm, assuming there is an adequate portion of the recording with eyes closed.
Voltage of the Posterior Dominant Rhythm
Petersén and Eeg-Olofsson (24), using the T5–O1 derivation, found that the average alpha rhythm voltage in children aged 3 to 15 years was 50 to 60 μV. There were no children with voltages less than 20 μV, and only 1.3% of the children had voltages of 20 to 30 μV, and all of those were older than 12 years. Approximately 9% of the children of this age group (predominantly those aged 6 to 9 years) showed alpha rhythm voltages of 100 μV or more. High voltage should never, in itself, be considered an abnormal finding. For these reasons, many laboratories will not routinely list the voltage of the alpha rhythm in their pediatric reports.
Distribution and Symmetry
The occipital region is the site of maximal alpha rhythm voltage in 95% of children (25). Likewise, in 95% of normal children, the alpha rhythm voltage has an asymmetry between sides of up to 20%. In 98% of these children, the lower voltage is on the left side, and there is no relationship to handedness. In the 5% of children with asymmetries of more than 20%, none showed a difference of more than 50%. Therefore, the same rule for adults should be used in the assessment of asymmetries in children when the low voltage appears on the right side, because the likelihood that the right side should be the high-voltage side is 98:2 (23,24).
Alpha Variants
In children, there may be harmonics of the alpha rhythm at a higher amplitude rhythm and precisely half the frequency of the posterior dominant rhythm. This phenomenon was first described by Goodwin in 1947 (26).
Posterior Slow Waves. Perhaps no EEG finding has been more misunderstood and misevaluated to the detriment of the patient than slow activity in the parieto-occipital and occipitotemporal regions. There are three simple facts considering posterior slow waves in children. First, random, occipital slow activity may be present in normal children in a wide range of waveforms, voltages, and wavelengths. Such waves are uncommon in children younger than 2 years, but they are maximally expressed (in amplitude and incidence) in children aged 8 to 14 years (see Fig. 6.21B); they occur more often in girls than in boys. They consist of moderate-voltage (defined as no more than 120% of the alpha rhythm voltage) fused waves intermixed with the alpha rhythm (which is often superimposed on them). These waves have been called polyphasic waves (23,24) or posterior slow waves of youth (2). It is common for the amplitude and incidence of posterior polyphasic waves in a child to diminish as the recording proceeds. The basis for this change is not clear; it may reflect a change in the anxiety or stress level of the child (27–36). Second, in addition to random slow waves, occipital or “posterior” rhythmic slow waves are seen in normal children (23,24). Episodic rhythmic, 2.5- to 4.5-Hz, monomorphic and polymorphic low- to moderate-voltage waves (<100 μV) occur in the parieto-occipitotemporal region (usually maximal at O1 and O2) in approximately 25% of normal awake children aged 1 to 15 years. Such activity is most prominent in those 5 to 7 years of age. Runs of this activity rarely last more than 3 seconds and are present only 2% of the time (23,24). HV generally causes this activity to become more continuous and higher in voltage. Third, except for this age-related finding, in the awake state there should be no rhythmic component in the occipital regions that has a frequency slower than that of the normal range (for age) of the occipital alpha rhythm. The foregoing is a prelude to a plea: The criteria for what is considered abnormal in children and indicative of disease or disorder must be improved.
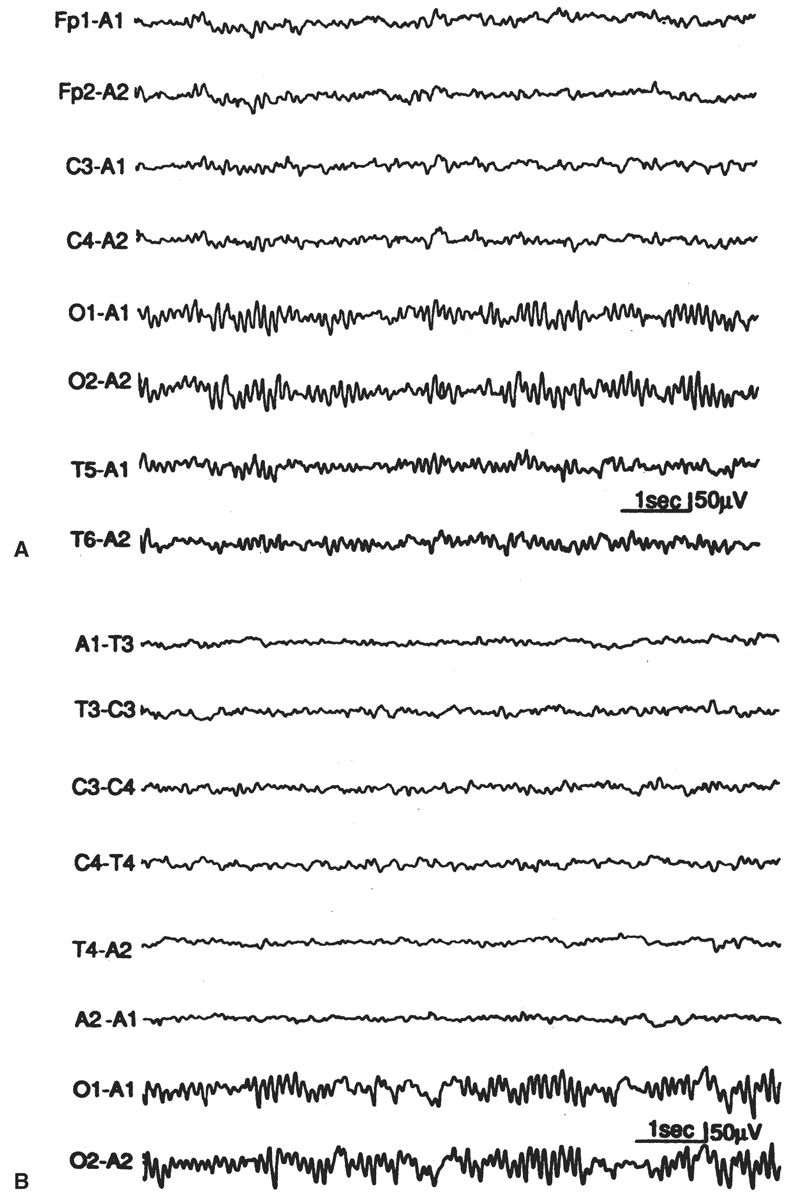
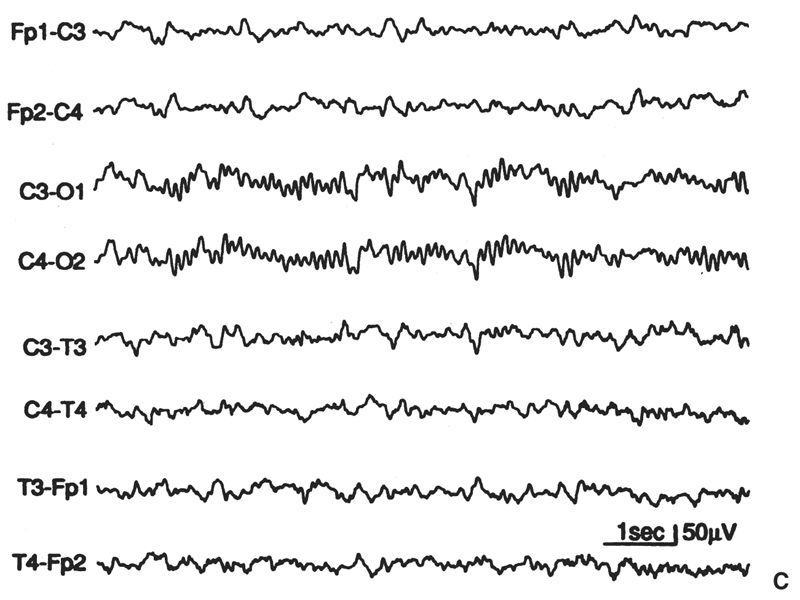
Figure 6.21: A: “Supernormal” EEG for age (10-year-old girl). Greater amounts of slow “fused” (polyphasic) activity could appear in the occipital leads, as in part B, or greater amounts on random 4- to 6-Hz moderate-voltage activity could appear in the anterior leads and yet remain within the range of normal for age. B: This EEG, from an asymptomatic boy aged 10 years, 2 months, shows greater amounts of “posterior slow waves of youth” than in part A, but has slightly smaller amounts of anterior slow activity. C: Moderately increased slow activity; random moderate-voltage, 4- to 6-Hz activity; and some slower low-voltage fused forms in anterior derivations. Occipital derivations show moderate amounts of polyphasic slow activity. The subject was 9 years, 8 months old.
Posterior Slow-Wave Transients Associated with Eye Movements. In some young children (aged 6 months to about 10 years), some eye blinks or eye movements are associated with a single monophasic or diphasic slow transient that has a duration of 200 to 400 milliseconds and an amplitude of early frequency-analysis study by Gibbs and Knott (37). This figure may be regarded as a fairly good approximation of the frequencies present and their degree of expression in various regions at different ages. It does not, however, provide information concerning the waveform of the activity, its voltage, or the manner of its occurrence (e.g., random, continuous runs), all of which are critical elements of VA and are essential to clinical evaluation of the EEG.
In evaluating the amount and duration of slow activity present in relation to the age of the patient, it is helpful to use the concept of the “ideal” EEG for each age as a standard of comparison. “Ideal” is not used to convey perfection (particularly in a clinical sense), but is, instead, employed in the platonic sense of “prototype.” The “ideal” is based on what 75% of asymptomatic children of a given age show in terms of the slow activity present in the various derivations. Approximately 5% of normal children (same age) show less slow activity than the ideal, and their EEGs more closely approximate the adult pattern (these are sometimes called “supernormal” EEGs) (23,24). Another 15% of normal children show slightly greater amounts of slow activity than the ideal, and 5% show moderately increased amounts of slow activity. These general concepts have been adopted, modified, and expanded by the authors’ colleagues and collaborators in Sweden and underlie their categorizations of “slightly increased slow” and “moderately increased slow” (23,24). These benchmark papers of Eeg-Olofsson and Petersén provide the essential data on which the kind of mental template required for the evaluation of children’s EEGs can be developed.
Eeg-Olofsson and Petersén (23,24) rated the amount of nonrhythmic (random) slow activity in the EEGs of children in their normal series as “minute,” “normal,” “slightly increased (SIL),” and “moderately increased (MIL)” for age. Of their highly selected healthy children, approximately 87% had random slow activity in an amount rated as normal for age. Approximately 8% had lesser amounts of slow activity than this, and 4.3% had slightly greater amounts of nonrhythmic slow activity; in 0.5% of the series, the random slow activity was MIL. This compares with the concept of the “ideal” EEG and the range of normal variation that was developed from studies of asymptomatic but not highly selected children. Eeg-Olofsson and Petersén found that the incidences of SIL and MIL were greatest in children between 6 and 11 years of age and were significantly higher in girls than in boys (9).
Comparison of Eeg-Olofsson and Petersén’s prototypic EEG samples of “normal,” “SIL,” and “MIL” slow activity with the authors’ own prototypes indicates that the highly selected healthy children in the Gothenburg series (23,24) showed lesser amounts of random slow activity than did the authors’ unselected asymptomatic children. If the criteria offered by the Gothenburg study of highly selected children are used as a basis of interpretation in routine clinical practice, considerable caution must be exercised in categorizing an EEG of a given child as “outside” the range of normal variation; care should be taken here because the “pathological” significance of an abnormal EEG, which is too readily equated with brain “damage” (or, at best, “dysfunction”), is often based on simplistic reasoning. The talent of the clinical electroencephalographer is measured not so much by an ability to make a VA of the tracing but by an ability to determine what the findings mean in a particular patient under particular circumstances in relation to a particular clinical history. The characteristics of the EEG are determined by numerous influences, not the least of which may be the uniqueness of the laboratory environment. Factors that determine the characteristics of an individual’s EEG at any time are discussed in the final section of this chapter. It is beyond the scope of this chapter to attempt to convey the “ideal” and the “range of normal variation” for each age. Figure 6.21 illustrates the concept for a single age level.
Mu Rhythm
The mu rhythm 6 is a central rhythm of alpha activity frequency (usually 8 to 10 Hz) (Fig. 6.22) in which the individual waves have an arch-like shape. It has been reported to be less common in children, with reported rates of only 5% of normal children younger than 4 years, and 7% between 8 and 16 years, but it is worth noting that these figures derive from EEG work in the 1960s when it was common to have half of the commonly used numbers of channels (23,24). As a result, good portions of these recordings were performed with just temporal lead coverage. In the authors’ experience, mu is actually very commonly seen in pediatric tracings, with its precursor visible in many tracings as early as 6 months.

Figure 6.22: Episode of mu rhythm occurring during a period when the eyes are open and the occipital alpha rhythm is blocked. EEG of asymptomatic 25-year-old woman. Mu-rhythm asymmetries of this degree are not uncommon in normal subjects.
In infants whose occipital alpha rhythm is still less than 6 Hz, a well-organized and fairly well-sustained 8- to 10-Hz activity may be present in the central regions bilaterally. It lacks the characteristic waveform of the mu rhythm but may be ontogenetically related to it. This activity was originally described by Pampiglione in 1977 (38):
In the rolandic area of each hemisphere and at the vertex some rhythmic activity kept on appearing in most infants, at somewhat irregular intervals, in the form of 8–10 per sec waves of the order of 20–40 microvolts, with variable lateralization, often occurring independently over the right or the left side. … This activity would often diminish or disappear altogether when the baby used his hands or played with toys, but it would increase when the baby was at rest with his arms and hands relaxed. … Distribution, frequency and behavior were similar to those of the mu rhythm in older children and adults.
Beta Activity
Activities with frequencies higher than 13 Hz are commonly present in the EEGs of normal children. Three distinct frequency bands in the beta activity range may be distinguished: a common 18- to 25-Hz band, a less common 14- to 16-Hz band, and a rare 35- to 40-Hz band. In 97% to 98% of normal awake children, the voltage in the EEG is less than 20 μV; in 70%, it is 10 μV or less (recorded between closely spaced scalp electrodes) (24,25).
Beta activity with a voltage of 25 μV or more in the clinical EEG has been considered abnormal. Although such findings are statistically outside the range of normal variation, little is known about the significance of beta activity. The early literature documents a significantly higher percentage of “fast” EEGs in patients with epilepsy than in normal controls, but it has subsequently been shown that fast EEGs have no correlation with epilepsy in children (39–43).
As in adults, many commonly used drugs (e.g., barbiturates, benzodiazepines, chloral hydrate) and skull defects may increase the amplitude, and thus apparently the amount, of beta activity (44,45). Because the incidence of beta rhythms with amplitudes much above 20 μV is statistically low in normal persons, the presence of such activity suggests the possibility of drug ingestion. Although the 18- to 25-Hz band is the one most generally affected, some drugs also increase the 14- to 16-Hz activity.
Beta activity of 18 to 25 Hz usually increases in amplitude during drowsiness, light sleep, and REM sleep, and it usually decreases during deep sleep. When a barbiturate or other beta-enhancing drug is administered to promote sleep during the EEG examination, the resultant fast activity increases with the onset of light sleep, decreases markedly during deep sleep, and then remains prominent after the patient is aroused. This effect of sedation is particularly pronounced in children.
Beta activity should have the same frequency on both sides. However, even in normal persons, there may be a voltage asymmetry, with the activity being as much as 35% lower on one side. Such asymmetries may result from differences in skull thickness, as described earlier for the alpha rhythm. On the other hand, a consistently low voltage on one side (>35%), whether focal, regional, or hemispheric, is often a useful diagnostic feature; it indicates cortical injury (e.g., acute contusion, acute ischemia, or the presence of a subdural or epidural fluid collection). Focal, regional, or hemispheric depression of beta activity may also occur transiently after a focal epileptic seizure. Beta activity is generally the first to show diminished voltage in the presence of a cortical injury or subdural or epidural fluid collection; therefore, its presence on the low-voltage side can be helpful in assessing the significance of a voltage asymmetry of other background activity in the same region (if the asymmetry is borderline in degree). In this regard, it must be remembered that beta activity amplitude is particularly susceptible to the presence of subgaleal fluid, and special care should be taken by the technologist to note the presence of scalp swelling: its location, extent, and degree.
Beta activity in the 14- to 16-Hz band is usually most marked in the frontocentral region, but may show maximum voltage elsewhere, even in the occipital region. The location of the maximum potential field does not appear to have particular physiological or pathophysiological significance. Beta activity in this band, when present, is usually enhanced by HV and indeed may become clearly evident only during this activity. It may be present during sleep, but should be distinguished from sigma activity, which, by definition, occurs only in bursts.
Theta Activity
Frontal and Frontocentral Theta Activity
Stay updated, free articles. Join our Telegram channel

Full access? Get Clinical Tree


