Fig. 54.2 Right bundle branch block (RBBB). Sinus rhythm, normal P wave, PR interval, QRS shows left axis deviation (positive in lead I, negative in II, III). Lead V1 shows a rsR′ pattern with a very prominent late positive deflection, pathognomonic of full RBBB. The axis deviation here indicates blockage of the left anterior hemi-fasicles of the left bundle as well, i.e. this ECG shows bifascicular block.
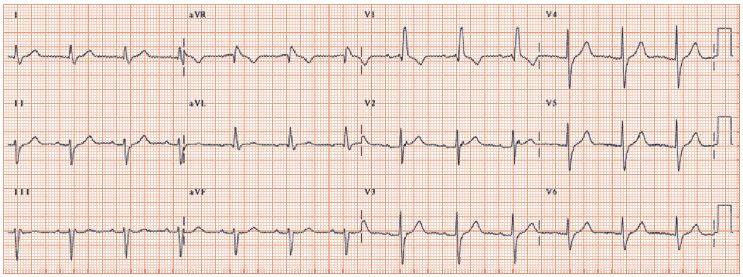
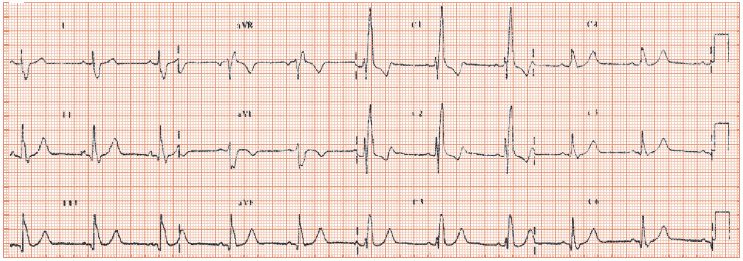
Fig. 54.3 Sinus rhythm, normal P wave, PR interval, QRS shows right axis deviation, (+122°), full RBBB with rsR′ pattern in lead V1, very large late positive deflection in lead V1, suggesting in addition to RBBB, that right ventricular hypertrophy (RVH) is present. Inverted T’s leads V1 and V2, due to RBBB. The QRS axis deviation is either due to RVH or to a block of the right posterior hemi-fascicular branch of the left bundle.
There are several forms of right bundle branch block (RBBB): partial, full and isolated, full and associated with disease elsewhere in the conducting tissue.
ECG appearances of isolated full RBBB
The ECG appearances of RBBB are dominated by the late activation of the right ventricle, leading to a late positive deflection in the right-sided leads, principally lead V1 (Fig. 54.1). This leads to the formal definition of full RBBB as: (i) QRS duration > 120 ms; (ii) PQ interval > 120 ms (i.e. no Wolff–Parkinson–White); (iii) rSR′ in lead V1 or V2; and (iv) S waves in lead I and either lead V5 or V6.
ECG findings in partial RBBB
Stay updated, free articles. Join our Telegram channel

Full access? Get Clinical Tree


