Fig. 15.2 An ECG showing flat T waves. This ECG shows multiple abnormalities – there are generally flat T waves throughout all the leads, with only V2 and V3 having anything approaching a normal T wave. There are deep Q waves in lead III and aVF, suggestive of an old inferior wall myocardial infarct, and the QRS complexes in the chest leads are rather small (which could reflect obesity or old infarction in the anterior territory as well). There are frequent ventricular ectopics, seen on the lead II rhythm strip at the bottom to all be the same morphology (i.e. to originate from the same electrophysiological substrate). There are various interpretations of this ECG. In addition to old infarction (inferior Q’s, anterior loss of R wave, which may indicate obesity). The T wave flattening is widespread, and may reflect low K+, widespread coronary artery disease or left ventricular dysfunction from any other cause. The ectopics may reflect low K+ in the setting of structural heart disease, or the structural heart disease itself.
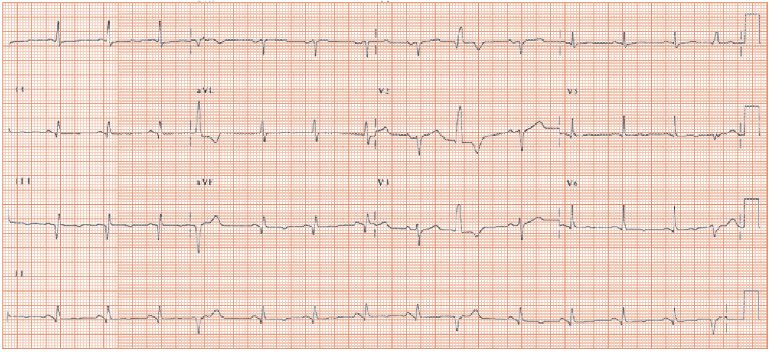
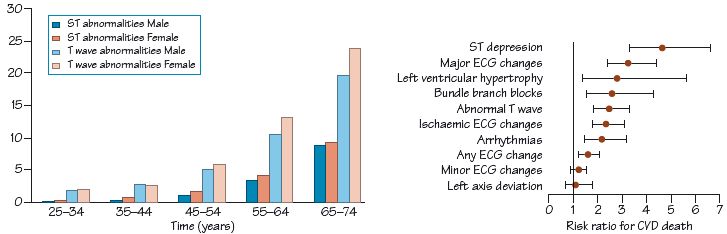
Fig. 15.3 Incidence and consequence of major and minor ECG abnormalities in epidemiological studies. ST and T wave incidence rises with age, and shows no sex dependence. CVD, cardiovascular disease.
Flattening of the T wave is one of the commonest ECG abnormalities – establishing the underlying diagnosis is a good test both of ECG reading skills and competence as a diagnostician!
Stay updated, free articles. Join our Telegram channel

Full access? Get Clinical Tree


