Hemodynamic measurement is an integral part of the complete left- and right heart catheterization procedures.1 These data help cardiologists to establish the diagnosis in many complex cases. The correct measurements and interpretation of the obtained hemodynamic data (Table 11.1) are crucial.
TABLE 11.1General rules in reading pressure tracings.
1.Identify the cardiac rhythm. 2.Determine the pressure scale. 3.Note recording speed. 4.Obtain a simultaneous ECG tracing to time the pressure tracings. 5.Interpret the waveforms in conjunction with the clinical presentation. 6.Identify common pressure artifacts such as “underdamping” or “overdamping”. 7.Correctly place the transducer at zero position. |
The normal RA waveform consists of 3 positive and 3 negative waves (Figure 11.1A). Positive waves are termed: “a”, “c”, and “v”. The negative waves are termed: “x”, “x′”, and “y”. The “a” wave represents atrial contraction. It can be observed around 80 ms after the peak of the “P” wave on ECG, and its amplitude depends on the strength of RA contraction and RV compliance. In general, the “a” wave is slightly higher than the following “c” wave, which normally represents the upper motion of the floor of the tricuspid valve during isovolumic RV contraction with subsequent increase of RA pressure. The “c” wave contributes to the formation of “x” and “x′” negative waves and corresponds to the “R” wave on the ECG. The “v” wave peaks normally during the last third of the “T” wave on ECG and corresponds to passive RA filling during ventricular contraction. The initial “x” wave, ending prior to the “c” wave, corresponds to RA relaxation and its early filling; on the other hand, the “x′” wave, which follows the “c” wave, corresponds to RA downward movement during early RV systolic motion. The negative “y” wave follows the positive “v” wave and corresponds to RA passive emptying into the RV during ventricular diastole. The mean RA pressure corresponds to the midpoint between the peaks of “a” and “v” and nadirs of “x′” and “y” waves. This value provides information on the right ventricular preload.
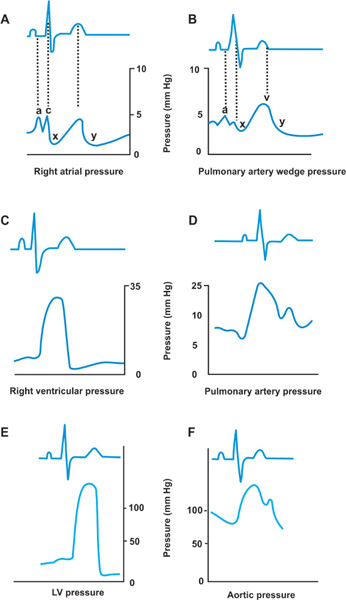
FIGURE 11.1Normal pressure waveforms obtained during right and left heart catheterization are shown. Panel A: Normal RA waveform consists of 3 positive and 3 negative waves. Panel B: The PAW pressure tracing. Panel C: Normal RV pressure tracing. Panel D: Normal PA pressure tracing. Panel E: Normal LV pressure tracing. Panel F: Normal aortic pressure tracing.
The PAW pressure tracing (Figure 11.1B) in general represents the events occurring in the LA, and reflects the same changes in LA pressure as the ones observed on RA pressure tracings described above. Transmission of the LA pressure through the pulmonary venous system causes slight (around 220 ms) delay of the PAW pressure waves in relation to directly obtained LA pressure waves and in relation to the ECG waves. So the “a” wave frequently corresponds to the “R” wave on ECG, the “c” wave to the beginning of the “T” wave, and the “v” wave, which is greater than “a”, projects on a late “T-P” interval. This is usually not clinically significant, but becomes more important in simultaneous pressure measurements for mitral valve gradients. The normal RV and LV pressure tracings (Figures 11.1C and E) represent a positive, monophasic systolic wave with an occasional early systolic notch, a negative, sharp, early diastolic filling wave followed by a positive wave of passive ventricular filling, and subsequently active atrial “kick”.
Interpretation of Right and Left Heart Pressure Tracings
The end-diastolic pressure is taken in the trough after the atrial “kick.” Another notch can be seen on the early diastolic filling wave of the LV and RV called incisura, which represents closing of aortic and pulmonary valves. In normal conditions, the RV end-diastolic pressure is lower than the corresponding LV end-diastolic pressure, since the RV is a more compliant chamber. The normal PA and aortic pressure tracings (Figures 11.1D and F) reflect transmitted systolic RV and LV pressures plus diastolic pressure waves, the amplitude of which depend on pulmonary and systemic vascular resistance. Under normal conditions, the PA and aortic diastolic pressures are higher than the corresponding RV and LV end-diastolic pressures, so that PA and aortic pressure tracings are characterized by transition to a smaller pulse pressure with equivalent corresponding systolic pressures.
Cardiac Output Measurement
Two of the most commonly used methods of determining cardiac output, the thermodilution method and the Fick oxygen method, are based on the principle described by Adolphus Fick in 1870, which states that the rate of delivery to or withdrawal of a substance from the circulation is equal to the product of blood flow and the difference in concentration across the point of delivery or withdrawal. Cardiac output is usually expressed in liters/minute.2 The cardiac index (CI) equals CO divided by the patient’s body surface area (BSA). Normal range of CI is 2.6–4.2 L/min/m2. A CI less than 1.0 L/min/m2 is generally incompatible with life.
THERMODILUTION METHOD
The pulmonary artery catheter is used to calculate CO with the thermodilution method. It contains a separate lumen for injecting saline, which terminates proximally (usually positioned in the RA) to the distal end of the catheter (Figure 11.2). The distal end of the catheter is placed in the pulmonary artery and contains the temperature sensor. Applying the Fick principle, the operator uses a fixed volume (10 mL) of cold normal saline as a substance injected smoothly but rapidly over 2–3 seconds and measures the concentration (temperature difference between saline and blood) of this substance downstream, determining CO from the concentration–time curve.
Stay updated, free articles. Join our Telegram channel

Full access? Get Clinical Tree


