The aim of the study was to assess the significance of renal translesional pressure gradients in predicting improvement in resistant hypertension after stenting for moderate renal artery stenosis (RAS). In 37 patients with RAS and resistant hypertension subjected to renal stenting, translesional pressure gradients both at rest and hyperemic were measured using a pressure guidewire. Twenty-four-hour ambulatory blood pressure measurements were performed in all patients on admission and 3 months after the intervention. Angioplasty was successful in all patients, with reduction of artery diameter stenosis from 60 ± 12% to 10 ± 6% (p <0.0001). At 3 months, with maintained hypotensive agents (4.0 ± 1.4 vs 4.0 ± 1.6), significant reductions in systolic blood pressure (SBP) and diastolic blood pressure were noted (−5 and −2 mm Hg, respectively). In multivariate analysis, the mean baseline gradient (MBG) was the only independent predictor of improvement in SBP (regression coefficient 0.292; standard error 0.11; p value 0.014). In the receiver operating characteristic curve analysis, MBG had a larger area under the curve than other parameters, and the MBG >22 mm Hg had the highest sensitivity, specificity, and accuracy (50%, 95%, and 0.74%, respectively) in predicting hypertension improvement after stenting. In patients with MBG >22 mm Hg, SBP decreased by 12 versus 3 mm Hg (p <0.01) in patients with MBG ≤22 mm Hg, whereas diastolic blood pressure in both groups decreased by 3 versus 1 mm Hg, respectively (NS). In conclusion, MBG value of >22 mm Hg provides the highest accuracy in predicting hypertension improvement after stenting for moderate RAS in patients with resistant hypertension.
The usefulness of renal artery angioplasty as one of the methods of treating arterial hypertension caused by renal artery stenosis (RAS) despite its high procedural efficacy remains under discussion. A few randomized clinical studies conducted to date have not indicated a clear advantage of revascularization over optimal medical treatment. Although poor correlation of angiographic images and the hemodynamic significance of the alteration was well known, the angiography was selected as the key criterion for the assessment of stenosis in renal arteries and, thus, for stenting qualification. This was probably one of the main causes of the unsatisfactory clinical efficacy of invasive procedures. In recent years, translesional pressure gradient (TPG) measurement was reported as a useful method in the identification of patients in whom angioplasty might lead to an improved control of arterial hypertension. The aim of this study was to assess whether measuring TPG, both at rest and hyperemic, in patients with resistant hypertension and moderate RAS might allow the identification of patients who would benefit from the stenting procedure.
Methods
The study conducted in 2 centers included 37 consecutive patients with resistant hypertension and RAS, angiographically categorized as moderate (50% to 70%). All patients signed the informed consent form, and the study protocol was approved by local ethic committees. Resistant hypertension was defined as randomly measured values of arterial blood pressure exceeding the guideline values for diabetic and nondiabetic patients (>140/90 and >130/80 mm Hg, respectively), despite the use of ≥3 hypotensive medications, including a diuretic. All patients were subjected to ambulatory blood pressure measurements before and 3 months after the angioplasty procedure. Concurrently, analysis of kidney function and surveillance of antihypertensive medications were performed. Maintaining the hypotensive therapy administered before the intervention was a prerequisite of the study. The Cockroft-Gault formula was used to calculate creatinine clearance. Renal dysfunction was identified at a creatinine clearance <90 ml/min. Patients with creatinine clearance <30 ml/min, cirrhotic kidney, and accessory renal arteries were excluded from the study.
Analysis of the angiographic significance of RAS was conducted off-line by a skilled analyst using a digital system of image analysis (Innova 2000; General Electric, New York, New York). Once angiographic images were obtained, a pressure-sensing catheter (PressureWire Certus; RADI, Uppsala, Sweden) was advanced into the renal artery. After calibration, the PressureWire device was placed distal to the stenosis to assess distal pressure (Pd). Aortic pressure (Pa) was measured as usual, through the guiding catheter, after its disengagement from the artery ostium to prevent pressure damping. After baseline measurements, hyperemic pressure was recorded. Hyperemia was induced using an intra-arterial bolus injection of dopamine (50 μg/kg). Systolic, diastolic, and mean pressure gradients and the Pd/Pa ratio were analyzed, both at baseline (systolic baseline gradient [SBG], diastolic baseline gradient [DBG], and mean baseline gradient [MBG] and baseline Pd/Pa, respectively) and after hyperemia stimulation (hyperemic systolic gradient [HSG], hyperemic diastolic gradient [HDG], and man hyperemic gradient [MHG] and hyperemic Pd/Pa, respectively).
A standard approach to the procedure was used, with mandatory stenting of the renal artery. An embolic protection device was not used in the procedures. Angiographic success was identified as residual stenosis of <30% without flow impairment.
Three-month observation period was assessed using paired t test value or Wilcoxon paired test, depending on the normality of data. Correlation between data was calculated using Pearson’s r or Spearman’s ρ coefficient. Multivariate analysis was performed using multivariate regression modeling with stepwise elimination of nonsignificant variables. The area under the receiver operating characteristic curve was used to analyze diagnostic capabilities of variables on blood pressure. Statistical analysis was performed with R for Windows, version 2.15.1 (The R Foundation for Statistical Computing, Vienna, Austria) and MedCalc for Windows, version 12.3 (MedCalc Software, Mariakerke, Belgium). The differences were considered significant at p <0.05.
Results
Baseline parameters and angiographic data of all 37 patients are listed in Table 1 . Procedural success was obtained in all cases. None of the patients demonstrated a significant aggravation of renal function in the follow-up. Measurements of TPG were conducted in all patients. Values obtained after hyperemia induction were significantly higher than those in baseline conditions. The results of pressure gradient measurements are listed in Table 2 .
| Variable | Study Population (n = 37) |
|---|---|
| Age (yrs) | 67 ± 12 |
| Men (%) | 18 (49) |
| Twenty-four-hour ABPM (mm Hg) | |
| Systolic | 141 ± 14 |
| Diastolic | 73 ± 10 |
| Renal insufficiency (%) | 25 (67) |
| Creatinine clearance (ml/min) | 85 ± 27 |
| Diabetes mellitus (%) | 15 (40) |
| Artery stenosis (%) | |
| Prestent | 60 ± 12 |
| Poststent | 10 ± 6 |
| Procedural success rate (%) | 37 (100) |
| Pressure Gradient (mm Hg) | Baseline | Hyperemic | p |
|---|---|---|---|
| Systolic gradient | 40 ± 27 | 56 ± 25 | <0.001 |
| Diastolic gradient | 6 ± 8 | 9 ± 10 | <0.001 |
| Mean gradient | 17 ± 16 | 23 ± 17 | <0.001 |
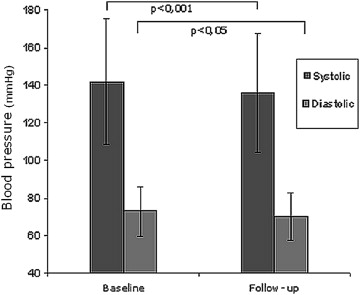
The entire study population was subjected to a 3-month observation. In the follow-up, values obtained in the 24-hour blood pressure measurement were significantly lower for both systolic blood pressure (SBP) and diastolic blood pressure (DBP) compared with the preprocedural values ( Figure 1 ). The mean decrease in SBP and DBP was 5 and 2 mm Hg, respectively.

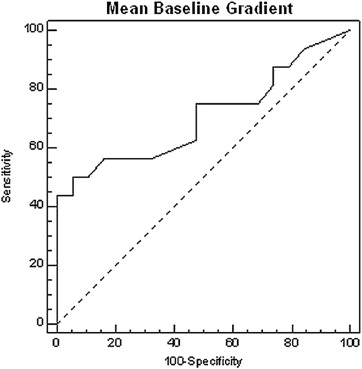
Univariate analysis demonstrated that the MBG, MHG, baseline Pd/Pa, and hyperemic Pd/Pa values were significantly correlated with the decrease in arterial blood pressure. The preprocedural diameter stenosis values did not correlate with blood pressure decrease in the follow-up (correlation coefficient 0.510; p value 0.13). Multivariate analysis revealed that MBG was the only independent predictor of a SBP decrease above average for the entire study population (regression coefficient 0.292, standard error 0.11; p value 0.014) The receiver operating characteristic curve analysis demonstrated that the area under the curve for the MBG parameter was the largest among the analyzed parameters in predicting a decrease in blood pressure above average for the entire study group. Moreover, an MBG value of 22 mm Hg was the optimal cut-off point to predict a decrease in blood pressure after stent implantation (with 50% sensitivity and 95% specificity; Figure 2 ).


