This study sought to evaluate the impact of race/ethnicity on cardiovascular risk factor control and on clinical outcomes in a setting of comparable access to medical care. The BARI 2D trial enrolled 1,750 participants from the United States and Canada that self-reported either White non-Hispanic (n = 1,189), Black non-Hispanic (n = 349), or Hispanic (n = 212) race/ethnicity. Participants had type 2 diabetes and coronary artery disease and were randomized to cardiac and glycemic treatment strategies. All patients received intensive target-based medical treatment for cardiac risk factors. Average follow-up was 5.3 years. Kaplan-Meier survival curves and Cox proportional hazards regression models were constructed to assess potential differences in mortality and cardiovascular outcomes across racial/ethnic groups. Long-term risk of death and death/myocardial infarction/stroke did not vary significantly by race/ethnicity (5-year death: 11.0% Whites, 13.7% Blacks, 8.7% Hispanics, p = 0.19; adjusted hazard ratio 1.18 Black versus White, 95% confidence interval 0.84 to 1.67, p = 0.33 and 0.82 Hispanic versus White, 95% confidence interval 0.51 to 1.34, p = 0.43). Among the 1,168 patients with suboptimal risk factor control at baseline, the ability to attain better risk factor control during the trial was associated with higher 5-year survival (71%, 86% and 95% for patients with 0 or 1, 2, and 3 factors in control, respectively, p <0.001); this pattern was observed within each race/ethnic group. In conclusion, significant race/ethnic differences in cardiac risk profiles that persisted during follow-up did not translate into significant differences in 5-year death or death/MI/stroke.
The Bypass Angioplasty Revascularization Investigation 2 Diabetes (BARI 2D) clinical trial was undertaken to compare treatment strategies for patients with both type 2 diabetes mellitus and stable coronary heart disease in the presence of intensive risk factor control. Neither all-cause mortality nor major cardiovascular events, defined as the composite end point of death, myocardial infarction, and stroke, differed among the randomized treatment strategy groups in the overall trial. At study entry, self-reported race/ethnicity predicted important differences in demographic, clinical history, biochemical parameters, and burden of coronary artery disease (CAD) among patients with long-standing type 2 diabetes mellitus enrolled in the BARI 2D trial. Given the systematic approach of risk factor control with intensive medical therapy for all study participants, we hypothesized that race/ethnic disparities in risk factor control would be attenuated during follow-up. We also postulated that although race/ethnicity would be an important determinant of long-term clinical outcomes among patients treated in the BARI 2D study, the observed disparities in outcome would be explained by differences in baseline risk factors and burden of CAD. Thus, in the setting of comparable access to intensive medical care and treatment of cardiac risk factors, we sought to evaluate the impact of race/ethnicity on long-term risk factor control and cardiovascular outcomes among patients with both type 2 diabetes mellitus and documented stable CAD enrolled in the BARI 2D clinical trial.
Methods
The trial design, patient characteristics, and primary results of BARI 2D have been described in previous publications. Patients with type 2 diabetes mellitus and documented stable CAD with ≥1 coronary lesion with ≥50% stenosis appropriate for elective revascularization were enrolled from 49 clinical sites in 6 countries between January 2001 and March 2005. Participants were randomized in a 2-by-2 factorial design to a strategy of intensive medical therapy (MED) with deferred revascularization if clinically indicated versus prompt revascularization (REV) (coronary artery bypass grafting (CABG) or percutaneous coronary intervention (PCI)) with intensive medical therapy, and, concurrently, a glycemic treatment strategy of insulin sensitization (IS) versus insulin provision (IP). Before randomization, the enrolling physician determined whether CABG or PCI was more suitable based on the patient’s coronary anatomy and clinical profile, and the randomization was stratified by this intended method of revascularization. IS medications included metformin and thiazolidinediones, and IP medications included sulfonylureas and insulin. The primary trial end point was all-cause mortality, and the principal secondary end point was a composite of death, myocardial infarction (MI), and stroke. The average follow-up per patient was 5.3 years for mortality and 4.5 years for other outcomes. BARI 2D was approved by the internal review board at the coordinating center and each clinical site, and all participants gave informed consent.
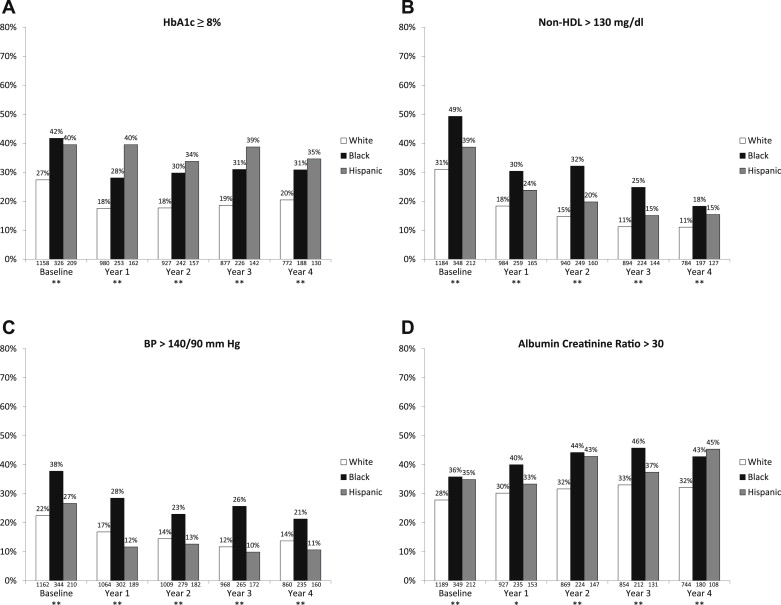
Study clinic visits occurred on a monthly basis for the first 6 months and every 3 months thereafter. All patients received intensive treatment for cardiac risk factors including hypertension, dyslipidemia, obesity, and smoking. A medication in most diabetes and cardiac drug classes was available free of charge through the BARI 2D trial, and centralized management centers monitored patient risk factor control. The target risk factor goals for the trial were based on concurrent national guidelines (American Diabetes Association, National Cholesterol Education Program, Adult Treatment Panel III, and Joint National Committee on Prevention, Detection, Evaluation, and Treatment of High Blood Pressure 7), and these treatment goals were hemoglobin A1c (HbA1c) <7.0%, low-density lipoprotein cholesterol (LDL) <100 mg/dl, and blood pressure ≤130/80 mm Hg. According to the BARI 2D protocol, trial management centers monitored patient-level and site-level risk factor control over the course of the study, and the clinical site investigators were contacted when individual patients had risk factor values above “threshold” levels set at HbA1c ≥8.0%, LDL ≥115 mg/dl, and blood pressure >140/90 mmHg.
HbA1c, lipid levels, and urine albumin and creatinine were analyzed at the BARI 2D Central Biochemistry Laboratory at the University of Minnesota. HbA1c was measured at baseline, 1 month, 3 months, 6 months, 1 year, and semiannually thereafter, and lipids were measured at baseline, 6 months, 1 year, and annually thereafter. Urine was collected at baseline and at each annual follow-up. Blood pressure and angina status were recorded by the site at every clinic visit. A core laboratory at Stanford University analyzed coronary angiograms for all patients at study entry. A lesion was counted if the measured stenosis was ≥20%, a significant lesion was defined as a lesion with angiographic stenosis ≥50%, and the Myocardial Jeopardy Index was calculated as the percentage of myocardium jeopardized by the significant lesions. The total number of lesions and the Myocardial Jeopardy Index capture the extent and severity of CAD, respectively.
Race and Hispanic ethnicity were self-reported by participants at study entry. Patients who replied “Yes” to “Are you Hispanic or Latino?” were classified as having Hispanic ethnicity for this analysis. Other patients were considered non-Hispanic and were classified according to their self-reported race: (1) American Indian or Native Alaskan, (2) Asian, (3) Black or African-American, (4) Native Hawaiian or Other Pacific Islander, (5) White, or (6) Other. Because the concept of race/ethnicity and the health barriers associated with race/ethnicity vary by country, this analysis was restricted to patients from the BARI 2D sites in the United States and Canada.
Baseline patient characteristics were compared by race/ethnicity group. Continuous variables were presented as means and standard deviations or as medians and interquartile ranges and were compared with analysis of variance or Kruskal-Wallis tests; categorical variables were presented as percentages and compared with chi-square tests. Analyses were performed at baseline and at the Year 3 follow-up visit, so chosen to ensure completeness of data for participants recruited later in the study who may not have 4 full years of follow-up.
In this article, overall risk factor control per patient was defined by glycemic control (HbA1c <8.0%), lipid control (non–high-density lipoprotein [HDL] cholesterol ≤130 mg/dl), and blood pressure control (blood pressure ≤140/90 mm Hg). This definition was based on the trial monitoring threshold values, and non-HDL cholesterol was used rather than LDL to minimize the amount of missing data. Patients who attained all 3 goals were deemed to have “good” control, those who attained 2 goals had “moderate” control, and those who attained 0 or 1 goal had “poor” control. Goals were measured at baseline and using area under the curve methods for study follow-up (from baseline to Year 5). Area under the curve values were calculated by drawing lines between each follow-up measurement of the respective risk factors and calculating the average value.
The 5-year rates of death, death/MI/stroke, and subsequent revascularization for the race/ethnicity groups were estimated using Kaplan-Meier survival curves and compared with log-rank statistics. For patients assigned to REV, revascularization procedures that occur after the assigned revascularization procedure are categorized as subsequent revascularization procedures, whereas for patients assigned to MED, all revascularization procedures during the trial are categorized as a subsequent procedures. Cox proportional hazards regression models were used to estimate the hazard ratios for the outcomes of death and death/MI/stroke between the respective race/ethnic categories. The adjusted Cox model included the baseline covariates: age, gender, education, insurance status, albumin creatinine ratio >30, smoking history, body mass index, history of MI, congestive heart failure, duration of diabetes, baseline insulin use, number of diseased coronary regions, number of lesions with ≥20% stenosis, and randomized glycemic and cardiovascular treatment assignment. A second adjusted Cox model included these same baseline factors as well as time-varying covariates of HbA1c, systolic blood pressure, and non-HDL cholesterol. Interactions between race/ethnicity and glycemic treatment and race/ethnicity and cardiovascular treatment were tested and were included only if statistically significant. A 2-sided alpha = 0.05 was considered statistically significant for all analyses.
Results
Among the 2,368 patients randomized in the BARI 2D clinical trial, 1,852 patients were enrolled in the 45 U.S. and Canadian clinical sites. Based on self-reported Hispanic ethnicity and race respectively, patients were categorized as Hispanic (n = 212), and the non-Hispanic patients were categorized as White (n = 1,189), Black (n = 349), American Indian/Native Alaskan (n = 11), Asian (n = 89), Native Hawaiian/Pacific Islander (n = 1), or Other-race (n = 1). Given the small numbers of patients in several categories, only White non-Hispanic (White), Black non-Hispanic (Black), and Hispanic race/ethnicity groups are included in this analysis.
There were numerous differences in the baseline characteristics of patients in the 3 race/ethnicity categories ( Table 1 ). There were differences in age, gender, education, health insurance status, body mass index, duration of diabetes, myocardial jeopardy index, and number of significant coronary lesions. There were no imbalances regarding the randomization to the cardiac (REV and MED) or glycemic (IS vs IP) treatment groups. For a majority of the U.S. and Canadian BARI 2D patients, the intended revascularization procedure was PCI rather than CABG, and PCI was more frequently selected for Black participants compared with White and Hispanic participants.
| Patient Baseline Characteristics | White (n = 1,189) | Black (n = 349) | Hispanic (n = 212) | p Value |
|---|---|---|---|---|
| Male | 77.5% | 51.0% | 67.9% | <0.001 |
| Age at study entry (yrs) | 63.5, 8.8 | 61.5, 9.6 | 61.2, 8.5 | <0.001 |
| Primary insurance | ||||
| None | 3.4% | 10.1% | 7.1% | <0.001 |
| Medicare/public | 62.8% | 52.1% | 65.6% | |
| Private | 33.8% | 37.8% | 27.4% | |
| Education | ||||
| Less than high school degree | 20.2% | 32.1% | 46.4% | <0.001 |
| High school degree, but less than college degree | 56.8% | 57.8% | 45.0% | |
| College degree or higher | 23.0% | 10.1% | 8.6% | |
| Body mass index (kg/m 2 ) | 32.7, 5.9 | 33.2, 7.0 | 31.6, 5.4 | 0.009 |
| MI (history) | 31.2% | 27.2% | 26.8% | 0.221 |
| Heart failure requiring therapy (history) | 7.3% | 10.8% | 10.1% | 0.073 |
| Peripheral or carotid artery disease | 24.7% | 27.2% | 30.7% | 0.163 |
| Duration of diabetes mellitus (yrs) | 10.3, 8.7 | 11.8, 9.5 | 11.4, 8.8 | 0.012 |
| Number of coronary regions with ≥50% stenosis | 1.9, 0.9 | 1.8, 0.9 | 1.8, 0.9 | 0.088 |
| Myocardial Jeopardy Index | 43.8, 24.4 | 38.5, 23.5 | 40.0, 25.0 | 0.001 |
| Number of coronary lesions | 4.9, 2.3 | 4.6, 2.3 | 4.7, 2.2 | 0.023 |
| Number of significant coronary lesions (≥50% stenosis) | 2.7, 1.9 | 2.4, 1.9 | 2.6, 1.9 | 0.016 |
| Treatment assignment and stratification | ||||
| MED (vs REV) assignment | 51.1% | 49.0% | 49.1% | 0.711 |
| IS (vs IP) assignment | 49.2% | 51.9% | 47.6% | 0.523 |
| PCI (vs CABG) stratum | 73.8% | 85.1% | 73.1% | <.001 |
| Index Percutaneous Coronary Intervention | White (n = 414) | Black (n = 149) | Hispanic (n = 78) | p Value |
|---|---|---|---|---|
| Number of lesions attempted | 1.5, 0.8 | 1.3, 0.6 | 1.5, 0.7 | 0.043 |
| Drug-eluting stent | 36.4% | 30.9% | 39.7% | 0.337 |
| Bare-metal stent | 54.1% | 61.1% | 52.6% | 0.291 |
| No stent | 9.0% | 8.0% | 7.7% | 0.824 |
| Index Coronary Artery Graft Surgery | White (n = 173) | Black (n = 36) | Hispanic (n = 29) | p Value |
|---|---|---|---|---|
| Off-pump use | 16.2% | 22.2% | 13.8% | 0.609 |
| Internal mammary arterial conduit | 94.8% | 94.4% | 93.1% | 0.933 |
| Arterial conduits | 2.8, 0.9 | 2.8, 0.9 | 2.7, 1.0 | 0.729 |
| Distal anastomoses | 3.3, 1.1 | 3.3, 1.0 | 3.0, 1.0 | 0.291 |
Among patients assigned to revascularization ( Table 1 ), Black patients had significantly fewer lesions attempted with PCI on average, consistent with the fact that Blacks had fewer significant lesions at study entry. The use of multivessel PCI as well as the use of drug-eluting and bare-metal stents did not differ significantly by race/ethnicity. When CABG was the initial assigned procedure, the use of arterial conduits (internal mammary grafts), number of bypass grafts and conduits, and utilization of off-pump CABG were similar for the 3 race/ethnicity groups.
Medication use by race/ethnicity at baseline and at the 3-year follow-up is presented in Table 2 . At study entry, Black patients were more likely to receive insulin and less likely to receive metformin for glycemic control than White or Hispanic patients. Race/ethnic differences in diabetes drug use decreased during the trial, but differences in insulin use remained statistically significant at Year 3. Utilization of cardiac drugs was fairly similar among race/ethnic groups; however, White patients were more likely to receive aspirin at baseline and Black patients were more likely to receive nonsublingual nitrates at Year 3.
| Medication Use | Baseline | Year 3 | ||||||
|---|---|---|---|---|---|---|---|---|
| White (n = 1,189) | Black (n = 349) | Hispanic (n = 212) | p Value | White (n = 971) | Black (n = 266) | Hispanic (n = 172) | p Value | |
| Biguanide (metformin) | 56.8% | 47.1% | 56.1% | 0.01 | 41.5% | 38.5% | 46.3% | 0.26 |
| Thiazolidinone | 24.5% | 19.5% | 27.4% | 0.15 | 31.7% | 34.2% | 35.6% | 0.50 |
| Sulfonylurea | 52.5% | 49.4% | 53.3% | 0.58 | 39.3% | 32.0% | 41.2% | 0.06 |
| Insulin | 26.6% | 42.0% | 33.0% | <.001 | 44.3% | 52.7% | 51.4% | 0.005 |
| Beta blocker | 72.3% | 75.1% | 71.7% | 0.55 | 84.9% | 89.4% | 91.5% | 0.02 |
| Angiotensin converting enzyme inhibitor | 64.9% | 70.2% | 66.5% | 0.18 | 64.6% | 63.1% | 62.1% | 0.77 |
| Angiotensin receptor blocker | 15.8% | 18.3% | 13.2% | 0.26 | 35.6% | 38.7% | 36.2% | 0.64 |
| Nonsublingual nitrate | 28.1% | 29.5% | 32.1% | 0.47 | 21.7% | 30.3% | 19.2% | 0.005 |
| Aspirin | 90.1% | 82.4% | 84.0% | <.001 | 93.6% | 92.3% | 95.5% | 0.41 |
| Statin | 77.8% | 77.1% | 78.7% | 0.91 | 94.5% | 93.1% | 96.0% | 0.40 |
| Risk Factors | Baseline | Difference Between Year 3 and Baseline | ||||||
|---|---|---|---|---|---|---|---|---|
| White (n = 1,189) | Black (n = 349) | Hispanic (n = 212) | p Value | White (n = 971) | Black (n = 266) | Hispanic (n = 172) | p Value | |
| HbA1c (%) | 7.4, 1.4 | 8.0, 1.8 | 7.8, 1.6 | <.001 | −0.2, 1.4 | −0.5, 1.6 | −0.1, 1.6 | 0.014 |
| Sitting systolic BP (mm Hg) | 129.0, 17.5 | 136.0, 20.5 | 132.1, 21.0 | <.001 | −4.0, 19.6 | −4.8, 25.0 | −6.8, 20.7 | 0.265 |
| Sitting diastolic BP (mm Hg) | 71.4, 10.1 | 76.4, 10.6 | 73.8, 10.7 | <.001 | −3.6, 11.1 | −4.5, 12.7 | −6.0, 12.0 | 0.038 |
| Total cholesterol (mg/dl) | 163.9, 39.9 | 174.8, 43.0 | 168.3, 36.7 | <.001 | −16.7, 42.8 | −17.7, 49.0 | −17.6, 41.0 | 0.939 |
| LDL (mg/dl) | 90.3, 30.8 | 105.7, 38.0 | 95.3, 31.0 | <.001 | −13.6, 34.0 | −18.9, 42.2 | −18.0, 34.5 | 0.091 |
| HDL (mg/dl) | 36.5, 9.0 | 43.8, 13.4 | 39.1, 10.5 | <.001 | 2.4, 8.7 | 2.0, 10.5 | 0.9, 8.7 | 0.178 |
| Non-HDL (mg/dl) | 127.4, 40.2 | 130.9, 41.5 | 129.2, 36.2 | 0.326 | −19.0, 42.2 | −19.7, 46.4 | −18.5, 40.3 | 0.964 |
| Triglycerides (mg/dl) ∗ | 156 (109,225) | 110 (71,159) | 150 (101,218) | <.001 | −18.5 (−77,32) | −6.0 (−42,23) | −3.0 (−48,35) | 0.008 |
| Albumin creatinine ratio ∗ | 11.2 (5,42) | 18.7 (6,79) | 16.9 (7,72) | <.001 | 1.8 (−4,15) | 0.5 (−17,26) | 1.1 (−5,15) | 0.445 |
| eGFR, (ml/min/1.73m 2 ) ∗ | 73.5 (61,90) | 81.4 (63,98) | 78.2 (63,93) | 0.001 | −7.4 (−21,4) | −10.1 (−22,4) | −6.4 (−19,6) | 0.510 |
∗ Triglycerides, albumin-creatinine ratio, and eGFR are reported as median (first quartile–third quartile); all others reported as mean, SD.
Significant differences in cardiovascular risk factors were noted between White, Black, and Hispanic patients at study entry ( Table 2 ). After entry into the trial, there were marked improvements in mean HbA1c, blood pressure, and lipid profiles within each of the 3 race/ethnicity groups. The magnitude of the change from baseline to the 3-year follow-up was similar for systolic blood pressure, LDL, and non-HDL cholesterol, whereas the magnitude of change was different across racial/ethnic categories for HbA1c, diastolic blood pressure, and triglycerides. The proportions of patients who were above the “monitoring threshold” targets set by the BARI 2D trial decreased in all 3 race/ethnicity categories ( Figure 1 ). A consistently lower proportion of White patients were above the glycemic and the renal targets compared with Black and Hispanic patients, and a consistently higher proportion of Black patients were above the cholesterol and blood pressure targets compared with White and Hispanic patients.