The aim of this study was to investigate whether there are effects of intervals between elective off-pump coronary artery bypass grafting (OPCABG) and coronary angiography (CAG) on postoperative acute kidney injury (AKI). The clinical data of patients undergoing OPCABG and CAG from June 2010 to December 2011 in Beijing Anzhen Hospital were retrospectively analyzed. All the patients were divided into AKI and non-AKI groups. Univariate analysis was performed to find possible factors associated with AKI. Multivariate logistic regression analysis was used to identify whether the short interval was one of the independent risk factors of AKI after adjusting for potential confounding variables. Of 1,513 patients, 529 patients (34.9%) developed AKI. The mortality rate in AKI group (4.9%) was >5× higher than that in non-AKI group (0.9%). The incidence of AKI was highest (56.1%) in patients in whom OPCABG was performed ≤24 hours after CAG. Multivariate logistic regression analysis showed that the interval of ≤24 hours between OPCABG and CAG did increase the risk of AKI (odds ratio 2.15, 95% confidence interval 1.10 to 4.20) after adjusting for the following confounding variables: diabetes mellitus, New York Heart Association heart function class III and IV, lower estimated glomerular filtration rate, numbers of coronary artery bypass grafts ≥3, intraoperative or postoperative intra-aortic balloon pump, intraoperative and postoperative red blood cells transfusion of >3 units, postoperative hypotension, dosage of furosemide of >100 mg/day. In conclusion, it was one of the independent risk factors of postoperative AKI that the OPCABG was performed ≤24 hours after CAG.
Acute kidney injury (AKI) is one of the most serious complications following coronary artery bypass grafting (CABG). It has been shown that the short- and long-term mortality risks are significantly increased among patients who develop postoperative AKI. To allow the early identification of patients at high-risk of AKI, risk factors for AKI after CABG have been investigated, and several predictive risk scores have been created. However, most risk factors in these scoring systems are unmodifiable, such as advanced age, gender, diabetes, poor heart function, preoperative renal insufficiency, and emergency surgery. For an effective reduction of the postoperative AKI risk, it is particularly important to identify risk factors that can be modified or avoided. We hypothesized that the interval between coronary angiography (CAG) and selective off-pump coronary artery bypass grafting (OPCABG) might be a modifiable risk factor involved in AKI onset after OPCABG. Therefore, this study aimed to investigate the possible effects of short CAG-OPCABG interval on postoperative AKI development.
Methods
All 4,181 patients who accepted CABG in the Beijing Anzhen Hospital affiliated to the Capital Medical University from June 2010 to December 2011 were consecutively collected. Exclusion criteria were (1) <18 years old, (2) receiving maintenance hemodialysis before CABG, (3) emergency CABG, (4) CABG with cardiopulmonary bypass (CPB), (5) OPCABG and CAG not performed during the same hospitalization, and (6) interval between OPCABG and CAG of >30 days. Finally, a total of 1,513 patients who accepted selective OPCABG after CAG were enrolled in the present study and retrospectively analyzed.
AKI was diagnosed according to the criteria from the Acute Kidney Injury Network, which defined AKI as an absolute increase in serum creatinine (SCr) levels of ≥26.4 μmol/L (0.3 mg/dl), or as a percent increase in SCr of ≥50% (1.5×) from baseline within 48 hours. Patients were consequently divided into the AKI or non-AKI group.
The pre-, intra-, and postoperative variables that might influence AKI development were determined according to previous published works and our clinical experience. Postoperative variables were collected within 48 hours after the surgery. The cardiac function was assessed according to the New York Heart Association criteria. The estimated glomerular filtration rate was calculated using the modified abbreviated Modification of Diet in Renal Disease equation for Chinese patients, that is, estimated glomerular filtration rate (ml/min·1.73 m 2 ) = 175 × SCr (mg/dl) −1.234 × age −0.179 (×0.79 for women). Proteinuria was diagnosed when the result of a urinary dipstick protein test was positive. Hypoproteinemia was determined as serum albumin level of <35 g/L, anemia as hemoglobin level of <120 g/L for men and <110 g/L for women, and hypotension as systolic pressure of <90 mm Hg. Multivessel disease was defined as significant stenosis (≥50% luminal diameter) in ≥2 major branches of coronary artery and/or in the left main coronary artery found by CAG. Nephrotoxic antibiotics mainly referred to aminoglycosides and vancomycin. The doses of loop diuretics were expressed in furosemide equivalents (i.e., 1 mg bumetanide or 20 mg torsemide was equivalent to 40 mg furosemide).
Statistical analysis was performed using SPSS 16.0 (SPSS Inc., Chicago, Illinois). Continuous data with a normal distribution are expressed as mean ± SD, and the Student t test was used for the comparison between the 2 groups. Non-normally distributed continuous data are expressed as median and interquartile range, and the Wilcoxon’s rank-sum test was used for the comparison between the 2 groups. Categorical data are expressed as proportions and were analyzed using the chi-square test.
Univariate logistic regression analysis was used to investigate the relation between different intervals between OPCABG and CAG (≤24, 24 to 48, 48 to 72, or >72 hours) and postoperative AKI. The univariate comparison between AKI and non-AKI groups was performed to screen out the variables with p <0.10, which would be included in the multivariate regression model. Multivariate logistic regression analysis was used to adjust the influences of pre-, intra-, and postoperative confounding variables and to determine if the short interval was an independent risk factor for AKI.
Spearman’s rank correlation analysis was also performed to investigate the correlation between intervals and the doses of contrast agent, to further confirm that the doses of contrast agent did not interfere with the effects of intervals on AKI.
p Values <0.05 were considered statistically significant.
Results
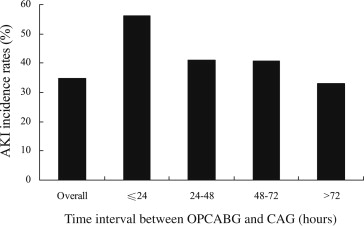
Of the 1,513 patients enrolled in the present study, 529 patients (34.9%) developed postoperative AKI. Of them, 21 patients (1.4%) developed acute renal failure and required dialysis. As shown in Figure 1 , the incidences of AKI were gradually reduced with the increasing CAG-OPCABG interval (56.1%, 41.0%, 40.6%, and 33.0% for intervals of ≤24, 24 to 48, 48 to 72, and >72 hours, respectively, p = 0.003). The highest AKI incidence was observed in the interval of ≤24 hours.
The proportions of patients with postoperative intensive care unit stay >1 day and postoperative hospital stay >8 days in the AKI group were greater than those in the non-AKI group (intensive care unit stay >1 day: 25.3% vs 12.9%, p <0.001; hospital stay >8 days: 54.8% vs 41.9%, p <0.001). The in-hospital mortality rate was 2.3% in all patients. The mortality rate in the AKI group (4.9%) was fivefold higher than that in the non-AKI group (0.9%, p <0.001). The in-hospital mortality rate in patients with acute renal failure undergoing dialysis (66.7%) was 28-fold higher than that in patients with AKI not undergoing dialysis (2.4%, p <0.001) and 74-fold higher than that in patients in non-AKI group (0.9%, p <0.001).
Baseline demographics, clinical and laboratory characteristics of all patients are listed in Table 1 . The univariate comparison of potential predictor variables between AKI and non-AKI groups are also listed in Table 1 .
| Variable | Overall, n = 1,513 (%) | Non-AKI, n = 984 (%) | AKI, n = 529 (%) | p |
|---|---|---|---|---|
| Preoperative factors | ||||
| Men | 1,149 (75.9) | 746 (75.8) | 403 (76.2) | 0.873 |
| Mean age (yrs) | 62.1 ± 9.1 | 61.7 ± 9.1 | 63.0 ± 9.1 | 0.011 |
| Mean BMI (kg/m 2 ) | 25.8 ± 3.3 | 25.7 ± 3.3 | 26.0 ± 3.5 | 0.116 |
| Hypertension | 1,055 (69.7) | 665 (67.6) | 390 (73.7) | 0.013 |
| Diabetes mellitus | 557 (36.8) | 333 (33.8) | 224 (42.3) | 0.001 |
| Previous PCI | 189 (12.5) | 124 (12.6) | 65 (12.3) | 0.860 |
| Previous cardiac surgery | 7 (0.5) | 4 (0.4) | 3 (0.6) | 0.661 |
| History of heart failure | 34 (2.2) | 17 (1.7) | 17 (3.2) | 0.063 |
| Previous myocardial infarction | 490 (32.4) | 310 (31.5) | 180 (34.1) | 0.306 |
| History of cerebrovascular disease | 169 (11.2) | 99 (10.1) | 70 (13.2) | 0.062 |
| Peripheral vascular disease | 1,139 (75.3) | 742 (75.4) | 397 (75.0) | 0.887 |
| Chronic obstructive pulmonary disease | 8 (0.5) | 5 (0.5) | 3 (0.6) | 0.883 |
| Hypoalbuminemia | 83 (5.5) | 49 (5.0) | 34 (6.5) | 0.243 |
| Proteinuria | 116 (8.0) | 63 (6.7) | 53 (10.4) | 0.014 |
| NYHA class III/IV | 204 (13.5) | 94 (9.6) | 110 (20.8) | <0.001 |
| LVEF (%) | 60.5 ± 9.4 | 60.8 ± 8.9 | 59.9 ± 10.2 | 0.053 |
| LVEF <50% | 170 (11.2) | 97 (9.9) | 73 (13.8) | 0.021 |
| eGFR (ml/[min·1.73 m 2 ]) | 90.9 (76.0, 109.0) | 91.6 (77.6, 108.7) | 89.5 (71.6, 109.7) | 0.089 |
| eGFR (ml/[min·1.73 m 2 ]) | <0.001 | |||
| 40–70 | 256 (16.9) | 144 (14.6) | 112 (21.2) | |
| <40 | 20 (1.3) | 6 (0.6) | 14 (2.6) | |
| Anemia | 130 (8.6) | 70 (7.1) | 60 (11.3) | 0.005 |
| Doses of contrast agent >100 ml | 180 (12.0) | 112 (11.5) | 68 (13.0) | 0.413 |
| CAG-OPCABG intervals (h) | 0.003 | |||
| ≤24 | 41 (2.7) | 18 (1.8) | 23 (4.3) | |
| 24–48 | 122 (8.1) | 72 (7.3) | 50 (9.5) | |
| 48–72 | 143 (9.5) | 85 (8.6) | 58 (11.0) | |
| >72 | 1,207 (79.8) | 809 (82.2) | 398 (75.2) | |
| Multivessel coronary disease | 1,482 (98.0) | 962 (97.8) | 520 (98.3) | 0.484 |
| Intra-aortic balloon pump | 11 (0.7) | 8 (0.8) | 3 (0.6) | 0.591 |
| Mechanical ventilation | 3 (0.2) | 1 (0.1) | 2 (0.4) | 0.249 |
| ACEI/ARB | 826 (54.6) | 520 (52.8) | 306 (57.8) | 0.063 |
| Dosage of furosemide ≥60 mg/day | 8 (0.5) | 4 (0.4) | 4 (0.8) | 0.371 |
| Inotropic agents | 25 (1.7) | 16 (1.6) | 9 (1.7) | 0.913 |
| Intraoperative factors | ||||
| Surgical time >300 minutes | 137 (9.1) | 84 (8.5) | 53 (10.0) | 0.338 |
| Numbers of grafts ≥3 | 1,125 (74.6) | 704 (71.8) | 421 (79.6) | 0.001 |
| Hypotension | 35 (2.3) | 21 (2.1) | 14 (2.6) | 0.527 |
| Bleeding (ml) | 600 (500, 800) | 600 (500, 800) | 650 (500, 900) | 0.188 |
| Blood loss >600 ml | 718 (47.5) | 450 (45.7) | 268 (50.7) | 0.067 |
| Dosage of furosemide ≥40 mg/day | 6 (0.4) | 3 (0.3) | 3 (0.6) | 0.439 |
| Inotropic agents | 32 (2.1) | 18 (1.8) | 14 (2.6) | 0.292 |
| Intra-aortic balloon pump | 30 (2.0) | 13 (1.3) | 17 (3.2) | 0.012 |
| Postoperative factors | ||||
| Hypotension | 92 (6.1) | 35 (3.6) | 57 (10.8) | <0.001 |
| Intra-aortic balloon pump | 110 (7.3) | 38 (3.9) | 72 (13.6) | <0.001 |
| Extracorporeal membrane oxygenation | 3 (0.2) | 1 (0.1) | 2 (0.4) | 0.249 |
| Mechanical ventilation (h) | 16 (12, 18) | 15 (11, 18) | 16 (12, 18) | <0.001 |
| Mechanical ventilation >20 h | 176 (11.6) | 79 (8.0) | 97 (18.3) | <0.001 |
| Re-exploration in the chest | 30 (2.0) | 12 (1.2) | 18 (3.4) | 0.004 |
| Nephrotoxic antibiotics | 59 (3.9) | 35 (3.6) | 24 (4.5) | 0.348 |
| ACEI/ARB | 332 (21.9) | 210 (21.3) | 122 (23.1) | 0.441 |
| Dosages of furosemide | <0.001 | |||
| ≤100 mg/day | 1,435 (94.8) | 959 (97.5) | 476 (90.0) | |
| 100–200 mg/day | 61 (4.0) | 23 (2.3) | 38 (7.2) | |
| >200 mg/day | 17 (1.1) | 2 (0.2) | 15 (2.8) | |
| Inotropic agents | 78 (5.2) | 43 (4.4) | 35 (6.6) | 0.060 |
| Intra- and postoperative RBCs transfusion (units) | 2 (2, 4) | 2 (0, 4) | 4 (2, 6) | <0.001 |
| Intra- and postoperative RBCs transfusion >3 units | 709 (46.9) | 408 (41.5) | 301 (56.9) | <0.001 |
Univariate logistic regression analysis showed that the patients who received OPCABG ≤24 hours after CAG were 2.6-fold more likely to develop AKI compared with patients who received OPCABG >72 hours after CAG (odds ratio 2.60, 95% confidence interval 1.39 to 4.87, p = 0.003), without adjustment for confounding variables ( Table 2 ).
| CAG-OPCABG Intervals (h) | Odds Ratios | 95% CI | p |
|---|---|---|---|
| >72 | 1.00 (Reference) | 1.00 (Reference) | |
| 48–72 | 1.39 | 0.97–1.98 | 0.071 |
| 24–48 | 1.41 | 0.97–2.07 | 0.076 |
| ≤24 | 2.60 | 1.39–4.87 | 0.003 |
Stay updated, free articles. Join our Telegram channel

Full access? Get Clinical Tree


