


By definition, VT consists of at least three consecutive QRS complexes originating from the ventricles and recurring at a rapid rate (>120 beats per minute). Like other tachyarrhythmias, VT is considered either nonsustained or sustained, depending on whether it persists for a specified time, as defined below. The rhythm of VT is either regular or only slightly irregular.
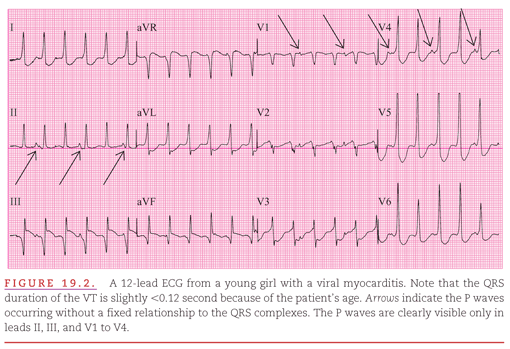
In this chapter, the term “the ventricles” refers to any area distal to the branching of the common bundle (bundle of His) and includes both the Purkinje cells of the pacemaking and conduction system and the ventricular myocardial cells. The re-entry circuit in VT is confined to a localized region, and the remainder of the myocardium receives the electrical impulses, just as it would if they were originating from an automatic (pacemaking) focus (Fig. 19.2). The QRS complexes and T waves that appear on the ECG in VT are generated from the regions of ventricular myocardium not involved in the re-entry circuit.
VT usually occurs as a complication of heart disease but may occasionally appear in otherwise healthy individuals. When VT occurs in healthy individuals, it may originate either from the right-ventricular outflow tract or the anterior or posterior fascicle of the left bundle branch.6–13 VT originating from both of these regions can usually be “cured” by radiofrequency catheter ablation.14
VT is a major complication of ischemic heart disease, acutely during the early hours of myocardial infarction and chronically following a large infarction. VT may appear almost immediately after complete proximal obstruction of a major coronary artery when there is epicardial injury but not yet infarction. In this setting, VT tends to be unstable, often leading to ventricular fibrillation. However, during the weeks to months after a large infarction, a more stable form of VT may appear. These “arrhythmogenic infarcts” are typically large enough to decrease left-ventricular function and may have other typical anatomic characteristics.15 One study has reported that in patients with a wide QRS complex tachyarrhythmia, two aspects of the clinical history consistently predicted presence of VT.
1. A previous myocardial infarction.
2. No previous tachyarrhythmia.
VT also occurs as a complication of various nonischemic cardiomyopathies,1 including the “idiopathic dilated,” “hypertrophic obstructive,” and “arrhythmogenic right-ventricular” forms.
Many of the antiarrhythmic drugs also have proarrhythmic effects that are manifested either by VT or torsades de pointes.16–18 Drugs that slow conduction (such as flecainide) may prolong the QRS complex and convert nonsustained VT into sustained VT; those that prolong recovery time (such as sotalol) may prolong the QT interval and produce torsades de pointes (see Figure 19.16). VT is most likely to occur as a proarrhythmic effect in patients with poor ventricular function caused by ischemic heart disease.3
The diagnosis of VTs would be easy if the impulses causing all supraventricular tachyarrhythmias (SVTs) were conducted normally through the ventricles. However, aberrant conduction of supraventricular impulses because of either refractoriness in the bundle branches and fascicles or presence of an accessory pathway occurs frequently (see Chapter 20). The importance of differentiating VT from an SVT was emphasized in one study by the adverse responses of VT to the calcium channel–blocking drug verapamil. In this study, half of a group of patients were given verapamil because of an erroneous diagnosis of SVT; as a result, many of these patients promptly deteriorated and some required resuscitation.19
It is also commonly believed that VT is associated with a greater alteration of hemodynamics than is SVT, but a study by Morady et al15 showed this to be a misconception. The main factors that determine a patient’s tolerance to a tachyarrhythmia of any origin are the (a) ventricular rate, (b) size of the heart, (c) severity of the underlying clinical problem, and (d) associated conditions, such as drugs.
With the advent of intracardiac recordings, it became possible to distinguish VT from SVT with bundle-branch block and to determine the site of origin of wide-complex tachycardia. This allowed confirmation of some older20–25 and some more recently defined26–31 ECG criteria, and it has provided a basis for improving these criteria. Previously, both extremely prolonged QRS duration or extremely deviated frontal plane axis were considered diagnostic of VT. However, because exceptions occur, it is now recommended to use a well-structured, systematic approach to wide QRS tachycardia in a stepwise manner.
To ensure the diagnosis of VT using all available pertinent criteria, the “scan and zoom approach” is suggested. Scanning provides a global view of the 12-lead ECG in both frontal and transverse planes. Zooming provides specific inspection of QRS waveforms in leads such as V1, V2, or V6.
Step 1: Scan the 12-Lead ECG for P Waves
Atrioventricular Dissociation
During VT, the atria may be associated with the ventricles via retrograde activation, or may be dissociated from the ventricles, with their own independent rhythm (usually sinus rhythm; Fig. 19.3).
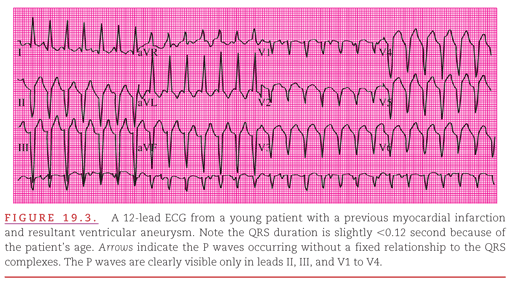
Because wide QRS complexes or T waves are occurring constantly in both of these situations, the P waves are often lost in the barrage of rapid ventricular cycles. Sometimes, however, the P waves may be recognized as bumps or notches in the vicinity of T waves. One may look in lead V1, where atrial activity tends to be most prominent, or in any lead with low amplitude or isoelectric QRS to improve accuracy.
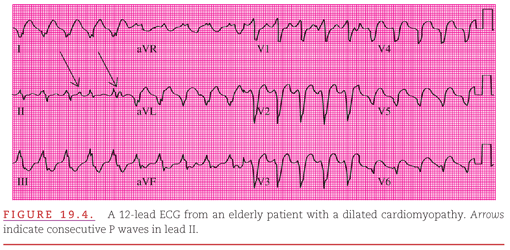
Figure 19.4 is an example in which the low QRS amplitude in lead II facilitates observation of P waves. Presence of AV dissociation is entirely specific but minimally sensitive because of difficulty in finding definitive P waves among the wide QRS complexes and T waves.31
Intermittent Irregularity
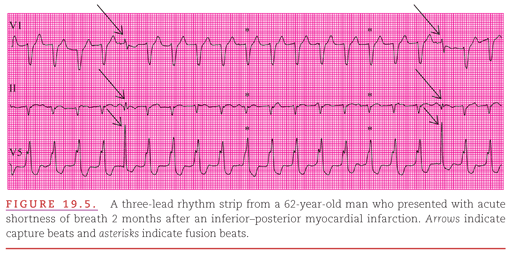
When the ECG waveform morphology of VT is consistent from beat to beat, the term monomorphic is applied. When an intermittent on-time narrowing of the QRS complex occurs, the most likely cause is a breakthrough of conduction of the atrial rhythm to the ventricles. If the atrial breakthrough occurs during a QRS complex of the VT, the result is a “fusion beat.” If the atrial breakthrough occurs before a QRS complex has begun, the result is a “capture beat,” as in beats 5 and 18 in Figure 19.5. Fusion describes a hybrid QRS morphology, in which a portion of the QRS complex represents the areas of the ventricles activated by the VT while the other portion represents the areas activated by a competing atrial impulse, as in Figure 19.5, beats 10 and 15. “Capture” means that the entire QRS complex represents activation of the ventricles by a competing atrial impulse. If either fusion or capture beats are proven to be present, the diagnosis is almost certainly VT. However, fusion and/or capture beats are seldom seen in VT and only at the less rapid rates (<160 beats per minute). Indeed, they appeared in only 4 of a series of 33 reported patients with sustained VT.26
Atrioventricular Association
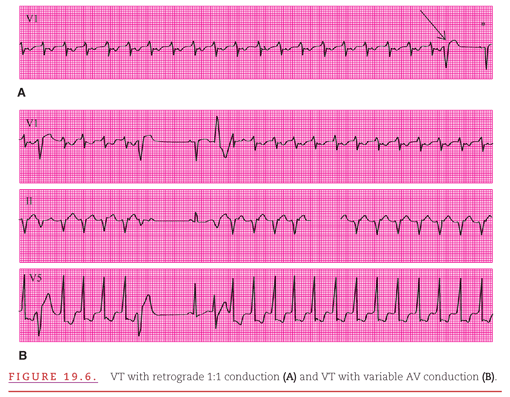
When atrial and ventricular activation are associated, there is a particular ventricular-to-atrial ratio, such as 1:1, 2:1, or 3:2. In Figure 19.6A, the VT with retrograde 1:1 conduction is terminated by the premature ventricular activation (arrow). This could be either a ventricular premature beat (VPB) or an atrial capture with aberrancy. The termination of the VT is followed by a sinus capture beat with normal QRS morphology (asterisk). In Figure 19.6B, there is initially variable retrograde conduction during nonsustained VT. Then, after the VT resumes, there is 1:1 retrograde conduction.
Step 2: Scan the Precordial Leads for Presence or Absence of RS Morphology
No RS Pattern
Typically, right- or left-bundle-branch block has an RS pattern in at least one of the precordial leads (V1 to V6), and the time from the beginning of the R wave to the nadir of the S is <100 milliseconds (see Chapter 6).
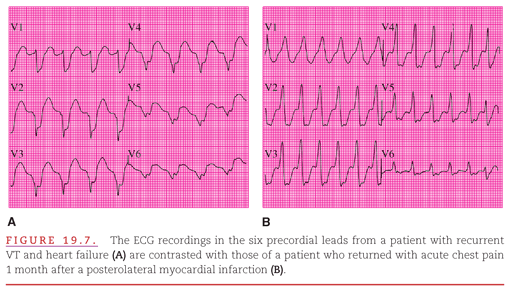
When there is no RS morphology in any of the precordial leads, VT is strongly suggested. However, there is a low sensitivity (21%) as documented by Brugada et al27. Scanning all the precordial leads reveals R, qR, or qS QRS complex morphologies (Fig. 19.7).
RS Is Present
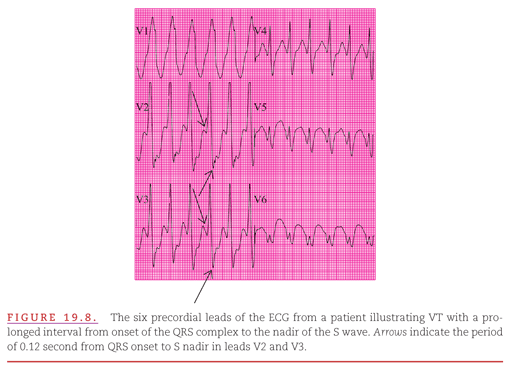
An interval >100 milliseconds from the beginning of the R wave to the nadir of the S wave in one precordial lead had a specificity of 0.98 and sensitivity of 0.66.27 An RS interval >100 milliseconds is difficult to calculate when the QRS merges with the previous T wave, masking the QRS onset during rapid tachycardia. An increased RS interval occurs in SVT with conduction over an accessory pathway and with drugs that prolong QRS duration (Fig. 19.8).
Step 3: Zoom to Specific Precordial Leads for QRS Morphology
Right-Bundle-Branch Block Pattern
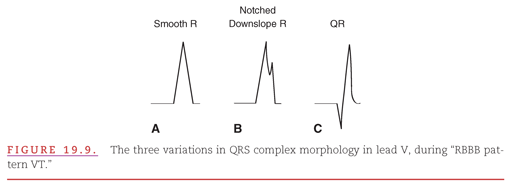
FIRST ZOOM TO LEAD V1. Just as the presence of the terminal positive (R or R′) morphology in lead V1 of conducted beats indicates a right-bundle-branch block, this morphology during VT indicates that the RV is activated after the LV. Therefore, the term “right-bundle-branch block pattern” is used to classify VT as left ventricular in origin (Fig. 19.9). The terminal positive wave is preceded in Figure 19.9A and 19.9B by a smooth or notched R wave but by a Q wave in Figure 19.9C. The most commonly occurring variety of the right-bundle-branch block is the notched downslope R.
Wellens and colleagues20
Stay updated, free articles. Join our Telegram channel

Full access? Get Clinical Tree


