
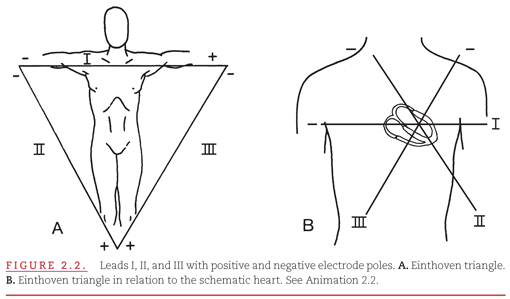
The three ECG leads (I, II, and III) form an equiangular (60-degree) triangle known as the Einthoven triangle (Fig. 2.2A). Consideration of these three leads so that they intersect in the center of the cardiac electrical activity but retain their original spatial orientation provides a triaxial reference system for viewing the cardiac electrical activity (see Fig. 2.2B). These are the only leads in the standard 12-lead ECG that are recorded using only two body surface electrodes. They are typically called “bipolar leads,” but indeed, the other nine leads are also bipolar. Their negative poles are provided by the central terminal.

The 60-degree angles between leads I, II, and III create wide gaps among the three views of the cardiac electrical activity. Wilson and coworkers2 developed a method for filling these gaps without additional body surface electrodes: They created a central terminal, by connecting the three limb electrodes on the right and left arms and the left leg. An ECG lead using this central terminal as its negative pole and a recording electrode on the body surface as its positive pole is termed a V lead, as stated above.
However, when the central terminal is connected to a recording electrode on a limb to produce an additional frontal plane lead, the resulting electrical signals are small. This occurs because the electrical signal from the recording electrode is partially cancelled when both the positive electrode and one of the three elements of the negative electrode are located on the same extremity. The amplitude of these signals may be increased or “augmented” by disconnecting the central terminal from the electrode on the limb serving as the positive pole. Such an augmented V lead is termed an aV lead. The alternating lines in the figure indicate resistors on the connections between two of the recording electrodes that produce the negative poles for each of the aV leads. For example, lead aVR fills the gap between leads I and II by recording the potential difference between the right arm and the average of the potentials on the left arm and left leg (Fig. 2.3). Lead aVR, like lead II, provides a long-axis viewpoint of the cardiac electrical activity but with the opposite orientation from that provided by lead II, as presented in Chapter 1, Figure 1.8. The gap between leads II and III is filled by lead aVF, and the gap between leads III and I is filled by lead aVL. The three aV frontal plane leads were introduced by Goldberger.3
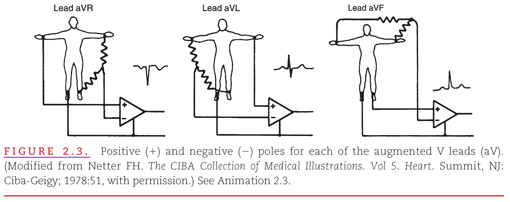

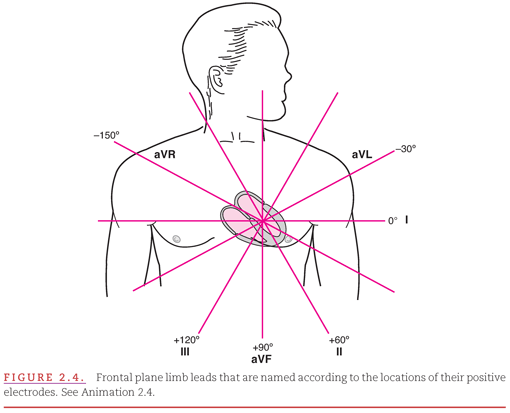
Figure 2.2B is reproduced with the addition of the three aV leads to the triaxial reference system, producing a hexaxial system (Fig. 2.4) for viewing the cardiac electrical activity in the frontal plane. Five of the six leads of this system are separated by angles of only 30 degrees. The exception is lead aVR, because its positive electrode on the right arm is oriented to −150 degrees. This provides a 360-degree perspective of the frontal plane similar to the positions of the 2, 3, 5, 6, 7, and 10 on the face of a clock. By convention, the degrees are arranged as shown. With lead I (located at 0 degrees) used as the reference lead, positive designations increase in 30-degree increments in a clockwise direction to +180 degrees, and negative designations increase by the same increments in a counterclockwise direction to −180 degrees. Lead II appears at +60 degrees, lead aVF at +90 degrees, and lead III at +120 degrees. Leads aVL and aVR have designations of −30 and −150 degrees, respectively. The negative poles of each of these leads complete the “clock face.”

Modern electrocardiographs, using digital technology, record leads I and II only and then calculate the voltages in the remaining limb leads in real time on the basis of Einthoven law: I + III = II.1 The algebraic outcome of the formulas for calculating the voltages in aV leads from leads I, II, and III are:
aVR = −½(I + II)
aVL = I − ½(II)
aVF = II − ½(I)
Thus,
aVR + aVL + aVF = 0
Transverse Plane
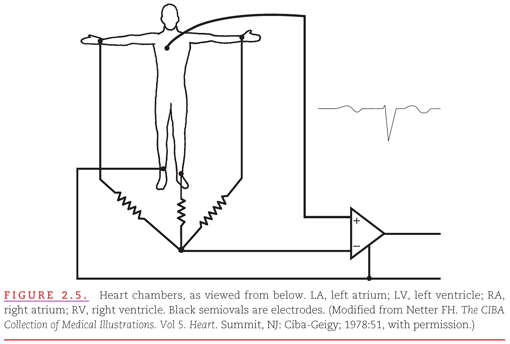
The standard 12-lead ECG includes the six frontal plane leads of the hexaxial system and six additional leads relating to the transverse plane of the body. These additional leads, introduced by Wilson, are produced by using the central terminal of the hexaxial system as the negative pole and an electrode placed at various positions on the anterior and left lateral chest wall as the positive pole.4–8 Because the positions of these latter leads are immediately in front of the heart, they are termed precordial. Because the positive poles of these leads are provided from an electrode that is not included in the central terminal, no “augmentation” of the recorded wave forms is required. The six additional leads used to produce the 12-lead ECG are labeled V1 through V6. Figure 2.5 shows lead V1, with its positive pole on the right anterior precordium and its negative pole in the center of the cardiac electrical activity. Therefore, this lead provides a short-axis view of cardiac electrical activity that is useful for distinguishing left versus right location of various abnormal conditions as described (see Fig. 1.13). The wavelike lines in the figure indicate resistors in the connections between the recording electrodes on the three limb leads that produce the negative poles for each of the V leads.
The body surface positions of each of these electrodes is determined by bony landmarks on the thorax (Fig. 2.6). The clavicles should be used as a reference for locating the first rib. The space between the first and second ribs is called the first intercostal space. The V1 electrode is placed in the fourth intercostal space just to the right of the sternum. The V2 electrode is placed in the fourth intercostal space just to the left of the sternum (directly anterior to the center of cardiac electrical activity), and electrode V4 is placed in the fifth intercostal space on the midclavicular line. Placement of electrode V3 is then halfway along a straight line between electrodes V2 and V4. Electrodes V5 and V6 are positioned directly lateral to electrode V4, with electrode V5 in the anterior axillary line and electrode V6 in the midaxillary line. In women, electrodes V4 and V5 should be positioned on the chest wall beneath the breast.
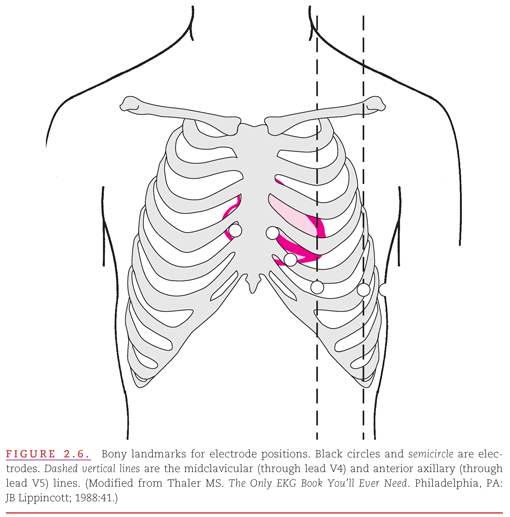
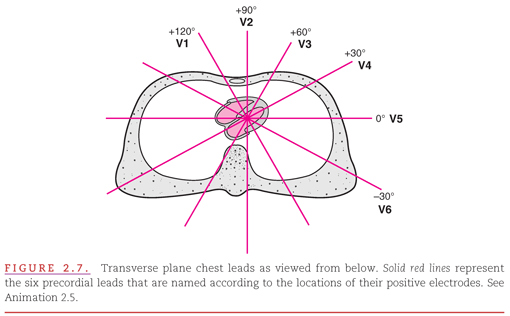
Figure 2.7 shows the orientation of the six chest leads from each of their positive electrode sites through the approximate center of cardiac electrical activity. The angles between the six transverse plane leads are approximately the same 30 degrees as in the frontal plane (see Fig. 2.4). Their positions when viewed from above are at 11, 12, 1, 2, 3, and 4 on the face of a clock. Extension of these lines through the chest indicates the opposite positions on the chest that would complete the clock face, which can be considered the locations of the negative poles of the six precordial leads. The same format as in Figure 2.4 indicates the angles on the clock face.

CORRECT AND INCORRECT ELECTRODE PLACEMENTS
A single cardiac cycle from each of the standard 12 ECG leads of a healthy individual, recorded with all nine recording electrodes positioned correctly, is shown in Figure 2.8A. An accurate electrocardiographic interpretation is possible only if the recording electrodes are placed in their proper positions on the body surface. The three frontal plane electrodes (right arm, left arm, and left leg) used for recording the six limb leads should be placed at distal positions on the designated extremity. It is important to note that when more proximal positions are used, particularly on the left arm,9 marked distortion of the QRS complex may occur. The distal limb positions provide “clean” recordings when the individual maintains the extremities in “resting” positions.
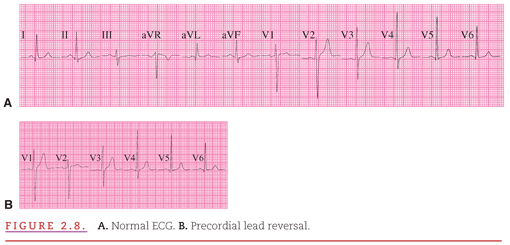
There can be many errors in the placement of the 9 ECG electrodes. This includes reversal of any pair of the six chest electrodes. Reversal of the positions of the V1 and V2 electrodes produces the recording shown in Figure 2.8B.
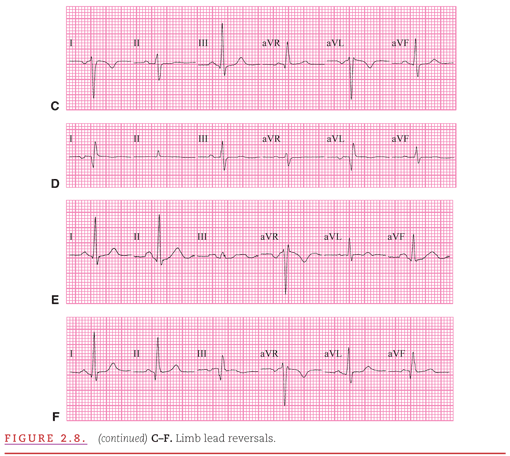
Figures 2.8C through 2.8F present examples of ECG recordings produced by incorrect placement of a limb electrode on the same individual, as described. The most common error in frontal plane recording results from reversal of two of the electrodes. One example of this is reversal of the right and left arm electrodes (see Fig. 2.8C). In this instance, lead I is inverted, leads II and III are reversed, leads aVR and aVL are reversed, and lead aVF is correct. Another example that produces a characteristic ECG pattern is reversal of the right leg grounding electrode with one of the arm electrodes. Extremely low amplitudes of all waveforms appear in lead II when the right arm electrode is on the right leg (see Fig. 2.8D) and in lead III when the left arm electrode is on the right leg (see Fig. 2.8E). These amplitudes are so low because the potential difference between the two legs is almost zero. Left arm and leg electrode reversal is the most difficult to detect; lead III is inverted and leads I and II and aVL and aVF are reversed (see Fig. 2.8F).
However, a more common error in transverse plane recording involves failure to place the individual electrodes according to their designated landmarks (see Fig. 2.6). Precise identification of the bony landmarks for proper electrode placement may be difficult in women, obese individuals, and persons with chest wall deformities. Even slight alterations of the position of these electrodes may significantly distort the appearance of the cardiac waveforms. Comparison of serial ECG recordings relies on precise electrode placement.
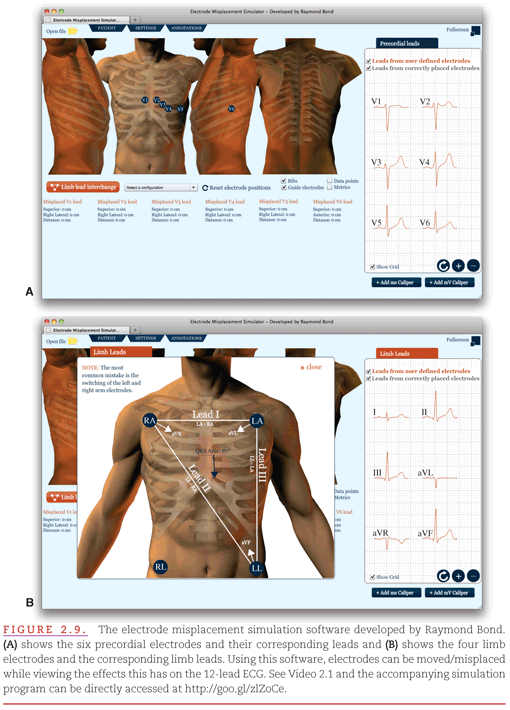
Figure 2.9 shows ECG simulation software that allows the user to interchange and misplace electrodes. The accompanying video illustrates the effects of misplacement of precordial (Fig. 2.9A) and limb (Fig. 2.9B) electrodes.

ALTERNATIVE DISPLAYS OF THE 12 STANDARD ELECTROCARDIOGRAM LEADS
Alternative displays of the 12-lead ECG may also improve ECG diagnostic capability of the ECG to waveform morphology. Each lead provides its unique view of the cardiac electrical activity, but only the six chest leads are typically displayed in their spatially ordered sequence. The six limb leads are displayed in their two classical sequences (two columns of three leads—I, II, and III and aVR, aVL, and aVF; Fig. 2.10A). This limitation in the standard display becomes most clinically important for the diagnosis of acute myocardial ischemia and infarction; ST-segment elevation in two or more spatially adjacent leads is the cornerstone for an ST-segment elevation myocardial infarction (STEMI) (see Chapters 11 and 12).
Stay updated, free articles. Join our Telegram channel

Full access? Get Clinical Tree


