Echocardiography is a well-accepted tool for the diagnosis and quantification of pericardial effusion (PEff). Given the increasing use of computed tomographic (CT) scanning, more PEffs are being initially diagnosed by computed tomography. No study has compared quantification of PEff by computed tomography and echocardiography. The objective of this study was to assess the accuracy of quantification of PEff by 2-dimensional echocardiography and computed tomography compared to the amount of pericardial fluid drained at pericardiocentesis. We retrospectively reviewed an institutional database to identify patients who underwent chest computed tomography and echocardiography before percutaneous pericardiocentesis with documentation of the amount of fluid withdrawn. Digital 2-dimensional echocardiographic and CT images were retrieved and quantification of PEff volume was performed by applying the formula for the volume of a prolate ellipse, π × 4/3 × maximal long-axis dimension/2 × maximal transverse dimension/2 × maximal anteroposterior dimension/2, to the pericardial sac and to the heart. Nineteen patients meeting study qualifications were entered into the study. The amount of PEff drained was 200 to 1,700 ml (mean 674 ± 340). Echocardiographically calculated pericardial effusion volume correlated relatively well with PEff volume (r = 0.73, p <0.001, mean difference −41 ± 225 ml). There was only moderate correlation between CT volume quantification and actual volume drained (r = 0.4, p = 0.004, mean difference 158 ± 379 ml). In conclusion, echocardiography appears a more accurate imaging technique than computed tomography in quantitative assessment of nonloculated PEffs and should continue to be the primary imaging in these patients.
Echocardiography is a sensitive, readily available, noninvasive imaging tool for diagnosis and hemodynamic evaluation of pericardial effusion (PEff). Accurate quantification of PEff volume is important prognostically and after serial examinations. Several semiquantitative and quantitative echocardiographic methods to define PEff volume have been described. Given the increasing use of computed tomographic (CT) scanning, more PEffs are being initially diagnosed by computed tomography. Although previous studies have assessed the ability of computed tomography to evaluate pericardial fluid composition and hemodynamic significance, only 1 small study has examined quantification of PEff by computed tomography. No study has compared quantification of PEff by computed tomography and echocardiography. The objective of this study was to assess the accuracy of quantification of PEff volume by 2-dimensional (2-D) echocardiography and computed tomography compared to the actual amount of pericardial fluid removed at pericardiocentesis.
Methods
We retrospectively reviewed an institutional database from 2006 to 2009 to identify patients who underwent chest computed tomography and echocardiography before percutaneous pericardiocentesis with documentation of the amount of fluid withdrawn. We excluded patients with PEff after cardiopulmonary bypass because of the possibility of loculated effusions in this population. Confirmation of complete drainage by repeat echocardiography was performed in all patients after pericardiocentesis as is institutional practice.
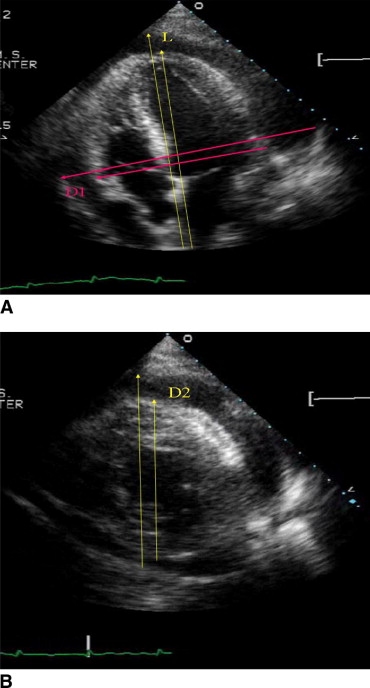
Digital 2-D echocardiographic and CT images were retrieved from the database. Echocardiographic studies were performed on an HP 5500 (Phillips, Andover, Massachusetts) or a Vivid 7 or Vivid I (GE Healthcare, Haifa, Israel) machine. Quantification of PEff volume was performed according to the method of D’Cruz and Hoffman by an experienced echocardiographer (DL). This method was chosen because it is the only 2-D echocardiographic volumetric method validated by pericardiocentesis in humans. In brief, this calculation applies the formula for the volume of a prolate ellipse, π × 4/3 × maximal long-axis dimension/2 × maximal transverse dimension/2 × maximal anteroposterior dimension/2, to the pericardial sac and to the heart. Pericardial fluid volume is calculated as pericardial sac volume minus cardiac volume. For the pericardium, maximal long-axis dimension and maximal transverse dimension were measured in apical 4-chamber view. Maximal anteroposterior dimension was measured in short-axis view at the level of the mitral leaflets. A representative example of echocardiographic measurement is displayed in Figure 1 . All measurements were made at onset of the QRS complex by an observer blinded to the results of pericardiocentesis and CT measurement. Size of effusions was also graded semiquantitatively as small (visually estimated <500 ml), moderate (visually estimated 500 to 1,000 ml), or large (visually estimated >1,000 ml).
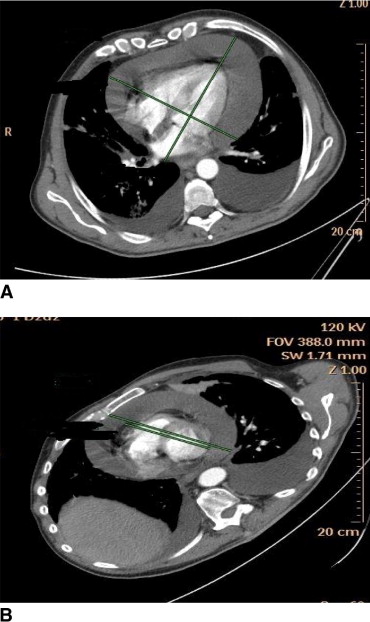
CT examinations were acquired on 16- and 64 multislice computed tomographs (Brilliance; Philips, Cleveland, Ohio; and Light Speed; GE, Milwaukee, Wisconsin) using 3- or 2.5-mm-thick slices obtained from the lung apices to the bases, during breath-hold and were not electrocardiographically gated. Fourteen (74%) examinations were obtained after administration of intravenous contrast material 90 to 120 ml. An experienced cardiothoracic radiologist (NB) blinded to quantity of pericardial fluid drained and to echocardiographic assessment made the measurements. Images were reconstructed in 4-chamber and short-axis views, and measurements were obtained as described for echocardiography. A representative example of CT measurements is presented in Figure 2 . Amount of PEff was calculated based on these measurements. Size of effusions was also graded semiquantitatively as small, moderate, or large.
Data are expressed as mean ± SD. Agreement between PEff volumes obtained at pericardiocentesis and calculated volumes by echocardiography and computed tomography was evaluated using Pearson correlation coefficient and Bland-Altman analysis. A 2-sided adjusted p value <0.05 was considered statistically significant.
Results
Nineteen patients meeting study qualifications were identified and entered into the study. Clinical characteristics of patients are presented in Table 1 . Amount of PEff drained was 200 to 1,700 ml (mean 674 ± 340). Echocardiographically calculated PEff volume correlated relatively well with PEff volume, with a small underestimation of actual volume drained (r 2 = 0.73, p <0.001, mean difference −41 ± 225 ml; Figure 3 ). Echocardiographic agreement with actual volume was independent of actual volume drained. There was only moderate correlation between CT volume quantification and actual volume drained (r 2 = 0.4, p = 0.004, mean difference 158 ± 379 ml; Figure 4 ). Bland-Altman plot demonstrated that at >600 mL of pericardial fluid, computed tomography tended to overestimate actual PEff volume, whereas computed tomography tended to slightly underestimate pericardial fluid volume when the actual volume drained was <600 ml ( Figure 4 ).
| Patient Number | Age (years)/Sex | Indication | Diagnosis | Days From CT Drainage | Days From Echocardiographic Drainage |
|---|---|---|---|---|---|
| 1 | 35/F | chest pain | melanoma | 6 | 1 |
| 2 | 38/M | chest pain | lymphoma | 8 | 7 |
| 3 | 43/M | chest pain | idiopathic | 1 | 1 |
| 4 | 62/F | chest pain | idiopathic | 4 | 3 |
| 5 | 73/F | chest pain | idiopathic | 3 | 1 |
| 6 | 86/F | chest pain | lung cancer | 1 | 0 |
| 7 | 17/M | chest pain, fever | viral infection | 1 | 1 |
| 8 | 21/M | chest pain, fever | lymphoma | 1 | 1 |
| 9 | 85/F | chest pain, fever | lymphoma | 1 | 1 |
| 10 | 47/F | dyspnea | lung cancer | 16 | 3 |
| 11 | 56/M | dyspnea | lung cancer | 0 | 0 |
| 12 | 56/F | dyspnea | scleroderma | 7 | 2 |
| 13 | 63/M | dyspnea | lung cancer | 0 | 0 |
| 14 | 72/M | dyspnea | lung cancer | 6 | 0 |
| 15 | 18/F | dyspnea, fever | lymphoma | 6 | 3 |
| 16 | 45/F | dyspnea, fever | infection | 1 | 1 |
| 17 | 20/F | weakness | lymphoma | 1 | 1 |
| 18 | 51/F | cough | leukemia | 5 | 1 |
| 19 | 79/M | palpitations | viral infection | 1 | 1 |
Stay updated, free articles. Join our Telegram channel

Full access? Get Clinical Tree


