The aim of the present study was to determine whether the risk of mortality associated with the concentration of soluble ST2 (sST2) differs in patients with acutely decompensated heart failure with preserved ejection fraction (HFpEF) compared to patients with systolic heart failure. We prospectively enrolled 447 patients with acutely decompensated heart failure. Blood samples were collected at presentation to determine the sST2 concentration. HFpEF was defined as symptoms or signs of acutely decompensated heart failure and left ventricular ejection fraction of ≥50% on the echocardiogram. The patients were followed up for 1 year, and the vital status was obtained for all. The sST2 concentrations were greater in the patients with systolic heart failure (n = 250) than in those with HFpEF (n = 197) at 0.55 versus 0.38 ng/ml (p <0.001). Receiver operating characteristic curve analyses showed different cutoff point values for sST2 for the prediction of 1-year mortality in patients with HFpEF (>0.35 ng/ml) and systolic heart failure (>0.56 mg//ml). These cutoff points had similar prognostic accuracy (area under the curve of 0.69 vs 0.73; p >0.05). In the adjusted analyses that included amino terminal B-type natriuretic peptide concentrations, elevated sST2 concentrations were associated with a greater mortality risk in both populations (HFpEF, per ng/ml, hazard ratio 1.41, 95% confidence interval 1.14 to 1.76, p = 0.002; and systolic heart failure, per ng/ml, hazard ratio 1.20, 95% confidence interval 1.10 to 1.32, p <0.001). The determination of the sST2 concentration improved the clinical risk prediction compared to amino terminal B-type natriuretic peptide, as assessed by both the improved C-statistic and an improvement in the net reclassification index and integrated discrimination improvement analyses. In conclusion, in the present multicenter study, sST2 concentrations were lower in patients with HfpEF; however, sST2 remained an independent predictor of mortality, regardless of the left ventricular ejection fraction.
In addition to the natriuretic peptides, other biochemical markers have been examined for prognostication in heart failure. Among these is the soluble form of the interleukin-1 receptor member, ST2. A biomarker suggested to potentially reflect ventricular remodeling and fibrosis, soluble ST2 (sST2) represents an attractive candidate marker for understanding heart failure biology. Moreover, concentrations of the marker represent a powerful prognostic variable in those with acutely decompensated heart failure. However, the value of sST2 as a biomarker of risk as a function of acutely decompensated heart failure with preserved ejection fraction (HfpEF) versus systolic heart failure has not been specifically examined. Thus, in a cohort of patients with acutely decompensated heart failure, we evaluated the effects of left ventricular function on the concentrations of sST2, the associations between the cardiac structure and function and sST2, and the prognostic meaning of sST2 in those with HFpEF versus systolic heart failure.
Methods
The study population consisted of subjects from 3 previously reported prospective clinical trials of acutely decompensated heart failure from Boston, Massachusetts, Linz, Austria, and Murcia, Spain. These trials had compatible inclusion/exclusion criteria and had used similar clinical and laboratory testing, including sST2, troponin T, amino terminal B-type natriuretic peptide (NT-proBNP), and C-reactive protein. For the purposes of the present study, 447 patients with acutely decompensated heart failure had data available and were considered (209 from Boston, Massachusetts; 131 from Linz, Austria; and 107 from Murcia, Spain). The ProBNP Investigation of Dyspnea in the Emergency Department study was a prospective, blinded study of NT-proBNP testing performed in Boston, Massachusetts, that examined 599 subjects with dyspnea in the emergency department. All patients with acutely decompensated heart failure from Boston were eligible for the present analysis. The Linz study had included 137 patients with dyspnea who had presented to the emergency department and had a final diagnosis of acutely decompensated heart failure. Of these patients, 131 had complete data and were included in the present study. The final source of data for the present analysis was a prospectively gathered group of subjects from a Spanish cohort study of patients with a diagnosis of acutely decompensated heart failure consecutively admitted to the University Hospital of Virgen de la Arrixaca from September 1, 2006 to February 28, 2009. During that period, 107 subjects with sST2 data on admission were available for analysis and were included in the present study. The patients from each study group were followed up for 1 year, and the vital status was obtained for all.
The patients were characterized as having HFpEF if their left ventricular ejection fraction was ≥50%, as estimated using echocardiography and Simpson’s biplane method. The concentrations of sST2 were measured using an enzyme-linked immunosorbent assay (Medical and Biological Laboratories, Woburn, Massachusetts) on blood specimens frozen at −80°C. In addition, NT-proBNP was measured using a validated, commercially available immunoassay (Elecsys ProBNP, Roche Diagnostics, Indianapolis, Indiana) using an established method.
The normally distributed data are presented as the mean ± SD and the non-normally distributed data as the median and interquartile range. Differences in the baseline characteristics were compared using Student’s t test for continuous variables and the chi-square test for categorical variables. The Mann-Whitney U test was used to compare continuous variables in states of non-normality. The Kruskal-Wallis test was performed to assess and compare the sST2 concentrations across the New York Heart Association (NYHA) functional class. The sST2 results were log-transformed to establish normality, and univariate Spearman correlation was used to evaluate the magnitude and significance of the relations among the continuous variables. To evaluate the characteristics of the sST2 concentrations as a predictor of death in patients with either HFpEF or systolic heart failure, several methods were used. The patients were grouped into tertiles, and the frequency of mortality relative to the increasing sST2 concentrations was calculated as a function of HFpEF and systolic heart failure. Receiver operating characteristic curve analyses with death at 1 year were also performed, and the area under the curve was estimated. The added predictive ability of sST2 compared to NT-proBNP for the detection of events was evaluated using the C-statistic, net reclassification improvement, and integrated discrimination improvement analyses. Net reclassification improvement and integrated discrimination improvement were performed with the biomarkers kept as dichotomous variables, as described by Pencina et al, such that the categories of probability for events are defined according to a prognostication scheme of the Heart Failure Survival Score. To identify the independent predictors of death at 1 year, we performed multivariate Cox proportional hazards analyses using forward stepping. Variables were retained if their univariate p value was <0.05 and were entered into a multivariate model. Only those variables with significant p values were retained in the final multivariate model. The cumulative incidence of death was estimated using the Kaplan-Meier method, and the log-rank statistic was used for comparisons. All p values <0.05 were accepted as statistically significant. Statistical analysis was performed using the Statistical Package for Social Sciences, version 15.0, for Windows (SPSS, Chicago, Illinois). Receiver operating characteristic curve analysis was performed using MedCalc statistical software, version 10.4, for Windows (MedCalc Software, Mariakerke, Belgium).
Results
A total of 447 subjects were included in the present analysis. The distribution of clinical characteristics and laboratory parameters as a function of left ventricular ejection fraction are listed in Table 1 . The sST2 concentrations correlated with several clinical characteristics and laboratory parameters ( Table 2 ). Moderate significant positive correlations were observed between sST2 and C-reactive protein, troponin T, and NT-proBNP (all p <0.001). The sST2 concentrations also correlated weakly with the left ventricular ejection fraction (r = −0.12; p = 0.01). Thus, patients with systolic heart failure had higher sST2 concentrations (median 0.55 ng/ml, interquartile range 0.30 to 1.03, vs median 0.38 ng/ml, interquartile range 0.26 to 0.79; p <0.001). When patients were categorized as a function of the NYHA functional class, the median sST2 concentrations were higher in those with worse symptoms, regardless of their left ventricular ejection fraction. Thus, of the patients with an ejection fraction ≥50% (n = 197), those with NYHA class II had a median ST2 level of 0.28 ng/ml (interquartile range 0.17 to 0.36), NYHA class III, a median ST2 level of 0.43 ng/ml (interquartile range 0.30 to 0.84), and NYHA class IV, median 0.49 ng/ml (interquartile range 0.29 to 0.96 (p = 0.001). Of those with an ejection fraction <50% (n = 250), those with NYHA class II had a median ST2 level of 0.33 ng/ml (interquartile range 0.19 to 0.72), NYHA class III, median ST2 level of 0.59 ng/ml (interquartile range 0.31 to 1.01), and NYHA class IV, median ST2 level of 0.63 ng/ml (interquartile range 0.35 to 1.38; p <0.001).
| Variable | Overall (n = 447) | Left Ventricular Ejection Fraction | p Value | |
|---|---|---|---|---|
| ≥50% (n = 197) | <50% (n = 250) | |||
| Age (year) | 73 ± 13 | 74 ± 12 | 72 ± 13 | 0.035 |
| Men | 290 (65%) | 83 (42%) | 207 (83%) | <0.001 |
| Body mass index (kg/m 2 ) | 27 [24–31] | 28 [25–32] | 26 [23–30] | <0.001 |
| Systolic blood pressure (mm Hg) | 142 ± 32 | 149 ± 32 | 136 ± 31 | <0.001 |
| Diastolic blood pressure (mm Hg) | 80 ± 18 | 79 ± 17 | 80 ± 19 | 0.46 |
| Heart rate (beats/min) | 92 ± 27 | 88 ± 27 | 96 ± 26 | 0.002 |
| Hypertension | 306 (69%) | 148 (75%) | 158 (63%) | 0.007 |
| Diabetes mellitus | 183 (41%) | 79 (40%) | 104 (42%) | 0.75 |
| Coronary artery disease | 202 (45%) | 64 (33%) | 138 (55%) | <0.001 |
| Previous heart failure | 239 (54%) | 81 (41%) | 158 (63%) | <0.001 |
| Obstructive airway disease | 103 (23%) | 49 (25%) | 54 (22%) | 0.42 |
| Current smoking | 63 (14%) | 22 (11%) | 41 (16%) | 0.11 |
| Left ventricular ejection fraction (%) | 46 (32–60) | 60 (55–65) | 34 (25–42) | <0.001 |
| Admission New York Heart Association functional class | 0.46 | |||
| II | 102 (23%) | 45 (23%) | 57 (23%) | |
| III | 156 (35%) | 63 (32%) | 93 (37%) | |
| IV | 189 (42%) | 89 (45%) | 100 (40%) | |
| Atrial fibrillation/flutter | 189 (42%) | 82 (42%) | 107 (43%) | 0.80 |
| Medication | ||||
| β Blocker | 233 (52%) | 105 (53%) | 128 (51%) | 0.66 |
| Angiotensin-converting enzyme | 208 (47%) | 71 (36%) | 137 (55%) | <0.001 |
| Angiotensin-receptor blocker | 57 (13%) | 34 (17%) | 23 (9%) | 0.011 |
| Digoxin | 104 (23%) | 31 (16%) | 73 (29%) | 0.01 |
| Loop diuretic | 309 (69%) | 124 (63%) | 185 (74%) | 0.012 |
| Hemoglobin (g/dl) | 12.7 ± 2.2 | 12.1 ± 2.3 | 13.1 ± 2.1 | <0.001 |
| Leukocytes (per 10 3 ) | 8.7 (7.0–10.9) | 8.6 (7.1–10.6) | 8.7 (6.7–11.1) | 0.79 |
| Creatinine (mg/dl) | 1.10 (0.83–1.50) | 1.10 (0.82–1.49) | 1.14 (0.88–1.56) | 0.53 |
| Estimated glomerular filtration rate (ml/min/1.73 m 2 ) | 63 (43–86) | 61 (40–83) | 65 (45–90) | 0.029 |
| Blood urea nitrogen (mg/dl) | 25 (18–34) | 24 (18–33) | 25 (18–35) | 0.36 |
| C-reactive protein (mg/dl) | 3.5 (0.9–16.3) | 5.2 (1–22) | 2.65 (0.80–9.95) | 0.013 |
| Troponin T (ng/ml) | 0.01 (0.01–0.04) | 0.01 (0.01–0.037) | 0.016 (0.01–0.062) | 0.004 |
| Plasma amino terminal B-type natriuretic peptide (pg/ml) | 3,558 (1,646–9,250) | 2,749 (1,344–6,634) | 4,709 (2099–11,159) | <0.001 |
| Soluble ST2 (ng/ml) | 0.47 (0.28–0.94) | 0.38 (0.26–0.79) | 0.55 (0.30–1.03) | <0.001 |
| Variable | Left Ventricular Ejection Fraction | |||||
|---|---|---|---|---|---|---|
| Overall (n = 447) | ≥50% (n = 197) | <50% (n = 250) | ||||
| r | p Value | r | p Value | r | p Value | |
| Age (years) | — | 0.69 | — | 0.65 | 0.10 | 0.12 |
| Body mass index (kg/m 2 ) | — | 0.23 | — | 0.94 | — | 0.42 |
| Systolic blood pressure (mm Hg) | −0.10 | 0.040 | — | 0.47 | −0.10 | 0.11 |
| Diastolic blood pressure (mm Hg) | — | 0.68 | −0.11 | 0.13 | — | 0.59 |
| Heart rate (beats/min) | 0.20 | <0.001 | — | 0.19 | 0.25 | <0.001 |
| Hemoglobin (g/dl) | −0.11 | 0.018 | −0.12 | 0.09 | −0.26 | 0.006 |
| Leukocytes | 0.23 | <0.001 | 0.19 | 0.01 | 0.26 | <0.001 |
| Creatinine (mg/dl) | 0.25 | <0.001 | 0.18 | 0.015 | 0.30 | <0.001 |
| Estimated glomerular filtration rate (ml/min/1.73 m 2 ) | −0.23 | <0.001 | −0.18 | 0.01 | −0.30 | <0.001 |
| Blood urea nitrogen (mg/dl) | 0.26 | <0.001 | 0.13 | 0.08 | 0.36 | <0.001 |
| C-reactive protein (mg/dl) | 0.40 | <0.001 | 0.36 | <0.001 | 0.47 | <0.001 |
| Plasma amino terminal B-type natriuretic peptide (pg/ml) | 0.41 | <0.001 | 0.35 | <0.001 | 0.43 | <0.001 |
| Troponin T (ng/ml) | 0.31 | <0.001 | 0.25 | 0.001 | 0.34 | <0.001 |
| Left ventricular end-systolic diameter (mm) | 0.15 | 0.033 | — | 0.l6 | 0.23 | 0.034 |
| Left ventricular end-diastolic diameter (mm) | — | 0.382 | — | 0.49 | — | 0.39 |
| Right ventricular systolic pressure (mm Hg) | 0.22 | <0.001 | 0.16 | 0.08 | 0.27 | <0.001 |
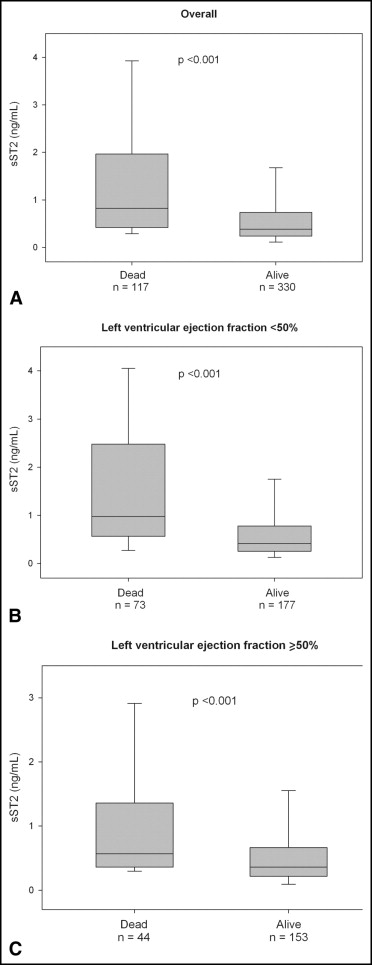
During the 1 year of follow-up, 117 patients (26%) died. The median concentration of sST2 were significantly greater among the deceased than among the survivors (median 0.80 ng/ml, interquartile range 0.42 to 1.83, vs median 0.38 ng/ml, interquartile range 0.24 to 0.72; p <0.001). This pattern of higher ST2 concentrations in those who died remained for patients with HFpEF (median 0.57 ng/ml, interquartile range 0.26 to 1.28, vs 0.35 ng/ml, interquartile range 0.22 to 0.66; p <0.001) and those with systolic heart failure (median 0.98 ng/ml, interquartile range 0.57 to 2.48, vs median 0.42 ng/ml, interquartile range 0.26 to 0.78; p <0.001; Figure 1 ). To evaluate the optimal prognostic accuracy of the sST2 concentrations for the prediction of 1-year mortality, we performed receiver operating characteristic curve analyses as a function of the left ventricular ejection fraction. The sST2 concentrations had an area under the curve for patients with HFpEF that was comparable to that for patients with systolic heart failure ( Table 3 ). On multivariate Cox regression analysis, we found that elevated sST2 levels, as a quantitative variable, were associated with a greater risk of 1-year mortality for patients with HFpEF (per ng/ml, hazard ratio 1.41, 95% confidence interval 1.14 to 1.76, p = 0.002) and for those with systolic heart failure (per ng/ml, hazard ratio 1.20, 95% confidence interval 1.10 to 1.32, p <0.001; Table 4 ). In addition, tertile analyses of sST2 concentrations revealed that a graded increase occurred in the 1-year mortality rate with increasing concentrations of sST2 in both groups of acutely decompensated heart failure ( Figure 2 ). The Kaplan-Meier survival analysis showed an early diverging rate of mortality according to sST2 cutoff values throughout the 1 year of follow-up for the entire cohort (sST2 ≥0.53 ng/ml [n = 201], 35% vs sST2 <0.53 ng/ml [n = 246], 12%; log-rank test, p <0.001), as well as after stratification by left ventricular ejection fraction (HFpEF, sST2 ≥0.35 ng/ml [n = 114], 31% vs sST2 <0.35 ng/ml [n = 83], 9.6%; log-rank test, p <0.001; and systolic heart failure, sST2 ≥0.56 ng/ml [n = 121], 37% vs sST2 <0.56 ng/ml [n = 129], 14%; log-rank test, p <0.001).
| Variable | AUC | 95% CI | Cutpoint (ng/ml) | Sensitivity (%) | Specificity (%) | PPV (%) | NPV (%) |
|---|---|---|---|---|---|---|---|
| All patients (n = 447) | 0.71 | 0.67–0.76 | 0.53 | 0.69 | 0.64 | 0.41 | 0.85 |
| Left ventricular ejection fraction ≥50% (n = 197) | 0.69 | 0.62–0.75 | 0.35 | 0.82 | 0.49 | 0.37 | 0.88 |
| Left ventricular ejection fraction <50% (n = 250) | 0.73 | 0.67–0.79 | 0.56 | 0.76 | 0.62 | 0.42 | 0.88 |
| Variable | All Patients (n = 447) | Left Ventricular Ejection Fraction | ||||||
|---|---|---|---|---|---|---|---|---|
| ≥50% (n = 197) | <50% (n = 250) | |||||||
| Univariate | Multivariate | Multivariate | Multivariate | |||||
| Hazard Ratio | p Value | Hazard Ratio | p Value | Hazard Ratio | p Value | Hazard Ratio | p Value | |
| Age (years) | 1.006 (1.004–1.008) | <0.001 | 1.05 (1.03–1.07) | <0.001 | 1.07 (1.03–1.11) | <0.001 | 1.03 (1.008–1.06) | 0.008 |
| Body mass index (kg/m 2 ) | 0.94 (0.90–0.97) | 0.001 | ||||||
| Systolic blood pressure (mm Hg) | 0.985 (0.979–0.992) | <0.001 | 0.988 (0.982–0.994) | <0.001 | 0.986 (0.977–0.995) | 0.002 | ||
| Diastolic blood pressure (mm Hg) | 0.981 (0.971–0.992) | 0.001 | ||||||
| Previous heart failure | 1.72 (1.18–2.50) | 0.005 | ||||||
| New York Heart Association functional class | 1.43 (1.12–1.82) | 0.004 | ||||||
| β Blocker | 0.68 (0.48–0.98) | 0.038 | 0.66 (0.45–0.97) | 0.035 | 0.56 (0.34–0.91) | 0.019 | ||
| Angiotensin-converting enzyme inhibitor | 0.64 (0.44–0.93) | 0.018 | ||||||
| Hemoglobin (g/dl) | 0.87 (0.80–0.94) | <0.001 | ||||||
| Leukocytes (U) | 1.07 (1.02–1.03) | 0.003 | 1.13 (1.03–1.24) | 0.008 | ||||
| Creatinine (mg/dl) | 1.74 (1.43–2.12) | <0.001 | ||||||
| Estimated glomerular filtration rate (ml/min/1.73 m 2 ) | 0.985 (0.979–0.992) | <0.001 | 0.98 (0.97–0.99) | 0.012 | ||||
| Blood urea nitrogen (mg/dl) | 1.02 (1.01–1.03) | <0.001 | 1.02 (1.01–1.03) | <0.001 | 1.03 (1.01–1.04) | <0.001 | ||
| C-reactive protein (mg/dl) | 1.006 (1.004–1.008) | <0.001 | ||||||
| Plasma amino terminal B-type natriuretic peptide (100 pg/ml) | 1.003 (1.002–1.004) | <0.001 | 1.002 (1.001–1.003) | <0.001 | 1.002 (1.001–1.003) | <0.001 | ||
| Soluble ST2 (ng/ml) | 1.74 (1.43–2.12) | <0.001 | 1.23 (1.13–1.34) | <0.001 | 1.37 (1.11–1.68) | 0.003 | 1.20 (1.10–1.32) | <0.001 |
| Soluble ST2 greater than cutoff | ||||||||
| All patients (>0.53 mg/ml) | 3.31 (2.23–4.89) | <0.001 | 2.43 (1.60–3.69) | <0.001 | ||||
| Left ventricular ejection fraction ≥ 50% (>0.35 mg/ml) | 3.26 (1.50–7.05) | 0.003 | ||||||
| Left ventricular ejection fraction <50% (>0.56 mg/ml) | 2.94 (1.66–5.19) | <0.001 | ||||||
Stay updated, free articles. Join our Telegram channel

Full access? Get Clinical Tree


