The aim of this study was to use T2* cardiac magnetic resonance (CMR) imaging to quantify myocardial iron content in patients with heart failure (HF) and to investigate the relation between iron content, cardiac function, and the cause of HF. CMR data were analyzed from 167 patients with nonischemic and 31 with ischemic HF and 50 patients with normal ventricular function. Short-axis T2* imaging was accomplished using 3-T scanner and multiecho gradient-echo sequence. Myocardial T2* value (M-T2*) was calculated by fitting the signal intensity data for the mid–left ventricular (LV) septum to a decay curve. Patients with nonischemic HF were categorized into patients with LV ejection fraction (LVEF) <35% or ≥35%. The relation between nonischemic HF with LVEF <35% and the risk for major adverse cardiac events was analyzed by multivariate logistic regression analysis using M-T2* and HF biomarkers. M-T2* was significantly greater for patients with nonischemic HF (LVEF <35%: 29 ± 7 ms, LVEF ≥35%: 26 ± 5 ms) than for patients with normal LV function (22 ± 3 ms, p <0.0001) or ischemic HF (22 ± 4 ms, p <0.001). The odds ratio was 1.21 for M-T2* (p <0.0001) and 1.0015 for brain natriuretic peptide (p <0.0001) in relation to nonischemic HF with LVEF <35%. Furthermore, this value was 0.96 for systolic blood pressure (p = 0.012) and 1.02 for M-T2* (p = 0.03) in relation to the risk for major adverse cardiac events in patients with nonischemic HF. In conclusion, T2* CMR demonstrated the robust relation between myocardial iron deficiency and nonischemic HF. M-T2* is a biomarker that can predict adverse cardiac function in patients with nonischemic HF.
T2* cardiac magnetic resonance (CMR) has been used for the assessment of myocardial iron overload in patients with thalassemia, whereas the assessment of myocardial iron deficiency using T2* CMR has not been examined. Although we hypothesize that myocardial iron deficiency itself mediates the development of cardiac dysfunction and morphological aberration, the role of myocardial iron deficiency in the pathophysiology of heart failure (HF) according to the specific cause of HF remains poorly understood. Therefore, the aim of this study was to quantify myocardial iron content in patients with nonischemic and ischemic HF using T2* CMR and to examine the role of myocardial iron deficiency in HF according to the specific cause of HF.
Methods
Two hundred twenty-eight consecutive patients who had been admitted to our hospital from June 2010 to March 2013 with symptomatic congestive HF and echocardiographic left ventricular ejection fraction (LVEF) <50% were prospectively enrolled in this study. Congestive HF was diagnosed by the following clinical symptoms and signs according to the Framingham criteria: typical symptoms, neck vein distension, peripheral edema, lung rales, S3 gallop, and tachycardia together with representative chest radiography findings. The diagnosis and cause of HF were established at admission or thereafter using a 12-lead electrocardiogram, transthoracic echocardiography, and, when necessary, stress perfusion imaging, coronary angiography, or myocardial biopsy. We excluded patients with end-stage renal failure requiring dialysis therapy; patients with previously implanted pacemaker or cardioverter-defibrillator, other implanted devices or metal objects contraindicated for a magnetic resonance scanner; patients with claustrophobia; patients with significant arrhythmia; patients with congenital heart disease; patients with leukemia; and patients undergoing treatment for anemia. After stabilization of clinical conditions, patients underwent CMR and standard blood tests, including measurements of brain natriuretic peptide (BNP). Informed consent for registration in our database and for use of patient data within this clinical study was obtained in accordance with the guidelines of the ethics committee of our hospital. Thirty patients with secondary cardiomyopathy, valvular disease, and metabolic diseases were excluded from final analysis. Therefore, the data presented here were derived from the remaining 198 patients, including 31 (16%) with ischemic HF and 167 (84%) with nonischemic HF cause. In addition, patients with nonischemic HF were divided into patients with LVEF <35% and ≥35% on cine CMR. Patient backgrounds are summarized in Table 1 .
| Clinical Characteristic | Nonischemic Heart Failure | Ischemic Heart Failure (n = 31) | Normal (n = 50) | |
|---|---|---|---|---|
| LVEF <35% (n = 73) | LVEF ≥35% (n = 94) | |||
| Men | 48 (66) | 47 (50) | 22 (71) | 27 (54) |
| Age (yrs) | 51 ± 16 | 56 ± 14 | 62 ± 12 | 59 ± 14 |
| Diabetes mellitus | 3 (4) | 9 (10) | 6 (19) | 3 (6) |
| Hypertension | 6 (8) | 4 (4) | 9 (29) | 5 (10) |
| Systolic blood pressure (mm Hg) | 114 ± 24 | 118 ± 21 | 123 ± 21 | 123 ± 27 |
| Diastolic blood pressure (mm Hg) | 70 ± 19 | 67 ± 14 | 70 ± 14 | 72 ± 16 |
| Heart rate (beats/min) | 82 ± 19 | 76 ± 28 | 74 ± 13 | 76 ± 18 |
| Hemoglobin (g/dl) | 13.9 ± 2.1 | 13.3 ± 1.6 | 12.8 ± 2.1 | 13.1 ± 1.6 |
| Estimated glomerular filtration rate (ml/min/1.73 m 2 ) | 75 ± 30 | 70 ± 25 | 59 ± 26 | 73 ± 12 |
| BNP (pg/ml) | 626 ± 1,180 | 221 ± 300 | 354 ± 688 | 39 ± 30 |
| Cardiac MR measurement | ||||
| LV end-diastolic volume (ml) | 247 ± 97 | 139 ± 45 | 164 ± 60 | 109 ± 27 |
| LV end-systolic volume (ml) | 192 ± 86 | 72 ± 30 | 104 ± 51 | 43 ± 13 |
| LVEF (%) | 23 ± 8 | 49 ± 10 | 40 ± 12 | 61 ± 5 |
| No. of patients who underwent LGE | 70 | 88 | 25 | 50 |
| LGE positive | 41 (59) | 49 (56) | 25 (100) | 0 |
In the entry period of this study, patients with suspected cardiomyopathy underwent the same examinations as the HF group for diagnosis. Fifty of the patients who satisfied the following 3 criteria were enrolled in this study as normal ventricular function group: (1) LVEF ≥55% on cine CMR; (2) negative for late gadolinium enhancement (LGE) on CMR; and (3) BNP <100 pg/ml.
After receiving optimal medical treatment and being discharged from the hospital, 167 patients with nonischemic HF were examined by cardiologists at the outpatient clinic of our hospital at least every 3 months for a mean follow-up period of 20 months. Physicians determined the necessity for blood tests, electrocardiography, chest radiography, echocardiography, and other examinations. The primary end point was major adverse cardiac events (MACEs) consisting of cardiac death or HF hospitalization or a left ventricular (LV) assist device before heart transplantation because of pump failure that was refractory to medical treatment.
All patients underwent 3-T magnetic resonance imaging (Achieva 3.0T Quasar Dual; Philips Healthcare, Best, the Netherlands) equipped with dual-source parallel radiofrequency transmission, 32-element cardiac phased-array coils for radiofrequency reception, and a 4-lead vector cardiogram used for cardiac gating. Cine balanced turbo field echo sequences in 2-, 3- and 4-chamber views and a stack of short-axis images acquired in parallel to the atrioventricular groove from the base to apex were performed. Cine images were analyzed with the use of dedicated software (Extended Workspace, Philips Healthcare). Initially, short-axis images were previewed from the base to the apex in a cinematic mode, then endocardial and epicardial contours for end-diastole and end-systole were manually traced. Delineated contours were used for the quantification of LV volumes and LVEF.
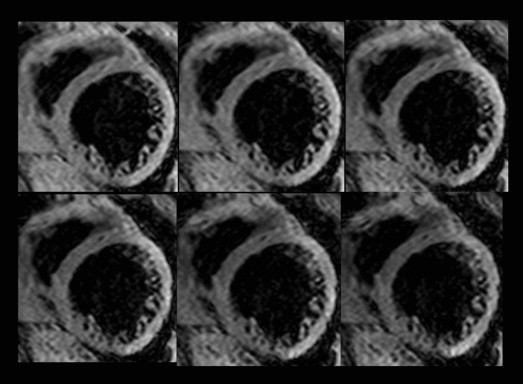
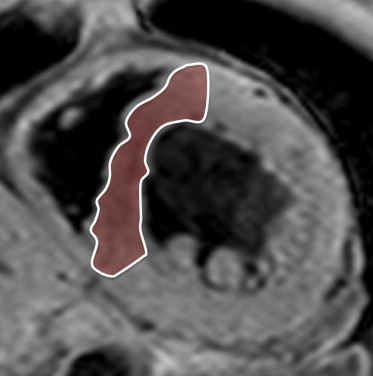
A midventricular short-axis slice was obtained for T2* measurements. The black blood T2* acquisition used a breath-hold multiecho gradient-echo sequence (flip angle 30°, matrix size 200 × 123, sample bandwidth 2,275 Hz/pixel, slice thickness 8 mm, and field of view 320 mm). The short-axis images were acquired within a single breath-hold at 6 echo times from 2.9 to 10.3 ms at approximately 1.5-ms increments. A double inversion recovery pulse was applied on the R wave, and the inversion time extended into diastole, generating a set of 6 similar images at increasing echo times ( Figure 1 ). One large full-thickness region of interest was placed in the mid-LV septum, distant from the lungs and cardiac veins, which are otherwise known to cause susceptibility artifacts ( Figure 2 ). The signal intensity of these regions of interest was plotted against the echo time used for each image. The resulting points form an assumed exponential decay curve, as the image signal decreases with increasing echo time. An exponential function was fitted to the data, using the following equation:
where K represents a constant, TE represents the echo time, and y represents the image signal intensity ( Figure 3 ). In 30 randomly selected patients, T2* measurement was repeated at least 1 month later by the same primary reader and by an additional investigator who was blinded to the results from the initial study to determine the reproducibility of T2* measurements. The reproducibility of T2* measurements was evaluated by calculating inter- and intraobserver variability, defined as the absolute difference between the corresponding repeated measurements and expressed in percentage of their mean.


