The distinction between normal right ventricular (RV) trabeculations from abnormal has been difficult. We evaluated whether RV volume and function are related to left ventricular (LV) noncompaction (NC) cardiomyopathy and clinical events. Trabeculations or possible LVNC by cardiac magnetic resonance imaging was retrospectively observed among 105 consecutive cases. We measured LV end-systolic (ES) noncompacted-to-compacted ratio, RV ejection fraction (EF), RV apical trabecular thickness, and RV end-diastolic (ED) noncompacted-to-compacted ratio. A control group of 40 subjects was also reviewed to assess the exploratory measures. Comparing those with LVES noncompacted-to-compacted ratio ≥2, those with LVES noncompacted-to-compacted ratio <2, and the normal control group, adjusted means for RV apical trabecular thickness and RVED noncompacted-to-compacted ratio were generated. Logistic regression was used to evaluate the association of composite events traditionally associated with LVNC with RVEF after adjustment for aforementioned covariates, cardiovascular risk factors, delayed enhancement, LVEF, and LVES noncompacted-to-compacted ratio. Analysis of RV morphology found greater apical trabecular thickness among those with LVES noncompacted-to-compacted ratio ≥2 compared with those with LVES noncompacted-to-compacted ratio <2 or normal control group (31 ± 5 vs 27 ± 2.6 vs 22 ± 4 mm; p = 0.03 and p = 0.003, respectively). There was no difference between the groups in relation to the RVED noncompacted-to-compacted ratio. Low RVEF and LVES noncompacted-to-compacted ratio ≥2 had significant association with clinical events in this population even after adjusting for clinical and imaging parameters (p = 0.04 and p <0.001, respectively). In conclusion, RV dysfunction in a morphologic LVNC population is strongly associated with adverse clinical events. LVNC is associated with increased trabeculations of the RV apex.
The most validated criteria for left ventricular (LV) noncompaction (NC) cardiomyopathy were proposed by Jenni et al. Although most reports have focused on the LV, limited studies with echocardiography and cardiac magnetic resonance imaging (cMRI) have described the possibility of right ventricular (RV) dysfunction associated with LV trabeculations. To determine whether RV structure or function is related to potential LVNC, we reviewed 105 cMRI cases where LV trabeculation was noted. We assessed RV size and ejection fraction (EF), as well as end-systolic (ES) measures of LVNC. In addition, several exploratory assessments for RV trabeculation were performed. For comparison, a normal control group of 40 subjects was reviewed against the study group. Finally, we assessed the relation between RV function and traditional LVNC events. We hypothesized that LVNC would be associated with morphological and functional changes of the RV, and that RVEF would be associated with traditional LVNC clinical events.
Methods
After obtaining institutional review board approval, we retrospectively queried the clinical cMRI database at Wake Forest Baptist Hospital for descriptions of trabeculation or NC. A total of 122 patients had cMRI studies performed from January 2007 to April 2011, who had reports that included these descriptors comprised our study population. Of these cases, 17 were excluded due to the presence of coronary artery disease. Given that 24 subjects met criteria for LVNC, a control group of 40 patients was used to compare RV morphological features. Clinical and demographic data were extracted from the electronic medical record.
Images were acquired on a 1.5 T (Avanto; Siemens Medical Solutions, Erlangen, Germany) using steady-state free precession. Cine images (echo time/repetition time 1.5/3.0 ms, flip angle 60°) were acquired in 3 long-axis views (i.e., 2-chamber, 3-chamber, and 4-chamber views), planned on short-axis pilots at 60° angles to each other. Multislice cine views were also acquired in short-axis plane from the base to the apex to visualize all 17 segments according to the American Heart Association recommendation. RV volumes were measured at end-diastole (ED) and ES with a modified Simpson’s technique, which involved assessing the area of right ventricle per slice multiplied by the slice thickness and summed from base to apex.
Using short-axis cine images, the noncompacted and compacted layers were visually identified, and the papillary muscles were specifically excluded from measurement. The region with the largest noncompacted-to-compacted ratio was measured at ES using WebPAX (Heart Imaging Technologies, LLC, Durham, North Carolina). Apical short-axis views 16 to 24 mm from the true apical slice were used for all measurements. In accordance with previously published standards, individuals were categorized as LVNC if the ES noncompacted-to-compacted ratio was ≥2.
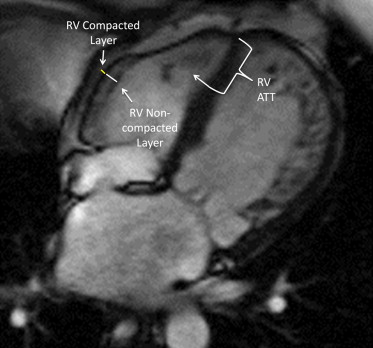
From the 4-chamber steady-state free precession cine images, the right ventricle was evaluated for the presence of apical and lateral wall trabeculations. At ED, the RV apical trabecular thickness was measured from the RV apical insertion point to the trabecular trough (see Figure 1 ). From the same images, the RV lateral wall compacted and noncompacted layers were identified and measured at ED (see Figure 1 ). To avoid overmeasuring the apical trabeculations, these measurements were only obtained at the lower midlevel. From these measurements, a RVED noncompacted-to-compacted ratio was calculated. An ED measurement was chosen because of the difficulty inherent in measuring the change in RV free wall thickness during the cardiac cycle.
Delayed enhancement images of the myocardium were reviewed and recorded as being present or absent. If any delayed enhancement was seen, it was categorized as present. If no delayed enhancement was seen, it was categorized as absent. Initially, we attempted to stratify by extent of delayed enhancement, but it provided no additional information above the delayed enhancement being present or absent.
Heart failure (HF) was defined as having a clinical diagnosis of HF by medical record.
The occurrences of death, HF readmission, embolic events, and ventricular arrhythmias were collected retrospectively as these have been previously associated with LVNC. To assess, both the medical chart and the social security death index were reviewed. Ventricular arrhythmias were required to have a reviewed cardiology consultation, Holter monitor or implanted loop recorder that documented it, or an electrophysiology study documenting ventricular tachycardia as a source of rhythm disturbance. HF readmissions, death, ventricular arrhythmias, and embolic events were pooled for statistical power and taken to represent a clinical phenotype of LVNC cardiomyopathy.
All cMRI baseline data are presented as mean ± SD. Nominal data were tested using the chi-square test. Continuous data were tested using Student t test. For this analysis, baseline variables are presented for the overall trabeculated population, the normal control group, those with LVES noncompacted-to-compacted ratio ≥2, and those with LVES noncompacted-to-compacted ratio <2. Adjusted means are presented with 95% confidence intervals.
Associations were further evaluated by analysis of covariance (ANCOVA) models. Adjustment was made for age, race, gender, and body surface area (BSA). RVED volume and RVEF were used as dependent variables to generate adjusted means by ES noncompacted-to-compacted ratio. The trabeculated population was stratified into those who met LVNC criteria and those who did not. Adjusting for the covariates aforementioned, in each group RVEF was compared between those with and without HF.
To describe the RV morphology, the population was divided into those who had LVES noncompacted-to-compacted ratio ≥2 and those with LVES noncompacted-to-compacted ratio <2. ANCOVA was used to generate adjusted means for the RV apical trabecular thickness and RV free wall noncompacted-to-compacted ratio in the control group, the ES noncompacted-to-compacted ratio ≥2group, and the LV noncompacted-to-compacted ratio <2group. Further adjustment was made for age, race, gender, and BSA.
Categorical data were analyzed using logistic regression. The dependent variable used was combined clinical events associated with LVNC. Covariates used for adjustment included age, race, gender, BSA, hypertension, hyperlipidemia, diabetes mellitus, HF, LVEF, the presence of delayed enhancement, LVES noncompacted-to-compacted ratio, and RVEF. Further analyses with logistic regression and receiver operating curve testing were performed to attempt to identify a potential cut-off value of RV apical trabecular thickness to help identify those with LVES noncompacted-to-compacted ratio ≥2. A p value of <0.05 was considered statistically significant. Correlations were also used to describe unadjusted linear relations. All statistical analyses were performed using SAS software, version 9.1 (SAS Institute Inc, Cary, North Carolina). All graphs were produced with GraphPad Software, version 4 (San Diego, California; www.graphpad.com ).
To assess interobserver and intraobserver agreements, a subset of cases were randomly selected and interpreted by a second reader blinded to all information (n = 20). Interobserver and intraobserver agreements were assessed with intraclass correlation analyzing the trabecular trough to apex length and mid-RV free wall compacted and noncompacted layer thickness.
Results
Baseline characteristics are listed in the first column of Table 1 . The overall population is predominantly Caucasian (69%) with approximately 1/3 having HF. Of 105 patients, 24 (23%) had an ES noncompacted-to-compacted ratio ≥2. Both the control group and those with LVES noncompacted-to-compacted ratio <2 had higher LV and RVEFs than the LVES noncompacted-to-compacted ratio ≥2 group. Scatter plots of RVEF and LVES noncompacted-to-compacted ratio by RV apical trabecular thickness are provided with simple linear regression analysis (see Figure 2 ).
| Variable | Overall Trabeculated Population (n = 105) | Control Group (n = 40) | LVES Noncompacted-to-Compacted Ratio ≥2 | |
|---|---|---|---|---|
| No (n = 81) | Yes (n = 24) | |||
| Age (yrs) | 57 ± 17.5 | 58 ± 13 | 57.8 ± 16.9 | 51 ± 19.5 |
| Black | 31 | 31 | 32 | 30 |
| Women | 52 | 57 | 48 | 58 |
| Body surface area (m 2 ) | 2.0 ± 0.4 | 2.01 ± 0.26 | 2.0 ± 0.3 | 1.9 ± 0.2 |
| Diabetes mellitus (diagnosed by physician) | 17 | 14 | 13 | 30 ∗,† |
| Hypertension (diagnosed by physician) | 56 | 62 | 58 | 50 |
| Hyperlipidemia (diagnosed by physician) | 35 | 42 | 32 | 39 |
| LVEF | 44 ± 16 | 61 ± 12 | 48.5 ± 14.6 | 31 ± 11.7 ∗,† |
| RVEF | 42.5 ± 15 | 59 ± 11 | 46 ± 13 | 35 ± 18 ∗,† |
| Heart failure | 20 | 0 | 18 | 30 ∗,† |
| Delayed enhancement present | 26 | 0 | 24 | 36 ∗,† |
∗ Statistical difference with p <0.05 in comparison between those with LVES noncompacted-to-compacted ratio ≥2 versus those with LVES noncompacted-to-compacted ratio <2.
† Statistical difference with p <0.05 in comparison between those with LVES noncompacted-to-compacted ratio ≥2 versus the normal, nontrabeculated control group.


