Patients with obstructive sleep apnea (OSA) have intermittent hypoxia leading to atrial remodeling and this has been associated with the development of atrial fibrillation (AF). Postoperative AF is a common complication of coronary artery bypass grafting (CABG). The aim of this prospective study was to determine whether the presence of OSA predicts the occurrence of post-CABG AF (PCAF). This was a prospective single-center study. Patients undergoing elective CABG were evaluated and categorized as confirmed, high-risk, or low-risk OSA according to a modified Berlin questionnaire. PCAF was evaluated by 24-hour cardiac monitoring strip or 12-lead electrocardiography during the postoperative period, and validated by an electrophysiologist. We included 277 patients. OSA prevalence was 47.7%, with body mass index (31.0 vs 26.9 kg/m 2 , p ≤0.001), advanced age (63.7 vs 66.4 years, p = 0.031), hypertension (78.0% vs 64.8%, p = 0.015), and diabetes (45.5% vs 28.3%, p = 0.003) more prevalent in the OSA group. PCAF was found to occur in 37.2% of all patients and OSA was found to be a strong predictor of PCAF (45.5% vs 29.7%, p = 0.007). PCAF was also associated with continuous positive airway pressure use (12.6% vs 5.2%, p = 0.027). Increased length of stay was associated with PCAF (6.5 vs 5.3 days, p = 0.006), as was longer time from surgery to occurrence of PCAF (p = 0.001). In conclusion, OSA was found to be a strong predictor of PCAF, which in turn was found to be associated with increased length of stay.
The association between obstructive sleep apnea (OSA) and atrial fibrillation (AF) and the physiological mechanisms underlying this relation have been well documented. OSA is a known predictor of AF, which is a common complication of coronary artery bypass grafting (CABG). Although it is known that OSA increases the risk of postoperative complications, very few studies have analyzed OSA as a predictor of post-CABG AF (PCAF). These studies were small and underpowered, thus not able to definitively characterize the role of OSA as a predictor of PCAF. Our study aims to determine if the presence of OSA is a predictor of PCAF, and whether this increases length of stay (LOS) postoperatively. If so, alterations in perioperative management of OSA may reduce the morbidity and health-care costs associated with PCAF.
Methods
We prospectively screened patients presenting for CABG surgery for OSA using a modified Berlin questionnaire (BQ). Patients were entered into the study before undergoing CABG surgery after obtaining appropriate consent. Patients were monitored until their discharge after surgery. To maintain blinding, results of the questionnaire were not shared with the patient or study personnel, nor correlated with surgical outcomes until study completion. We obtained internal review board approval from our institution.
We included 277 consecutive patients presenting for CABG surgery at a tertiary care hospital. Patients were grouped into 3 categories: (1) confirmed OSA; (2) high risk for OSA; and (3) low risk for OSA. The study population included only stable patients undergoing elective CABG. Patients with permanent AF were excluded. Primary end point was defined as the presence of PCAF before discharge from hospital. Secondary end point was LOS in hospital. Data for other postoperative complications including other arrhythmias and reintubation were also collected.
Patients were screened for OSA using a modified BQ (see Supplementary Material 1 ). As per our modified BQ, patients already diagnosed with OSA by way of polysomnography were considered confirmed for OSA. Otherwise, patients were defined as being at high risk or low risk for OSA as previously described by Netzer et al. The BQ has been validated as a suitable correlate for polysomnography and as a predictor of OSA in patients with coronary artery disease.
Patients were considered positive for PCAF if they developed AF after their CABG and before their discharge from hospital. Patients were monitored on continuous telemetry typically for a minimum of 72 hours postoperatively. PCAF was either directly observed by the attending cardiac surgeon or documented by cardiac monitoring strip, 12-lead electrocardiography, or 24-hour telemetry monitoring, and subsequently validated by an electrophysiologist or cardiothoracic surgeon. Episodes ≥2 minutes in duration were considered PCAF.
Data were collected in Excel and imported into IBM SPSS (version 21.0 for Windows, New York) for statistical analysis. Data were initially described using means and SDs for continuous data, and frequencies and percentages for categorical data. This was followed by a univariate analysis to assess the association of the collected data with the outcomes, using 1-way analysis of variance (low risk vs high risk vs confirmed) and independent samples t tests (low risk vs high risk + confirmed and PCAF yes or no) for the continuous data and chi-square tests (Pearson or Fisher’s exact, as appropriate) for the categorical data. LOS was analyzed using Spearman correlation (continuous data) and t tests or 1-way analysis of variance (categorical data). The Kruskal-Wallis and Mann-Whitney U tests were used in the event of nonnormal distributions. Variables were entered into a logistic regression model based on a potential association with the outcome (p <0.15). A multivariate logistic regression model for 2 of the outcomes, low risk versus high risk + confirmed and PCAF yes or no, was performed. Variables were removed using a manual stepwise approach. Variables were considered statistically significant if they attained a p value of <0.05, although those close to significance were retained if they were deemed clinically relevant.
Results
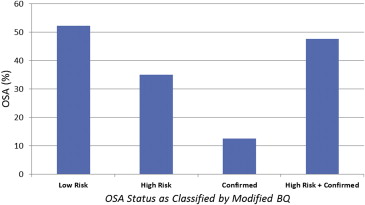
Demographic and clinical characteristics, listed in Table 1 , compare patients classified as high-risk or confirmed OSA with those classified as low-risk OSA as well as a comparison across all 3 categories (low risk vs high risk vs confirmed). In all, 277 patients were enrolled in this study. OSA was assessed in each patient using the modified BQ. As shown in Figure 1 , OSA prevalence was 47.7% (132 patients), this being split between patients classified as high-risk OSA (35%, 97 patients) and confirmed OSA (12.7%, 35 patients).
| Variable | Total | OSA High Risk + Confirmed | OSA Low Risk | p Value | OSA Confirmed | OSA High Risk | OSA Low Risk | p Value |
|---|---|---|---|---|---|---|---|---|
| Characteristics | ||||||||
| Age (yrs) | 65.1 ± 10.3 | 63.7 ± 10.7 | 66.4 ± 9.9 | 0.031 | 63.2 ± 10.3 | 63.9 ± 10.9 | 66.4 ± 9.9 | 0.093 |
| Men | 78.0 | 80.3 | 75.9 | 0.373 | 80.0 | 80.4 | 75.9 | 0.672 |
| Body mass index (kg/m 2 ) | 28.9 ± 5.3 | 31.0 ± 6.0 | 26.9 ± 3.6 | <0.001 | 33.1 ± 7.1 | 30.3 ± 5.4 | 26.9 ± 3.6 | <0.001 |
| Smokers | 35.4 | 31.1 | 39.3 | 0.152 | 25.7 | 33.0 | 39.3 | 0.265 |
| Hypertension | 71.1 | 78.0 | 64.8 | 0.015 | 80.0 | 77.3 | 64.8 | 0.051 |
| Diabetes mellitus | 36.5 | 45.5 | 28.3 | 0.003 | 60.0 | 40.2 | 28.3 | 0.001 |
| Chronic obstructive pulmonary disease | 14.4 | 12.1 | 16.6 | 0.295 | 8.6 | 13.4 | 16.6 | 0.453 |
| Asthma | 9.0 | 9.8 | 8.3 | 0.648 | 14.3 | 8.2 | 8.3 | 0.509 |
| History of paroxysmal AF | 4.7 | 5.3 | 4.1 | 0.647 | 2.9 | 6.2 | 4.1 | 0.655 |
| History of persistent AF | 3.2 | 1.5 | 4.8 | 0.120 | 2.9 | 1.0 | 4.8 | 0.261 |
| β-Blocker use | 66.8 | 63.6 | 69.7 | 0.288 | 62.9 | 63.9 | 69.7 | 0.565 |
| Continuous positive airway pressure use | 7.9 | 16.7 | 0.0 | <0.001 | 62.9 | 0.0 | 0.0 | <0.001 |
| Left ventricular ejection fraction (%) | 53.3 ± 10.5 | 52.7 ± 11.1 | 53.9 ± 10.0 | 0.452 | 56.7 ± 9.7 | 51.4 ± 11.3 | 53.9 ± 10.0 | 0.077 |
| Left atrial diameter (mm) | 40.4 ± 6.0 | 41.1 ± 6.2 | 39.8 ± 5.7 | 0.116 | 40.5 ± 6.3 | 41.3 ± 6.2 | 39.8 ± 5.7 | 0.242 |
| Intraoperative variables | ||||||||
| Revascularization of RCA | 35.0 | 45.4 | 54.6 | 0.575 | 40.0 | 30.9 | 36.6 | 0.537 |
| Use of intraoperative inotropes | 13.7 | 12.1 | 15.2 | 0.461 | 11.4 | 12.4 | 15.2 | 0.755 |
| Antegrade cardioplegia | 99.6 | 100.0 | 99.3 | 0.339 | 100.0 | 100.0 | 99.3 | 0.633 |
| Clamp time (minutes) | 55.1 ± 18.6 | 57.3 ± 19.3 | 53.2 ± 17.9 | 0.065 | 56.3 ± 20.0 | 57.6 ± 16.1 | 53.2 ± 17.9 | 0.172 |
| Intraoperative cardiac pacing | 36.8 | 40.2 | 33.8 | 0.273 | 45.7 | 38.1 | 33.8 | 0.400 |
| Postoperative variables | ||||||||
| Postoperative body temperature (°C) | 36.9 ± 0.5 | 36.9 ± 0.4 | 36.9 ± 0.6 | 0.225 | 36.9 ± 0.3 | 37.0 ± 0.4 | 36.9 ± 0.6 | 0.294 |
| Use of postoperative inotropes | 16.2 | 15.2 | 17.2 | 0.638 | 20.0 | 13.4 | 17.2 | 0.593 |
| Use of temporary pacing wire | 6.5 | 6.1 | 6.9 | 0.778 | 5.7 | 6.2 | 6.9 | 0.957 |
| β Blockers on discharge | 91.7 | 92.4 | 91.0 | 0.675 | 100.0 | 89.7 | 91.0 | 0.152 |
| Reintubation | 3.6 | 4.5 | 2.8 | 0.426 | 2.9 | 5.2 | 2.8 | 0.599 |
| β-Blocker prophylaxis | 86.3 | 86.4 | 86.2 | 0.970 | 82.9 | 87.6 | 86.2 | 0.780 |
| Postoperative atrial flutter | 3.2 | 3.8 | 2.8 | 0.629 | 5.7 | 3.1 | 2.8 | 0.672 |
| Postoperative other arrhythmia | 4.0 | 4.5 | 3.4 | 0.640 | 2.9 | 5.2 | 3.4 | 0.750 |
| Outcomes | ||||||||
| Presence of PCAF | 37.2 | 45.5 | 29.7 | 0.007 | 51.4 | 43.3 | 29.7 | 0.017 |
| Time after surgery (days) | 2.3 ± 1.8 | 2.1 ± 1.1 | 2.6 ± 2.4 | 0.182 | 2.1 ± 0.6 | 2.1 ± 1.3 | 2.6 ± 2.4 | 0.410 |
| LOS (days) | 5.7 ± 3.8 | 5.6 ± 3.1 | 5.8 ± 4.3 | 0.220 | 5.7 ± 2.3 | 5.6 ± 3.3 | 5.8 ± 4.3 | 0.194 |
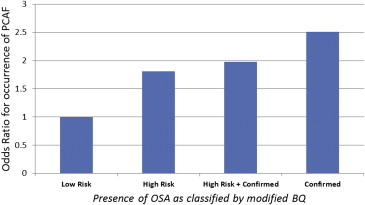
PCAF was found to occur in 37.2% of patients. High-risk OSA was found to be a predictor of PCAF (45.5% vs 29.7%, p = 0.007; Figure 2 ). This observation was seen across the 3 patients populations (confirmed vs high risk vs low risk, 51.4% vs 43.3% vs 29.7%, p = 0.017). The interval time until onset of PCAF was not different among groups. No difference was observed between high-risk and low-risk OSA in LOS, occurrence of postoperative atrial flutter, other postoperative arrhythmias, or reintubation.
Increased LOS was associated with PCAF (6.5 vs 5.3 days, p = 0.007), as was longer time from surgery to occurrence of PCAF (p = 0.001). Longer LOS was associated with increased age (p <0.001), female gender (7.5 vs 5.2 days, p = 0.001), hypertension (5.9 vs 5.5 days, p = 0.047), asthma (6.4 vs 5.7 days, p = 0.025), use of postoperative inotropes (8.0 vs 5.3 days, p <0.001), reintubation (19.7 vs 5.2 days, p <0.001), and postoperative arrhythmia other than atrial flutter or AF (11.2 vs 5.5 days, p <0.001).
Several factors were associated with both high-risk OSA and PCAF in the logistic regression models ( Table 2 ). In the model for high-risk OSA, for every 5-point increase in body mass index, there was a 2.61 times increased likeliness of having high-risk OSA (p ≤0.001). Although not statistically significant, an increase in clamp time of 10 minutes was associated with a 1.14 times increased likeliness of having high-risk OSA (p = 0.074). In the model for PCAF, presence of high-risk OSA meant one was 2.18 times more likely to develop PCAF. Use of a temporary pacing made PCAF 2.55 times more likely.
| Covariates | Odds Ratio | 95% Confidence Interval | p Value |
|---|---|---|---|
| Model for OSA high/confirmed | |||
| BMI (5-point increase) | 2.61 | 1.89–3.62 | <0.001 |
| Clamp time (10-minute increase) | 1.14 | 1.13–3.35 | 0.074 |
| Model for PCAF | |||
| Smoking history | 0.57 | 0.33–1.00 | 0.048 |
| Use of temporary wire | 2.55 | 0.94–6.89 | 0.065 |
| OSA high/confirmed | 2.18 | 1.30–3.65 | 0.003 |
Stay updated, free articles. Join our Telegram channel

Full access? Get Clinical Tree


