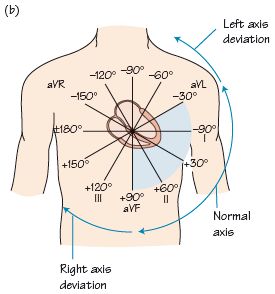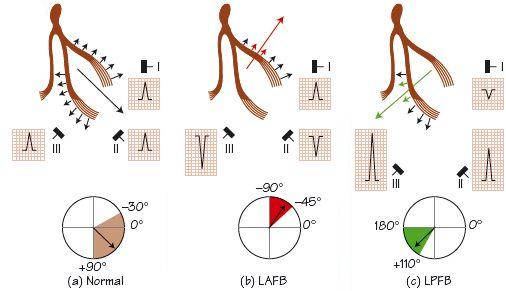
Fig. 10.2 Mechanism of axis deviation in partial left bundle damage. (a) Normal: current passes down the specialized conducting tissue, with the left ventricle dominating the axis, as this is much larger than the right ventricle. The left bundle is divided into two branches, the anterior hemi-fascicle, and the much larger posterior hemi-fascicle, which respectively supply the antero-superior and postero-inferior part of the left ventricle. When the anterior hemi-fascicle is blocked (b), this part of the heart is activated late, so resulting in left axis deviation. Likewise, when the larger left posterior hemi-fascicle is blocked (c), the part of the heart normally supplied by this conducting tissue is activated late, resulting in right axis deviation. A convenient way to remember which axis deviation results from which hemi-fascicular block is to remember that left anterior hemi-fascicular block causes left axis deviation. LAFB, left anterior fascicular block; LPFB, left posterior fascicular block.

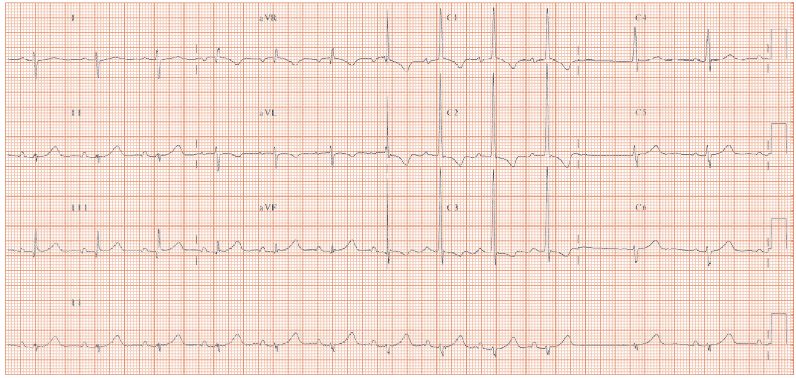
Fig. 10.3 Right axis deviation in right ventricular hypertrophy (RVH). The sequence of ECG changes with increasingly severe RVH is: (i) the earliest sign is right axis deviation; (ii) next the R wave in lead V1 increases in size; (iii) finally, right bundle branch block occurs. This ECG shows gross RVH. The features include: (a) some prominence to the P wave in lead II, suggestive (not diagnostic) of right atrial enlargement; (b) QRS axis shifted to the right (negative QRS in lead I and II, +ve QRS in lead III; the computer calculation of the axis is 151°); (c) dominant R wave in lead V1, highly prominent R waves in leads V2 and V3; (d) an unusual feature is the small R waves in the left lateral chest leads – common in patients with RVH due to congenital heart disease (as here) but not in other causes of RVH.

Stay updated, free articles. Join our Telegram channel

Full access? Get Clinical Tree


