Pulmonary Hypertension and Pulmonary Vein Stenosis
Pulmonary hypertension traditionally is defined as pulmonary artery systolic pressure (PASP) greater than 25 mm Hg at rest (>30 mm Hg with exercise) (1). It is frequently a manifestation of various systemic and cardiac diseases. If there is no underlying reason for pulmonary hypertension, it is called “primary pulmonary hypertension.” Various causes of pulmonary hypertension are listed, according to the pathophysiologic mechanism, in Table 9-1. However, increased PASP can be due to increased pulmonary flow, as in atrial septal defect. A more complete definition of pulmonary hypertension should include increased pulmonary vascular resistance (PVR), which can be derived from recordings of tricuspid regurgitation and right ventricular outflow tract (RVOT) flow velocities (2,3).
The determination of pulmonary artery pressure is a routine part of an echocardiography examination. Although certain two-dimensional (2D) echocardiographic features suggest pulmonary hypertension, Doppler echocardiography is the primary method for determining actual pulmonary pressures. Systolic and diastolic pulmonary artery pressures are determined from the tricuspid and pulmonary regurgitation velocities, respectively. Transesophageal echocardiography (TEE) provides superb visualization of the main pulmonary trunk, right pulmonary artery, proximal portion of the left pulmonary artery, and all four pulmonary veins and, hence, is useful in detecting pulmonary artery thromboembolism and pulmonary vein stenosis. After pulmonary hypertension has been diagnosed, echocardiography may be helpful in identifying a cardiovascular cause.
Two-Dimensional Echocardiography
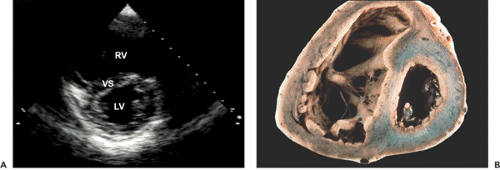
Pulmonary hypertension is easily recognized when the following M-mode and 2D echocardiographic features are present (see Figs. 2-4 and 2-19 I and 9-1) (4,5):
Diminished or absent “a” (atrial) wave of the pulmonary valve
Midsystolic closure or notching of the pulmonary valve
Enlarged chambers on the right side of the heart
D-shaped left ventricular (LV) cavity caused by a flattened ventricular septum
The ventricular septum is flattened during both systole and diastole in pulmonary hypertension but only during diastole in right ventricular (RV) volume overload. However, these features are not sensitive for pulmonary hypertension. They are qualitative and do not provide actual hemodynamic data.
Doppler Echocardiography
Doppler echocardiography allows estimation of pulmonary artery pressures and PVR by measuring tricuspid
regurgitation velocity, pulmonary regurgitation velocity, and RVOT flow velocity.
regurgitation velocity, pulmonary regurgitation velocity, and RVOT flow velocity.
Table 9-1 Etiologic classification of pulmonary hypertension | |||
|---|---|---|---|
| |||
Tricuspid Regurgitation Velocity
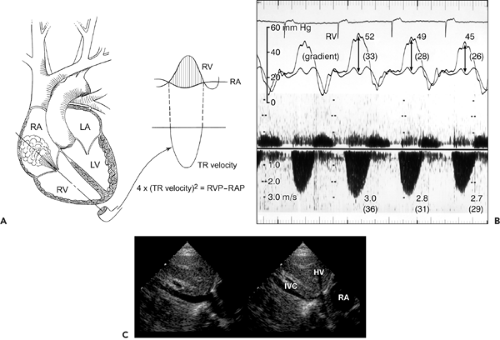
Tricuspid regurgitation velocity usually is obtained with continuous wave Doppler (using either an imaging duplex transducer or a nonimaging transducer) from the RV inflow or the apical four-chamber view position. From the apical position, the transducer needs to be angled more medially and inferiorly from the mitral valve signal. Tricuspid regurgitation velocity reflects the pressure difference during systole between the RV and the right atrium (RA) (6,7,8,9) (Fig. 9-2). Therefore, systolic RV pressure can be estimated by adding RA pressure to the transtricuspid gradient derived from tricuspid regurgitation velocity, that is,
Transtricuspid pressure gradient = 4 × Tricuspid regurgitation velocity2
The RA pressure can be estimated clinically by measuring jugular venous pressure or from the respiratory motion of the inferior vena cava seen on 2D echocardiograms. When the diameter of the inferior vena cava decreases by 50% or more with inspiration (Fig. 9-2 C), RA pressure is
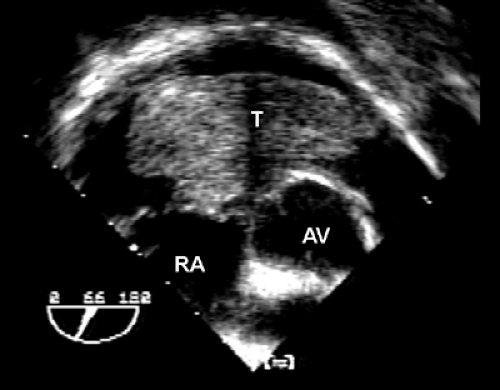
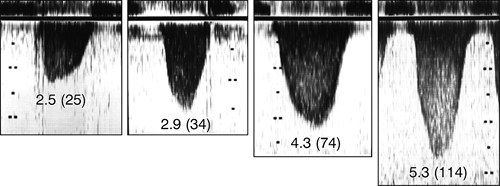
usually less than 10 mm Hg, and those with less than 50% inspiratory collapse tend to have an RA pressure more than 10 mm Hg (9). In the absence of pulmonic stenosis or RVOT obstruction, RV systolic pressure is equal to PASP (Fig. 9-3). The normal tricuspid regurgitation velocity is 1.7 to 2.3 m/s at rest. A higher velocity indicates pulmonary hypertension, RVOT obstruction, or pulmonic stenosis. Four different tricuspid regurgitation velocity recordings are shown in Figure 9-4. Tricuspid regurgitation velocity may be less than 2.0 m/s when RA pressure is markedly increased because of RV infarct, RV failure, or severe tricuspid regurgitation (Fig. 9-5). Therefore, increased tricuspid regurgitation velocity represents increased RV systolic pressure, not the severity of tricuspid regurgitation.
usually less than 10 mm Hg, and those with less than 50% inspiratory collapse tend to have an RA pressure more than 10 mm Hg (9). In the absence of pulmonic stenosis or RVOT obstruction, RV systolic pressure is equal to PASP (Fig. 9-3). The normal tricuspid regurgitation velocity is 1.7 to 2.3 m/s at rest. A higher velocity indicates pulmonary hypertension, RVOT obstruction, or pulmonic stenosis. Four different tricuspid regurgitation velocity recordings are shown in Figure 9-4. Tricuspid regurgitation velocity may be less than 2.0 m/s when RA pressure is markedly increased because of RV infarct, RV failure, or severe tricuspid regurgitation (Fig. 9-5). Therefore, increased tricuspid regurgitation velocity represents increased RV systolic pressure, not the severity of tricuspid regurgitation.
Tricuspid regurgitation is present in more than 75% of the normal adult population. When the tricuspid regurgitation jet is trivial and its continuous wave Doppler spectrum is suboptimal, injection of agitated saline solution into an arm vein enhances the tricuspid regurgitation velocity signal (Fig. 9-6).
Tricuspid Regurgitation Velocity with Exercise
Pulmonary pressure increases mildly with exercise, and it will be helpful to know the range of its increase in normal subjects. Bossone and colleagues (10) demonstrated that athletes have higher tricuspid regurgitation velocities than healthy control subjects at rest (2.25 vs. 1.72 m/s) and during supine bike exercise (3.11 vs. 2.46 m/s at 160 W) because of higher stroke volume and cardiac output in athletes. It appears that well-conditioned athletes are capable of reaching a PASP of 60 mm Hg with exercise.
Technical Caveat
Tricuspid regurgitation velocity usually varies with respiration, being lower with inspiration, which increases the volume of tricuspid regurgitation and decreases the transtricuspid gradient. To avoid respiratory variation, tricuspid regurgitation velocity usually is obtained with a patient in held-expiration. Doppler velocity recordings from patients with aortic stenosis or mitral regurgitation can mimic the tricuspid regurgitant jet. All three Doppler jets move away from the apex, but they can be differentiated by angulation of the transducer, Doppler peak velocity, flow duration, and the accompanying diastolic signal (see Chapter 4). Tricuspid regurgitation is directed most medially and tricuspid inflow (diastole) velocity is usually less than 0.5 m/s unless tricuspid regurgitation is severe or the tricuspid valve is
stenotic. Flow duration is shortest in aortic stenosis. The peak velocity of the mitral regurgitant jet is usually, but not always (in patients with hypotension and/or a marked increase in left atrial [LA] pressure), greater than 4 m/s and always greater than that of aortic stenosis in the same patient.
stenotic. Flow duration is shortest in aortic stenosis. The peak velocity of the mitral regurgitant jet is usually, but not always (in patients with hypotension and/or a marked increase in left atrial [LA] pressure), greater than 4 m/s and always greater than that of aortic stenosis in the same patient.
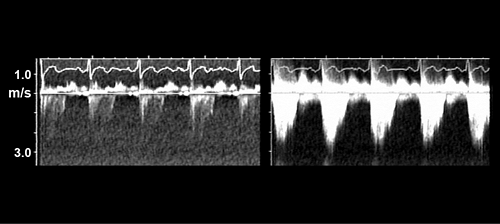 Figure 9-6 Continuous wave Doppler recording of tricuspid regurgitation velocity without (left) and with (right) injection of agitated saline. |
As tricuspid regurgitation velocity increases, there is a greater potential to miscalculate PASP by making a slight error in tricuspid regurgitation velocity measurements. If the Doppler gain is too high, the peak velocity measurement is often overestimated (see Fig. 4-12).
Pulmonary Regurgitation Velocity
Stay updated, free articles. Join our Telegram channel

Full access? Get Clinical Tree


