Low-gradient (LG), low-flow (LF), severe aortic stenosis (AS) with preserved ejection fraction (PEF) is considered by some authors as an advanced form of AS associated with very poor outcome. The aim of this Doppler echocardiographic study was to investigate changes over time in the hemodynamic severity of LG/LF AS with PEF. We retrospectively identified in 2 academic centers 59 patients who had 2 Doppler echocardiographic examinations without an intervening event. After a median follow-up of 2 (interquartile range [IQR] 1.3 to 3.5) years, progression was observed with increase in mean Doppler gradient (MDG; from 27 [23 to 32] to 37 [28 to 44] mm Hg; p <0.001), peak aortic jet velocity (from 330 [314 to 366] to 373 [344 to 423] cm/s; p <0.001), and decrease in aortic valve area (AVA; from 0.73 [0.63 to 0.92] to 0.64 [0.56 to 0.75] cm 2 ; p = 0.001). Annual rates were, respectively, 8 mm Hg/year, 36 cm/s/year, and −0.04 cm 2 /year. EF decreased from 62% (55% to 69%) to 58% (51% to 65%), p = 0.001. At follow-up, MDG increase was observed in 51 patients (86%), and 24 patients (41%) acquired the features of classical high-gradient (HG) severe AS (MDG ≥40 mm Hg and peak aortic jet velocity ≥400 cm/s). There were no differences as regard to baseline hemodynamic parameters between patients who displayed ≥5 mm Hg MDG increase and those in whom such increase was not observed. In conclusion, most patients with LG/LF AS with PEF exhibit over time increase in MDG and decrease in AVA with slight EF impairment. This result suggests that LG/LF AS with PEF is an intermediate stage between moderate AS and HG AS rather than an advanced form of the disease.
The outcome of low-gradient (LG), low-flow (LF), severe aortic stenosis (AS) with preserved ejection fraction (PEF) is classically described as dismal on the basis of the results of a few nonrandomized studies. At diagnosis, these patients present with small left ventricular (LV) volumes, severe hypertrophy, restrictive filling pattern, occult systolic dysfunction, and increased myocardial fibrosis, features interpreted by some authors as markers of an advanced form of AS. Current guidelines advocate surgery for symptomatic LG/LF AS with PEF when there is evidence that symptoms are due to the valvular obstacle. However, a subanalysis of the Simvastatin and Ezetimibe in Aortic Stenosis (SEAS) trial and 2 European studies find that the outcome of LG AS and LG/LF AS with PEF is less malignant than previously reported and probably comparable to that of moderate AS. Moreover, magnetic resonance imaging data demonstrate that LG AS is characterized by larger aortic valve area (AVA) compared with high-gradient (HG) AS with PEF. These findings raise questions on the high risk previously attributed to LG/LF AS with PEF. Given the paucity of data on the evolution of hemodynamic parameters over time in LG AS and the lack of such data for patients with LG/LF AS with PEF, the controversy is ongoing. We therefore studied the evolution over time of echo Doppler parameters in patients with LG/LF AS and PEF and hypothesized that from a hemodynamic point of view, LG/LF AS with PEF represents an intermediate entity between moderate AS and HG AS.
Methods
We retrospectively identified all cases of LG/LF AS with PEF diagnosed from 2003 to 2014 at the echocardiography laboratories of 2 academic centers (Center Hospitalier Universitaire d’Amiens, Amiens, France, and Cliniques Universitaires Saint-Luc, Bruxelles, Belgium). Inclusion criteria were (1) presence of LG/LF AS with PEF diagnosed by transthoracic echocardiography on the basis of the following criteria: AVA <1 cm 2 , indexed AVA <0.6 cm 2 , MDG <40 mm Hg, indexed stroke volume <35 ml/m 2 , and ejection fraction (EF) ≥50% and (2) availability of a second follow-up Doppler echocardiographic examination. We excluded (1) patients with more than mild aortic and/or mitral regurgitation; (2) patients experiencing aortic valve replacement between the 2 examinations; and (3) patients who denied authorization for research participation. The second echocardiography was performed when planned in the patient’s follow-up or when requested by the patient’s referring cardiologist. When several follow-up echocardiograms were performed, we took into analysis the last one available. We obtained institutional review board authorizations before conducting the study. The study was conducted in accordance with institutional policies, national legal requirements, and the revised Helsinki declaration.
Peak aortic jet velocity was recorded using continuous-wave Doppler in several acoustic windows (apical 5-chamber view, right parasternal, suprasternal, epigastric). The highest aortic velocity was used to calculate aortic time–velocity integral and MDG. LV outflow tract diameter was measured in a zoomed cine loop of the parasternal long-axis view in midsystole, at the level of the aortic cusps insertion. Pulsed Doppler LV outflow tract velocity was recorded in the apical 5-chamber view with the sample volume at 5 mm proximal from the plane of the aortic valve. The alignment of both pulsed- and continuous-wave Doppler was optimized to be parallel with the flow. Careful measurements of the outflow tract diameter in zoomed parasternal views and multiple acoustic windows for continuous-wave Doppler including the right parasternal window were systematically performed. Pressure gradients were calculated using the simplified Bernoulli equation. AVA was calculated by the continuity equation and indexed for body surface area. Stroke volume was calculated by multiplying the area of the LV outflow tract by the outflow tract time–velocity integral. Aortic valve calcification score was assessed. EF and ventricular volumes were calculated using Simpson biplane method. LV mass was estimated by the formula on the basis of linear measurements and indexed for body surface area. Rapid progression was defined as ≥5 mm Hg increase in MDG between baseline and follow-up.
Statistical analysis was performed using STATA 12.0 (StataCorp LP, College Station, Texas). Categorical variables were summarized as counts and frequency percentages. Because of skewed distribution, continuous variables were expressed as median and interquartile range. For comparisons of independent samples, categorical variables were compared by use of chi-square tests and continuous variables by Mann–Whitney U tests. For paired analyses, McNemar and Wilcoxon signed ranks tests, respectively, were used. Annualized progression was calculated as the difference between the last measurement and the first measurement divided by the duration of the follow-up. All p values are results of 2-tailed tests. p Values <0.05 were considered statistically significant.
Results
The baseline demographic, clinical, and hemodynamic characteristics of the 59 study patients are displayed in Tables 1 and 2 . The delay between the 2 echocardiographic examinations was 2 (1.3 to 3.5) years.
| Age (years) | 80 (74-84) |
| Men | 26 (44%) |
| Body mass index (kg/m 2 ) | 26 (24-31) |
| Body surface area (m 2 ) | 1.8 (1.7-1.9) |
| Heart rate (beats/minute) | 72 (66-90) |
| Systolic blood pressure (mm Hg) | 140 (130-160) |
| Diastolic blood pressure (mm Hg) | 80 (70-90) |
| Hypertension | 51 (86%) |
| Diabetes mellitus | 14 (24%) |
| Dyslipidemia | 40 (68%) |
| Smoker | 18 (31%) |
| Coronary artery disease | 23 (39%) |
| History of atrial fibrillation | 24 (41%) |
| Chronic obstructive pulmonary disease | 4 (7%) |
| Prior stroke | 14 (24%) |
| New York Heart Association class | |
| I-II | 40 (68%) |
| III-IV | 19 (32%) |
| Variable | Baseline | Follow-up | p value |
|---|---|---|---|
| Aortic valve area (cm 2 ) | 0.73 (0.63-0.92) | 0.64 (0.56-0.75) | 0.001 |
| Indexed aortic valve area (cm 2 /m 2 ) | 0.40 (0.36-0.49) | 0.35 (0.30-0.42) | 0.002 |
| Peak aortic jet velocity (cm/s) | 330 (314-366) | 373 (344-423) | <0.001 |
| Transaortic mean pressure gradient (mmHg) | 27 (23-32) | 37 (28-44) | <0.001 |
| Aortic valve velocity time integral (cm) | 74 (65-85) | 89 (79-99) | <0.001 |
| Dimensionless index | 0.24 (0.17-0.29) | 0.22 (0.16-0.27) | 0.02 |
| Severe aortic valve calcification | 29 (49%) | 32 (54%) | 0.38 |
| LV outflow tract diameter (mm) | 20 (19-20) | 20 (19-20) | 0.80 |
| LV outflow tract velocity time integral (cm) | 18 (16-21) | 18 (16-23) | 0.14 |
| Stroke volume (ml) | 53 (45-63) | 55 (48-61) | 0.20 |
| Indexed stroke volume (ml/m 2 ) | 30 (25-35) | 31 (27-35) | 0.18 |
| Cardiac output (ml/min) | 4.1 (3.2-4.9) | 3.9 (3.5-4.6) | 0.45 |
| Cardiac index (ml/min/m 2 ) | 2.3 (1.9-2.6) | 2.1 (1.9-2.5) | 0.49 |
| Heart rate (/min) | 72 (66-90) | 71 (63-82) | 0.21 |
| Indexed LV end-diastolic volume (ml/m 2 ) | 52 (44-71) | 55 (46-79) | 0.11 |
| Indexed LV end-systolic volume (ml/m 2 ) | 20 (14-28) | 25 (17-37) | 0.03 |
| Ejection fraction (%) | 62 (55-69) | 58 (51-65) | 0.001 |
| Concentric remodeling ∗ | 31 (53%) | 38 (64%) | 0.13 |
| Valvulo-arterial impedance (mm Hg/ml/m 2 ) | 5.7 (4.9-6.9) | 5.8 (4.7-7.3) | 0.68 |
∗ Concentric remodeling was defined by a relative wall thickness index >0.42 in the absence of left ventricular hypertrophy.
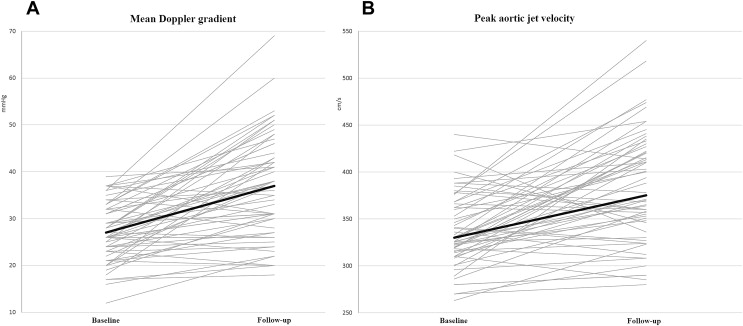
At follow-up, MDG showed a 10 ± 9 mm Hg mean increase compared to baseline ( Table 2 and Figure 1 ) corresponding to a mean annual progression rate of 8 mm Hg/year (median 4 [0.7 to 9] mm Hg/year). Overall, MDG increase was observed in 51 patients (86%), decrease in 7 (12%), and in 1 patient (2%), MDG remained unchanged. In 41 patients (69%), the mean MDG increase between baseline and follow-up was ≥5 mm Hg, whereas in 2 patients, a mean MDG reduction ≥5 mm Hg was observed. The only differences between patients who displayed ≥5 mm Hg MDG increase and patients in whom such increase was not observed were younger age and less frequency of coronary artery disease for patients with MDG increase ≥5 mm Hg. There were no differences between the groups as regard to baseline echo-Doppler parameters.

Compared to baseline, peak aortic jet velocity increased by 41 ± 22 cm/s ( Table 2 and Figure 1 ), corresponding to a mean annual progression rate of 36 cm/s/year (median 22 [2 to 47] cm/s/year). In the group of 44 patients showing an increase in peak aortic jet velocity at follow-up, mean annual progression rate was 55 cm/s/year. In 36 patients (61%), the increase in peak aortic jet velocity between baseline and follow-up was ≥30 cm/s, whereas 3 patients showed a reduction of ≥30 cm/s.
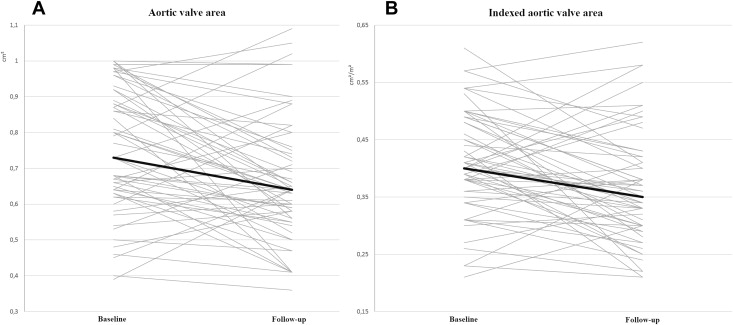
At follow-up, mean AVA reduction was −0.09 ± 0.18 cm 2 ( Table 2 and Figure 2 ), reflecting a mean annual progression rate of −0.04 cm 2 /year (median −0.05 [−0.11 to 0.01] cm 2 /year). Mean annual AVA reduction was −0.09 cm 2 /year in the 43 patients in whom AVA decrease was observed at follow-up. Indexed AVA also showed significant decrease at follow-up compared to baseline ( Table 2 and Figure 2 ). Absolute AVA decrease ≥0.1 cm 2 was observed in 29 patients (49%). In 3 patients, at follow-up, AVA became ≥1 cm 2 associated with an increase in indexed stroke volume, suggesting pseudosevere AS.


