The comparative data for angioplasty and stenting for treatment of peripheral arterial disease are largely limited to technical factors such as patency rates with sparse data on clinical outcomes like mortality, postprocedural complications, and amputation. The study cohort was derived from the Healthcare Cost and Utilization Project Nationwide Inpatient Sample database from 2006 to 2011. Peripheral endovascular interventions were identified using appropriate International Classification of Diseases, Ninth Revision ( ICD-9 ) Diagnostic and procedural codes. Two-level hierarchical multivariate mixed models were created. The primary outcome includes inhospital mortality, and secondary outcome was a composite of inhospital mortality and postprocedural complications. Amputation was a separate outcome. Hospitalization costs were also assessed. Endovascular stenting (odds ratio, 95% confidence interval, p value) was independently predictive of lower composite end point of inhospital mortality and postprocedural complications compared with angioplasty alone (0.96, 0.91 to 0.99, 0.025) and lower amputation rates (0.56, 0.53 to 0.60, <0.001) with no significant difference in terms of inhospital mortality alone. Multivariate analysis also revealed stenting to be predictive of higher hospitalization costs ($1,516, 95% confidence interval 1,082 to 1,950, p <0.001) compared with angioplasty. In conclusion, endovascular stenting is associated with a lower rate of postprocedural complications, lower amputation rates, and only minimal increase in hospitalization costs compared with angioplasty alone.
Peripheral arterial disease (PAD), affecting >14.5% of the US population aged >70 years, is the third leading cause of cardiovascular morbidity after myocardial infarction and stroke. Peripheral endovascular interventions have largely replaced surgery as the primary technique for treatment of PAD. Sufficient literature in the past has shown comparable technical success and long-term outcomes between endovascular interventions and surgery for PAD with an added advantage of low periprocedural complication rates (0.5% to 4%). Early success with angioplasty was, however, limited by unacceptable restenosis rates especially in long and complex disease. Although initial studies with stainless steel stents were met with disappointing results, recent improvements in stent design including development of self-expanding nitinol stents has led to favorable outcomes. Nonetheless, the comparative data for angioplasty and stenting are largely limited to technical factors such as patency rates with sparse data on clinical outcomes like mortality and limb salvage or amputation. The primary objective of our study was to compare the inhospital outcomes after angioplasty and endovascular stenting for PAD in terms of mortality, postprocedural complications, and hospitalization costs from a large national database. We further assessed the variation in utilization of these revascularization strategies across the nation.
Methods
The study cohort was derived from the Nationwide Inpatient Sample (NIS) database from 2006 to 2011, a subset of the Healthcare Cost and Utilization Project sponsored by the Agency for Healthcare Research and Quality. The NIS is the largest publicly available all-payer inpatient care database in the United States, including data on approximately 7 to 8 million discharges per year, and is a stratified sample designed to approximate a 20% sample of US community (nonfederal, short term, general, and specialty) hospitals. National estimates are produced using sampling weights provided by the sponsor. The details regarding the NIS data have been previously published.
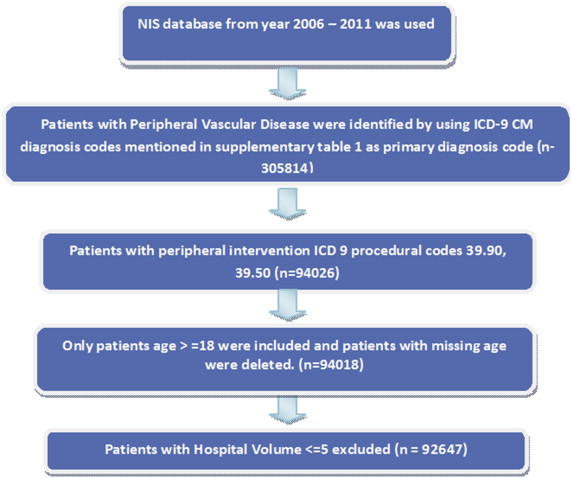
Ascertainment of all diagnoses and procedures was made using the International Classification of Diseases, Ninth Revision, Clinical Modification ( ICD-9-CM ) codes. Peripheral vascular disease was identified by all diagnoses codes mentioned in Supplementary Table 1 as primary diagnosis codes. Patients <18 years were excluded, and peripheral endovascular interventions were identified using ICD-9 procedural codes 39.90 and 39.50 (n = 92,647; Figure 1 , Supplementary Table 1 ).
The primary outcome was occurrence of inhospital mortality; secondary outcome was a composite of inhospital mortality and periprocedural complications. Amputation was assessed as a separate outcome. Preventable procedural complications were identified by patient safety indicators (PSIs), version 4.4, March 2012. These indicators are based on ICD-9-CM codes and Medicare Severity Diagnosis-Related Groups, and each PSI has specific inclusion and exclusion criteria. Amputation and other procedure-related complications, which included postprocedure hemorrhage requiring blood transfusion, other iatrogenic respiratory complications (which included ventilator-associated pneumonia, postprocedure aspiration pneumonia, and other respiratory complications not elsewhere classified), postprocedural stroke or transient ischemic attack, and other vascular complications, were identified using ICD-9-CM codes (listed in Supplementary Table 2 ) in any secondary diagnosis field. Vascular complications were defined as PSI code for accidental puncture or ICD-9-CM codes for injury to blood vessels, creation of arteriovenous fistula, vascular complications requiring surgery, vascular device/graft/implant complications, and other vascular complications not elsewhere classified. “Any complications” was defined as occurrence of ≥1 postprocedure complications listed in Supplementary Table 2 . Similar methodology has been used before. NIS variables were used to identify patient’s demographic characteristics including age, gender, and race ( Table 1 ). We defined severity of co-morbid conditions using Deyo’s modification of Charlson co-morbidity index (CCI ; Supplementary Table 3 ). Facilities were considered to be teaching hospitals if they had an American Medical Association–approved residency program, were a member of the Council of Teaching Hospitals, or had a full-time equivalent interns and residents to patient’s ratio of ≥0.25. The Healthcare Cost and Utilization Project (HCUP) NIS contains data on total charges for each hospital in the databases, which represents the amount that hospitals billed for services. To calculate estimated cost of hospitalizations, the NIS data were merged with cost-to-charge ratios available from HCUP. Adjusted cost for each year was calculated in terms of the 2011 cost, after adjusting for inflation according to the latest consumer price index data released by the US government on January 16, 2013.
| Variables | Angioplasty | Stent | Overall | P-value |
|---|---|---|---|---|
| Overall(unweighted) | 44,399(47.9%) | 48,248(52.1%) | 92,647 | |
| Overall(weighted) | 2,16,830(47.8%) | 2,36,964(52.2%) | 4,53,794 | |
| Age(Years) | <0.001 | |||
| 18-34 | 0.3% | 0.2% | 0.3% | |
| 35-49 | 5% | 4.8% | 4.9% | |
| 50-64 | 27% | 29.6% | 28.4% | |
| 65-79 | 44.2% | 45.3% | 44.7% | |
| >=80 | 23.5% | 20.2% | 21.8% | |
| Female | 45.2% | 45.2% | 45.2% | |
| White | 55.3% | 63.3% | 59.5% | |
| Non-white | 27.6% | 19.5% | 23.3% | |
| Missing | 17.2% | 17.2% | 17.2% | |
| Charlson/deyo comorbidity index ∗ | <0.001 | |||
| 0 | 25.4% | 31.6% | 28.6% | |
| 1 | 29.4% | 31.2% | 30.3% | |
| >=2 | 45.2% | 37.3% | 41.1% | |
| Obesity | 6.6% | 5.6% | 6.1% | <0.001 |
| Hypertension | 74.9% | 74% | 74.4% | <0.001 |
| Diabetes mellitus | 47.1% | 38% | 42.4% | <0.001 |
| Heart failure | 5.3% | 3.7% | 4.5% | <0.001 |
| Chronic pulmonary disease | 18% | 22.7% | 20.5% | <0.001 |
| Renal failure | 32.4% | 24.6% | 28.3% | <0.001 |
| Neurological disorder or paralysis | 5.7% | 5% | 5.3% | <0.001 |
| Anemia or coagulopathy | 17.8% | 13.7% | 15.7% | <0.001 |
| Hematological or oncological malignancy | 1.7% | 1.8% | 1.7% | 0.002 |
| Weight loss | 2.9% | 2.1% | 2.5% | <0.001 |
| Rheumatoid arthritis or other collagen vascular | 2.3% | 2% | 2.1% | <0.001 |
| Depression, psychosis or substance abuse | 6.9% | 6.9% | 6.9% | 0.243 |
| Median household income category for patient’s zip code † (percentile) | <0.001 | |||
| 1. 0-25th | 32.8% | 30.4% | 31.6% | |
| 2. 26-50th | 25.5% | 26.8% | 26.2% | |
| 3. 51-75th | 21.7% | 22.3% | 22% | |
| 4. 76-100th | 17.6% | 18.4% | 18% | |
| Primary Payer | <0.001 | |||
| Medicare / Medicaid | 78.2% | 74.9% | 76.5% | |
| Private including HMO | 18.1% | 21% | 19.6% | |
| Self pay/no charge/other | 3.5% | 4.1% | 3.8% | |
| Hospital bed size | <0.001 | |||
| Small | 10.4% | 9.7% | 10% | |
| Medium | 22.3% | 21.1% | 21.7% | |
| Large | 66.7% | 68.5% | 67.7% | |
| Hospital Location | <0.001 | |||
| Rural | 6.5% | 7.6% | 7% | |
| Urban | 92.9% | 91.8% | 92.3% | |
| Hospital Region | <0.001 | |||
| Northeast | 17.8% | 19.3% | 18.6% | |
| Midwest or North Central | 23.9% | 25% | 24.5% | |
| South | 38.7% | 38.1% | 38.4% | |
| West | 17.2% | 15.4% | 16.3% | |
| Hospital Teaching status | 0.41 | |||
| Non-teaching | 48% | 47.9% | 47.9% | |
| Teaching | 51.4% | 51.4% | 51.4% | |
| Admission types | <0.001 | |||
| Emergent/Urgent | 39.3% | 35.4% | 37.3% | |
| Elective admission | 51.3% | 57.3% | 54.4% | |
| Admission day | <0.001 | |||
| Weekdays | 93.8% | 94.8% | 94.3% | |
| Weekend | 6.2% | 5.2% | 5.7% | |
| Acute limb ischemia | 43.7% | 37.3% | 40.3% | <0.001 |
| Chronic limb ischemia | 52.1% | 60.6% | 56.6% | <0.001 |
| Iliac artery | 1.4% | 4.7% | 3.1% | <0.001 |
| Chronic Total Occlusion (ICD9 code-440.4) | 12.3% | 12.6% | 12.4% | 0.007 |
| Thrombolysis(ICD9 code-99.10) | 9.8% | 7.3% | 8.5% | <0.001 |
| Bypass graft intervention | 5.5% | 3.2% | 4.3% | <0.001 |
| Disposition | <0.001 | |||
| Home | 78.9% | 85.1% | 82.1% | |
| Facility/others | 19.4% | 13.5% | 16.3% | |
| Amputation | 12.8% | 6.8% | 9.7% | <0.001 |
| BKA(Below Knee Amputation) | 2.9% | 1.4% | 2.1% | <0.001 |
| AKA(Above Knee Amputation) | 1.7% | 1% | 1.3% | <0.001 |
| Minor amputation | 9.3% | 4.8% | 6.9% | <0.001 |
| Mortality | 1.4% | 1.1% | 1.3% | <0.001 |
| Total charges ($) | 20323±90 | 20993±78 | 20654±60 | <0.001 |
Stay updated, free articles. Join our Telegram channel

Full access? Get Clinical Tree


