Chronotropic incompetence, measured by the percentage (%) of heart rate (HR) reserve achieved (%HR reserve), abnormal HR recovery, reduced exercise capacity (EC), and myocardial perfusion single-photon emission computerized tomography (SPECT MPS) abnormalities are known predictors of all-cause mortality (ACM) and cardiac death (CD). The aim of this study was to determine if EC, %HR reserve, and HR recovery add incremental value to MPS in the prediction of ACM and CD. A total of 11,218 patients without valvular disease and not on β blockers underwent symptom-limited exercise MPS. %HR reserve was (peak HR − rest HR)/(220 − age − rest HR) × 100, with %HR reserve <80 defined as low. HR recovery was peak HR − recovery HR. An HR recovery <22 beats/min at 2 minutes after peak exercise was considered abnormal. Poor EC was defined as exercise duration ≤6 minutes (7 metabolic equivalents). Summed stress scores (SSSs) were calculated using a 20-segment, 5-point MPS model. Statistical analysis was performed using Cox regression models. There were 445 deaths (148 CD) during a mean follow-up of 3.2 ± 2.5 years. In multivariate analysis, the independent predictors of ACM were age, χ 2 = 154.81; EC, χ 2 = 74.00; SSS, χ 2 = 32.99; %HR reserve, χ 2 = 24.74; abnormal electrocardiogram at rest, χ 2 = 23.13; HR recovery, χ 2 = 18.45; diabetes, χ 2 = 17.75; and previous coronary artery disease, χ 2 = 11.85 (p ≤0.0006). The independent predictors of CD were SSS, χ 2 = 54.25; EC, χ 2 = 49.34; age, χ 2 = 46.45; abnormal electrocardiogram at rest, χ 2 = 30.60; previous coronary artery disease, χ 2 = 20.69; Duke treadmill score, χ 2 = 19.50; %HR reserve, χ 2 = 11.43; diabetes, χ 2 = 10.23 (all p ≤0.0014); and HR recovery, χ 2 = 5.30 (p = 0.0214). The exercise variables showed increases in Harrell’s C static and net improvement reclassification, with EC showing the strongest incremental improvement in predicting ACM and CD (respective C-index 76.5% and 83.3% and net reclassification index 0.3201 and 0.4996). In conclusion, EC, %HR reserve, and HR recovery are independent predictors of ACM and CD and add incremental prognostic value to extent and severity of MPS.
Abnormal myocardial perfusion on stress myocardial perfusion single-photon emission computerized tomography (SPECT MPS) is a well-established prognostic marker of cardiac death (CD). Multiple exercise variables are also known to be predictive of cardiac events. Exercise capacity (EC) is a strong predictor of cardiovascular risk and all-cause mortality (ACM). Abnormal heart rate (HR) recovery and chronotropic incompetence (CI), as assessed by a low percentage of HR reserve (%HR reserve), are independent predictors of ACM. These multiple exercise risk markers have not been examined with respect to their added predictive value over extent and severity of MPS abnormality for either ACM or the end point of CD. The purpose of this study was to determine if exercise tolerance, %HR reserve, and HR recovery add incremental value to a comprehensive model of MPS in the prediction of ACM and CD in a large cohort of patients undergoing exercise MPS.
Methods
We identified 11,218 consecutive patients who underwent exercise MPS from 1991 to 1999 at Cedars-Sinai Medical Center, had no history of valvular heart disease, were not under the influence of β blockers at the time of the exercise study, and did not undergo early revascularization, defined as revascularization <90 days after exercise testing. Institutional review board approval was obtained for the performance of this research. Data regarding the presence of hypertension, diabetes mellitus, hypercholesterolemia, smoking, and family history of premature coronary artery disease (CAD) were collected from questioning the patients or from review of medical records at the time of stress testing.
All patients underwent exercise dual-isotope MPS as previously described, performing a symptom-limited treadmill exercise test using the standard Bruce protocol with a 12-lead electrocardiogram (ECG) recording each minute of exercise and continuous monitoring of lead aVF, V 1 , and V 5 during exercise and for 5 minutes into recovery. Whenever possible, patients were off of calcium channel blockers for 48 hours and nitrate compounds for at least 6 hours before testing. During the treadmill exercise test, HR and blood pressure were measured and recorded at rest, at the end of each stress stage, and at peak stress. Exercise end points included physical exhaustion, severe angina, sustained ventricular tachycardia, hemodynamically significant supraventricular dysrhythmias, or significant exertional hypotension.
MPS images were visually assessed using a 20-segment model of the left ventricle and a 5-point (0 = normal; 4 = absent uptake) scoring scale. Summed stress score (SSS) and summed rest score (SRS) were calculated as previously described. The summed difference score (SDS), representing the amount of reversible perfusion defect, was calculated by subtracting SRS from SSS. Negative SDS (rest score > stress score) was set at 0. MPS results were subdivided by SSS as <4 (normal); 4 to 8 (mildly abnormal); 9 to 13 (moderately abnormal); and >13 (severely abnormal).
The rest ECG was considered abnormal if there were any ECG abnormalities other than sinus tachycardia, sinus bradycardia, first-degree atrioventricular block, premature atrial contractions, premature ventricular contractions, mild intraventricular conduction delay, or early repolarization abnormality. Maximal degree of ST-segment change at 80 ms after the J point of the ECG was measured and was considered abnormal when ≥1.0 mm horizontal, ≥1.5 mm upsloping, or ≥0.5 mm downsloping ST depression was observed. ST-segment elevation of ≥0.5 mm was also considered abnormal.
CI was defined as a low %HR reserve. %HR reserve = (peak HR − rest HR)/(maximum age − predicted HR − rest HR) × 100. A low %HR reserve was defined as <80. HR recovery was defined as peak HR − recovery HR. An HR recovery <22 at 2 minutes after peak exercise was considered abnormal as previously described. Subjects were subclassified into 2 groups on the basis of exercise duration, ≤6 minutes and >6 minutes, to broadly classify patients with poor and moderate to superior exercise tolerance, respectively. Estimated EC in metabolic equivalents used previously published tables.
The Social Security Death Index was used to match patients’ names to their social security numbers and to determine ACM. CD was determined by review of death certificate and hospital chart or physician’s records, adjudicated by consensus of 2 experienced cardiologists. Patients were followed up for an average of 3.2 ± 2.5 years (median 2.2 years, interquartile range 1.7- to 4.1, maximum 12.6 years).
All continuous variables were expressed as mean ± 1 standard deviation, whereas categorical variables were expressed as frequencies (%). Comparisons between patient groups were performed by use of a 2-sample t test or Mann–Whitney test for normally distributed or skewed continuous variables, respectively, and a Pearson chi-square test for categorical variables. Ordered comparisons were done using the Cuzick test for trend for continuous and chi-square test for trend for categorical variables. Kaplan–Meier survival curves were generated. Annualized mortality rates were calculated by dividing the number of events by person-years and were compared using the log-rank test and test for trend for ordered groups. Univariate and multivariate Cox proportional hazards models identified and assessed predictors of ACM and CD. Selection of variables for consideration of entry was based on both univariate statistical significance and clinical judgment. Variables initially included in the model were age, gender, family history of premature CAD, hypertension, smoking, hypercholesterolemia, diabetes mellitus, history of myocardial infarction, abnormal ECG at rest, HR at rest, calcium channel blocker use, EC, chest pain during stress test and exercise-induced ST-segment depression, transient ischemic dilation on stress myocardial perfusion imaging, and Duke treadmill score. To evaluate the impact of MPS, %HR reserve, HR recovery, and EC on ACM and CD, these variables were added to respective Cox proportional hazards models. Standardized hazard ratios were obtained by transforming predictors to a mean and standard deviation of 0 ± 1 to better assess their relative predictive potency. The multivariate chi-square contributions of each predictor were compared with the fully adjusted clinical model using the nested likelihood ratio test.
To further compare the incremental predictive value of the exercise variables in prediction of ACM or CD, we assessed the Cox models using Harrell’s C-statistic which was compared with the baseline clinical model using the DeLong algorithm. In addition, we examined net reclassification on the basis of addition of exercise variables to baseline clinical model using the category-free net reclassification index (NRI) on the predicted 4-year probability of events. The assumptions of proportional hazards were verified using Schoenfeld residuals; the calibration (goodness of fit) of the Cox models was assessed and verified using the Gronnesby and Borgan test. Analyses were done using Stata software version 13.1 (StataCorp, College Station, Texas). All tests were 2 sided, and a p value <0.05 was considered significant.
Results
The baseline and stress test characteristics of the 11,218 patients enrolled in this study are summarized on the basis of EC in Tables 1 and 2 . The most common reason for testing was abnormal treadmill exercise test (35%), followed by reported presence of CAD by primary physician (22.5%), unstable angina (16.6%), abnormal ECG at rest (15%), preoperative evaluation (5.9%), and history of arrhythmia (5.4%). Patients with poor exercise tolerance had greater SSS, SRS, and SDS (all p <0.001). Women were more likely than men to exhibit poor exercise tolerance (p <0.001). Table 3 demonstrates the relation between %HR reserve and HR recovery. Of those with an abnormal HR recovery, 39% (898 of 2,299) also had a low %HR reserve, compared to 24% (2,159 of 8,919) of those with normal HR recovery (p <0.001). Conversely, of those patients with a low %HR reserve, 29% (898 of 3,057) had an abnormal HR recovery, compared to 17% (1,401 of 8,161) of those who had normal %HR reserve.
| Variable | Exercise Duration | p value | |
|---|---|---|---|
| ≤ 6 min (n = 4267) | > 6 min (n=6951) | ||
| Mean Age (years) | 68.0± 10.5 | 58.1± 11.9 | <0.001 |
| Men | 1856 (43.5%) | 5330 (76.7%) | <0.001 |
| Resting heart rate | 74.4 ±14.1 | 67.2± 11.6 | <0.001 |
| History of Myocardial infarction | 766 (18.0%) | 1037 (14.9%) | <0.001 |
| History of PCI | 407 (9.5%) | 850 (12.2%) | <0.001 |
| History of CABG | 519 (12.2%) | 723 (10.4%) | 0.004 |
| Hypertension | 2167 (50.8%) | 2431 (35.0%) | <0.001 |
| Diabetes mellitus | 644 (15.1%) | 579 (8.3%) | <0.001 |
| Smoker | 555 (13.0%) | 997 (14.3%) | 0.047 |
| Hyperlipidemia | 1989 (46.6%) | 3301 (47.5%) | 0.367 |
| Family history of coronary artery disease | 1013 (23.7%) | 1934 (27.8%) | <0.001 |
| Abnormal rest ECG | 2757 (64.7%) | 3636 (52.3%) | <0.001 |
| Variable | Exercise Duration | p value | |
|---|---|---|---|
| ≤ 6 min (n = 4267) | > 6 min (n=6951) | ||
| Exercise Duration (minutes) | 4.5 ± 1.1 | 8.9 ± 2.0 | <0.001 |
| Peak heart rate | 141.7± 16.2 | 152.0± 17.2 | <0.001 |
| Peak systolic blood pressure (mmHg) | 161.9 ± 55.3 | 177.3 ± 28.3 | <0.001 |
| ST Depression (mm) | 0.71± 1.0 | 0.81± 1.1 | <0.001 |
| Exertional hypotension | 100 (2.35%) | 144 (2.1%) | 0.340 |
| %HR-reserve < 80 | 1476 (34.6%) | 1581 (22.7%) | <0.001 |
| Heart rate-recovery < 22 beats per minute at 2 min | 1057 (24.7%) | 1242 (17.9%) | <0.001 |
| Summed stress score | 4.6±8.0 | 3.1±6.5 | <0.001 |
| Summed rest score | 1.6±4.9 | 1.1± 4.1 | <0.001 |
| Summed difference score | 2.9±5.5 | 2.0±4.2 | <0.001 |
| Duke Treadmill Score | -0.4±5.9 | 4.0±6.2 | <0.001 |
| %HR-reserve < 80 | %HR-reserve ≥ 80 | Total | |
|---|---|---|---|
| HR-recovery < 22 | 898 | 1401 | 2299 |
| HR-recovery ≥ 22 | 2159 | 6760 | 8919 |
| Total | 3057 | 8161 | 11218 |
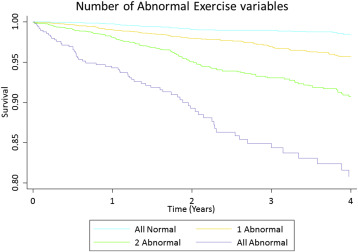
There were 445 total deaths. Figure 1 demonstrates ACM survival as a function of %HR reserve, HR recovery, and EC (p <0.0001). EC, %HR reserve, and HR recovery were all independent predictors of ACM (all p <0.001), after adjustment for age, gender, presence of chest pain, history of CAD, body mass index, hypertension, hyperlipidemia, diabetes, smoking, ECG at rest, chest pain during exercise, diastolic blood pressure at rest, and Duke treadmill score ( Table 4 ).
| Variable | HR | Standardized HR | 95% CI | χ 2 | P-value | |
|---|---|---|---|---|---|---|
| min | max | |||||
| Age, per 5 years | 1.35 | 2.08 | 1.28 | 1.41 | 154.81 | < 0.0001 |
| Exercise capacity | 0.81 | 0.55 | 0.77 | 0.85 | 74.00 | < 0.0001 |
| Severity of stress SPECT defects (SSS) | 1.03 | 1.26 | 1.02 | 1.04 | 32.99 | < 0.0001 |
| %HR-reserve, per 5 | 0.94 | 0.79 | 0.91 | 0.96 | 24.74 | < 0.0001 |
| Abnormal resting ECG | 1.75 | 1.32 | 1.38 | 2.21 | 23.13 | < 0.0001 |
| Heart rate recovery, per 5 | 0.93 | 0.80 | 0.90 | 0.96 | 18.45 | <0.0001 |
| Diabetes mellitus | 1.72 | 1.18 | 1.35 | 2.19 | 17.75 | < 0.0001 |
| Prior coronary artery disease | 1.42 | 1.17 | 1.17 | 1.74 | 11.85 | 0.0006 |
| Hyperlipidemia | 0.73 | 0.86 | 0.60 | 0.89 | 10.09 | 0.0015 |
| Smoking | 1.51 | 1.15 | 1.16 | 1.96 | 8.59 | 0.0034 |
| Hypertension | 1.29 | 1.14 | 1.06 | 1.58 | 6.52 | 0.0107 |
| Diastolic blood pressure at rest, per 5 | 0.95 | 0.89 | 0.90 | 0.99 | 5.39 | 0.0202 |
| Duke Treadmill Score | 0.98 | 0.89 | 0.97 | 1.00 | 4.80 | 0.0284 |
| Male gender | 1.14 | 1.07 | 0.93 | 1.41 | 1.62 | 0.2035 |
| Chest pain symptom | 1.14 | 1.06 | 0.92 | 1.41 | 1.53 | 0.2156 |
| BMI per 5 | 0.95 | 0.96 | 0.85 | 1.07 | 0.62 | 0.4308 |
| Chest pain during exercise | 1.01 | 1.00 | 0.76 | 1.34 | 0.00 | 0.9556 |
There were 148 cardiac deaths. EC, %HR reserve, and abnormal HR recovery were all independent predictors of CD (all p <0.0001), after adjustment for age, gender, presence of chest pain, history of CAD, body mass index, hypertension, hyperlipidemia, diabetes, smoking, family history of CAD, ECG at rest, chest pain during exercise, and ST depression ( Table 5 ). In multivariate analysis, the extent and severity of MPS defects as assessed by the SSS was the most significant predictor of CD (χ 2 = 54.25, p <0.0001) and a significant predictor of ACM (χ 2 = 32.99, p <0.0001). EC was a strong independent predictor of ACM and CD (p <0.001). Within each EC category, the risk of CD and ACM progressively increased as a function of presence of %HR reserve, HR recovery, or both (p ≤0.03; Figure 2 ). Patients with normal exercise tolerance, %HR reserve, and HR recovery had a very low risk of CD (0.1%), whereas those with all 3 variables abnormal were at increased risk of CD (2.2%).
| Variable | HR | Standardized HR | 95% CI | χ 2 | χ 2 P-value | |
|---|---|---|---|---|---|---|
| Lower Level | Upper Level | |||||
| Severity of stress SPECT defects(SSS) | 1.06 | 1.54 | 1.05 | 1.08 | 54.25 | <0.0001 |
| Exercise capacity | 0.73 | 0.43 | 0.67 | 0.80 | 49.34 | <0.0001 |
| Age, per 5 years | 1.34 | 2.06 | 1.23 | 1.46 | 46.45 | <0.0001 |
| Abnormal resting ECG | 3.88 | 1.96 | 2.21 | 6.82 | 30.60 | <0.0001 |
| Prior coronary artery disease | 2.25 | 1.42 | 1.58 | 3.20 | 20.69 | <0.0001 |
| Duke Treadmill Score | 0.92 | 0.60 | 0.90 | 0.95 | 19.50 | <0.0001 |
| %HR-reserve, per 5 | 0.93 | 0.76 | 0.88 | 0.97 | 11.43 | 0.0007 |
| Diabetes mellitus | 1.98 | 1.24 | 1.33 | 2.94 | 10.23 | 0.0014 |
| Heart rate recovery, per 5 | 0.94 | 0.81 | 0.88 | 0.99 | 5.30 | 0.0214 |
| Male gender | 1.44 | 1.19 | 0.98 | 2.12 | 3.56 | 0.0592 |
| Hyperlipidemia | 0.73 | 0.85 | 0.52 | 1.02 | 3.45 | 0.0633 |
| Family History | 1.38 | 1.15 | 0.96 | 1.99 | 2.92 | 0.0877 |
| Smoking | 1.49 | 1.15 | 0.94 | 2.36 | 2.62 | 0.1057 |
| Hypertension | 1.30 | 1.14 | 0.93 | 1.81 | 2.33 | 0.1266 |
| Chest pain during exercise | 1.33 | 1.09 | 0.86 | 2.06 | 1.52 | 0.2177 |
| ST Depression | 1.10 | 1.10 | 0.95 | 1.26 | 1.49 | 0.2215 |
| BMI, per 5 | 0.88 | 0.89 | 0.71 | 1.09 | 1.35 | 0.2459 |
| Chest pain symptom | 1.22 | 1.10 | 0.84 | 1.78 | 1.15 | 0.2834 |
Stay updated, free articles. Join our Telegram channel

Full access? Get Clinical Tree


