Some centers, mostly in Europe, have demonstrated the feasibility of a minimally invasive strategy (MIS; i.e., local anesthesia and conscious sedation, performed in the cath laboratory without transesophageal echocardiography guidance). Nonetheless, the experience of MIS for TAVI using both commercially available valves is lacking in the United States. We, therefore, retrospectively studied all transfemoral TAVI cases performed at our institution between March 2011 and November 2014 to assess the safety and efficacy of MIS. Patients were dichotomized according to the strategy (MIS vs conventional strategy [CS]) used for the procedure. One hundred sixteen patients were included in the MIS group and 91 patients were included in the CS group. Baseline characteristics were similar, and procedural success was comparable (99.1% in MIS and 98.9% in CS, p = 1). One intraprocedural death occurred in each group, whereas conversion rates to general anesthesia were low (3.4%). Comparable device success was obtained. Rates of complications and >mild paravalvular leak before discharge were low and comparable. Length of hospital stay was significantly reduced in the MIS (median, 3.0 [2.0 to 5.0] days) compared with than that in CS group (median 6.0 days [3.5, 8.0]). At a median follow-up of 230 days, no significant difference in survival rate was detected (89% vs 88%, p = 0.9). On average, MIS was associated with remarkable cost saving compared with CS ($16,000/case). In conclusion, TAVI through MIS was associated with a shorter postprocedural hospital stay, lower costs, and similar safety profile while keeping procedural efficacy compared with CS.
Worldwide, most transcatheter aortic valve implantation (TAVI) procedures are performed under general anesthesia (GA) in hybrid operating rooms with transesophageal echocardiography (TEE) guidance (i.e., conventional strategy [CS]). For instance, 98% of cases in the United States and more than 80% in the UK and 66% in France were performed through CS. This strategy, however, leads to greater resource utilization, elevated procedural costs, and increased length of hospital stay, without demonstrated advantages compared with a less invasive strategy (i.e., minimally invasive strategy [MIS]) performed under local anesthesia and conscious sedation without TEE guidance in a regular catheterization laboratory. Some centers, mostly in Europe, have shown the feasibility of transfemoral TAVI using an MIS with predominantly either self- or balloon-expandable valves. Nonetheless, the experience of the MIS for TAVI is largely limited in the United States because of small sample sizes and restricted to balloon-expandable valves. Herein, we describe the evolution of an academic, high-volume TAVI program using either self- or balloon-expandable valves and its transition from a CS to an MIS.
Methods
All TAVI procedures performed between March 2011 and November 2014 at The Valve & Structural Heart Intervention Center, Harrington Heart and Vascular Institute, University Hospitals Case Medical Center were screened. Patients who underwent transfemoral TAVI with the CoreValve (Medtronic, Minneapolis, Minnesota) or Edwards Sapien or Sapien XT valve (Edwards Lifesciences Inc., Irvine, California) were included. These devices have been described in detail elsewhere. This study was approved by the institutional review board of our institution, and all patients signed a written informed consent. Patient data including baseline characteristics, medical history, laboratory results, procedural details, and clinical course were extracted from the electronic medical record and entered into a REDCap electronic data capture tools hosted at University Hospitals, Case Medical Center, Case Western Reserve University. Procedural details, periprocedural hospital course, and subsequent outcomes were captured into the electronic medical record in real time by dedicated physicians and research nurses. Society of Thoracic Surgeons score was obtained for all patients. Preprocedure and postprocedure echocardiographic parameters, length of stay, 30-day mortality, and stroke and/or transient ischemic attack rates were captured. End points were defined as recommended by the Valve Academic Research Consortium-2. Hospital length of stay was calculated from the procedure date to discharge date. Gross cost data for both strategies were obtained from the hospital administration. Survival data were collected in all patients. Patients were dichotomized according to the strategy used for TAVI, as follows: procedures performed in the cath laboratory, under local anesthesia ± conscious sedation without TEE guidance (MIS) and procedures performed in the hybrid operating room (OR), under GA with TEE guidance (CS).
Our TAVI program commenced in March 2011. Eligible TAVI candidates were assessed by the Heart Team in a multispecialty approach. Transthoracic echocardiogram (TTE) was done as part of the initial assessment, and dobutamine stress echo was done when indicated. Careful patient-specific preprocedural multimodality imaging was performed for valve sizing and peripheral vascular access assessment, as follows: retrospective gated contrast-enhanced computed tomography (CT) for patients with a glomerular filtration rate (GFR) >50 ml/min/1.73 m 2 , low contrast single acquisition CT for patients with a GFR of 30 to 50 ml/min/1.73 m 2 and combined magnetic resonance imaging and non–contrast CT for patients with a GFR <30 ml/min/1.73 m 2 .
Importantly, in the beginning of our experience, TAVI procedures were performed after CS in a hybrid OR, under GA administered by a cardiac anesthesiologist. Vascular access was obtained percutaneously followed by double-Proglide sutures (Abbott Vascular Inc, Redwood City, California) or by surgical cutdown before insertion of large bore sheaths. We used the E-sheath (Edwards Lifesciences Inc.) for the Edwards Sapien valve, the Edwards expandable sheath for the Sapien XT valve, and the 18Fr Cook sheath (Cook Group Inc, Bloomington, Indiana) or the SoloPath sheath (Terumo Interventional Systems Inc, Somerset, New Jersey) for the Medtronic CoreValve. Valve crossing, balloon valvuloplasty, and valve deployment were performed as per operator preference and as previously described. TEE, aortography, and hemodynamic measurements were used post deployment to assess for significant aortic regurgitation. Extubation was attempted in OR, then patient was transferred to the cardiac intensive care unit for close monitoring. A temporary pacemaker was removed after 24 hours if no significant conduction disturbance was observed.
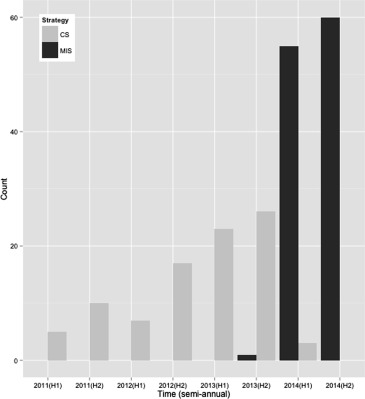
In December 2013, the MIS for transfemoral TAVI was adopted and subsequently all transfemoral TAVI procedures were performed in a standard cardiac catheterization laboratory with TTE assistance, under local anesthesia administered by the procedural operator and minimal sedation, if needed, administered by a cardiac anesthesiologist ( Figure 1 ). Percutaneous femoral access (no surgical cutdowns) and valve deployment were performed in a similar fashion to CS, followed by TTE (performed by dedicated echo technologists) to assess implanted valve function and to rule out potential complications. Specifically, parasternal long axis, parasternal short axis, and 5 chamber TTE views were interpreted by the performing physician to assess for pericardial effusion and aortic regurgitation. Aortography and hemodynamic measurements were also used after deployment to assess for significant aortic regurgitation. After procedure, patients were transferred to the cardiac intensive care unit for a minimum of 24 hours of close monitoring. Patients in the MIS group received a complete explanation by the anesthesiologist of the different parts of the TAVI procedure including what elements may be uncomfortable to them (e.g., hard table, need to lie flat, administration of groin and neck local anesthesia for catheterization, rapid pacing and possible angina, and groin pressure and/or discomfort with femoral instrumentation). Then, they were either lightly sedated or received no premedication or intraprocedural sedatives at the discretion of the attending anesthesiologist. All patients in the MIS group were in constant communication with the anesthesia care provider to provide expectations of the various stimulating elements of the procedure. Patients who received light sedation were treated with either intravenous diphenhydramine 25 to 50 mg or fentanyl 50 to 100 μg plus midazolam 1 to 5 mg titrated to mild anxiolysis and/or sedation. All patients in both the CS and MIS groups were supported as needed to maintain stable hemodynamic parameters with temporary ventricular pacing and intravenous hemodynamically active agents.
Statistical analyses were done using RStudio version 0.98.1091. Continuous variables were summarized as mean ± standard deviation or median (interquartile range) in case of skewed distribution, categorical variables as percentages. The unpaired Student t test, chi-square test, or Fisher’s exact test were performed as appropriate when comparing the groups. Survival analysis was performed using the Kaplan–Meier method. All statistical tests were 2 sided, and p value <0.05 was considered significant.
Results
One hundred sixteen patients were included in the MIS group, and 91 patients were included in the CS group. Baseline clinical characteristics were well balanced between the groups ( Table 1 ). Procedural success was comparable (99.1% in MIS and 98.9% in CS, p = 1). One patient in each group had intraprocedural death (the patient in the MIS group had experienced fatal ventricular fibrillation before valve deployment, whereas the patient in the CS group had experienced hemopericardium due to left ventricular laceration). Device success occurred in 90.5% in MIS and 86.8% in CS (p = 0.54). Four patients in the MIS had to be converted to GA, as follows: (1) pericardial tamponade treated with pericardiocentesis, (2) valve embolization to the left ventricle treated with emergent cardiac surgery, (3) patient’s anxiety requiring intubation with extubation failure due to severe chronic obstructive pulmonary disease, and (4) intraprocedural cardiac arrest. The former 2 patients survived, whereas the latter 2 expired. Contrast volume was significantly reduced in the MIS compared with CS (83.4 ± 62.6 ml vs 134.15 ± 62.0 ml, p <0.001). Surgical cutdown and Proglide utilization were significantly different between groups (0% in MIS vs 55% in CS and 100% in MIS vs 45% in CS, respectively, p <0.001 for both comparisons). Valve in valve and valve embolization rates were low and similar between the groups ( Table 2 ).
| Characteristics | MIS Group (n=116) | CS Group (n=91) | p Value |
|---|---|---|---|
| Age (years) Mean ± Standard Deviation | 81 ± 8 | 81 ± 9 | 0.96 |
| Male | 59 (51%) | 50 (55%) | 0.66 |
| Body mass index (kg/m 2 ) Mean ± Standard Deviation | 29.6 ± 8.7 | 29.4 ± 7.0 | 0.85 |
| Society of thoracic surgeons score Mean ± Standard Deviation | 8.6 ± 5.4 | 9.8 ± 6.0 | 0.16 |
| Syncope | 12 (10%) | 6 (7%) | 0.59 |
| Angina pectoris | 30 (26%) | 21 (23%) | 0.6 |
| New York Heart Association functional classification | 0.15 | ||
| Class I/II | 15 (13%) | 15 (17%) | |
| Class III/IV | 100 (87%) | 74 (83%) | |
| Hypertension | 115 (99%) | 88 (97%) | 0.45 |
| Diabetes mellitus | 55 (47%) | 48 (53%) | 0.53 |
| Cirrhosis | 1 (1%) | 4 (4%) | 0.24 |
| Chronic kidney disease | 45 (39%) | 36 (40%) | 0.45 |
| End stage renal disease | 7 (6%) | 3 (3%) | 0.19 |
| Creatinine (mg/dl) Mean ± Standard Deviation | 1.3 ± 0.9 | 1.4 ± 1.1 | 0.49 |
| Chronic obstructive pulmonary disease | 44 (38%) | 36 (40%) | 0.66 |
| Peripheral arterial disease | 22 (19%) | 26 (28%) | 0.18 |
| Previous stroke/ Transient ischemic attack | 25 (22%) | 15 (17%) | 0.36 |
| Neoplasia | 27 (23%) | 14 (15%) | 0.22 |
| Previous non coronary artery bypass grafting cardiac surgery | 3 (3%) | 2 (2%) | 1 |
| Previous coronary artery bypass grafting surgery | 28 (24%) | 33 (36%) | 0.08 |
| Previous percutaneous coronary intervention | 32 (28%) | 30 (33%) | 0.49 |
| Permanent pacemaker | 17 (15%) | 24 (26%) | 0.054 |
| Atrial fibrillation or flutter | 49 (42%) | 47 (52%) | 0.23 |
| Atrioventricular block | 4 (3%) | 7 (8%) | 0.39 |
| Echocardiogram | |||
| Aortic maximum velocity (m/sec) Mean ± Standard Deviation | 4.13 ± 0.79 | 4.19 ± 0.66 | 0.54 |
| Mean aortic gradient (mm hg) Mean ± Standard Deviation | 41.60 ± 16.13 | 42.35 ± 13.54 | 0.72 |
| Left ventricle outflow tract diameter (cm) Mean ± Standard Deviation | 2.03 ± 0.18 | 2.07 ± 0.19 | 0.16 |
| Aortic valve area (cm 2 ) Mean ± Standard Deviation | 0.75 ± 0.21 | 0.76 ± 0.24 | 0.77 |
| Left ventricular ejection fraction (%) | 51 (14%) | 49 (15%) | 0.52 |
| Right ventricle systolic pressure (mm hg) Mean ± Standard Deviation | 46.4± 14.7 | 50.4 ± 14.8 | 0.14 |
| Characteristics | MIS Group (n=116) | CS Group (n=91) | p Value |
|---|---|---|---|
| Procedural success | 115 (99.1%) | 90 (98.9%) | 1 |
| Intraprocedural death | 1 (0.9%) | 1 (1.1%) | 1 |
| Device success | 105 (90.5%) | 79 (86.8%) | 0.54 |
| Fluoroscopic time (min) Mean ± Standard Deviation | 17.7 ± 8.4 | 19.3± 6.8 | 0.17 |
| Contrast Volume (ml) Mean ± Standard Deviation | 83.4 ± 62.6 | 134.15± 62.0 | <0.001 |
| Pre-dilation | 113 (97.4%) | 89 (97.8%) | 0.4 |
| Balloon expandable valve | 51 (44%) | 34 (37.4%) | 0.41 |
| Self expandable valve | 65 (56%) | 57 (62.6%) | 0.41 |
| Transesophageal echocardiography | 0 | 91 (100%) | <0.001 |
| Transthoracic echocardiography | 116 (100%) | 0 | <0.001 |
| Snaring | 1 (0.9%) | 0 | 1 |
| Valve-in-valve | 1 (0.9%) | 2 (2.2%) | 0.83 |
| Valve embolization | 1 (0.9%) | 1 (1.1%) | 0.52 |
| Post-dilation | 20 (17.2%) | 14 (15.4%) | 0.27 |
| Annulus rupture | 0 | 0 | NA |
| Aortic dissection | 2 (1.7%) | 1 (1.1%) | 1 |
| Emergency open heart surgery | 2 (1.7%) | 0 | 0.59 |
| Intubation | 4 (3.4%) | 91 (100%) | <0.001 |
| Cardiopulmonary resuscitation | 3 (2.6%) | 2 (2.2%) | 1 |
| Stroke/ Transient ischemic attack | 0 | 0 | NA |
| Coronary obstruction | 0 | 0 | NA |
| Surgical cutdown | 0 | 50 (55%) | <0.001 |
| Proglide | 116 (100%) | 41 (45%) | <0.001 |
| Proglide (count) Median [Interquartile range] | 2.0 [2.0,2.0] | 2.0 [2.0,2.0] | 0.68 |
| Pericardial tamponade | 3(2.6%) | 4(4.4%) | 0.74 |
Length of hospital stay was significantly reduced in the MIS group compared with that in CS group (median, 3.0 days [2.0 to 5.0] vs 6.0 days [3.5 to 8.0], respectively, p <0.001). In-hospital mortality was low and comparable (4.3% in the MIS vs 3.3% in CS, p = 0.99). Thirty-day mortality was also similar between the groups (4.3% MIS vs 4.4% in CS, p = 1). Rates of stroke/transient ischemic attack, complete heart block requiring permanent pacemaker implantation, acute kidney injury, and infections were low and similar between the groups ( Table 3 ); likewise were vascular complications and bleeding events ( Table 3 ). In the MIS group, there were 3 life-threating bleedings compared with 4 cases in the CS group. These events were caused by acute hemopericardium due to ventricular perforation during the procedure. Predischarge moderate and severe paravalvular leak detected by TTE was low and similar between the groups. Aortic mean gradient more than 20 mm Hg was detected in 4.1% in the MIS group compared with 7.2% in the CS group, p = 0.55 ( Table 3 ). At a median follow-up of 230 days, no significant difference in the survival rate between the groups was detected (89% in MIS and 88% in CS, p = 0.9; Figure 2 ). MIS led to important cost savings per procedure compared with CS (i.e., $ 16,000).


