The cardiac valves function to maintain unidirectional flow, thus ensuring that the energy released during myocardial contraction is utilized efficiently for the circulation of blood around the body. When the valves become diseased (either by restriction [stenosis] or insufficiency [regurgitation]), efficient unidirectional flow is compromised and various compensatory mechanisms are brought into play to maintain adequate blood flow to support the metabolic needs of the body. These mechanisms—chiefly dilatation and hypertrophy—have their own clinical costs, which are responsible for the major manifestations of valvular heart disease.
Valvular heart disease imposes two different types of stress on the cardiac chamber proximal to the lesion: either pressure overload (increased afterload) or volume overload (increased preload). The former is generally the result of valvular stenosis, and the latter, of valvular insufficiency. Both pressure overload and volume overload serve as stimuli for compensatory mechanisms, chiefly hypertrophy (which allows the generation of greater systolic force and at the same time tends to normalize wall stress by increasing wall thickness) and dilatation (which enables increased strength and extent of shortening by the Frank-Starling mechanism). These mechanisms preserve the circulation at the cost of increased myocardial oxygen needs and elevated ventricular filling pressures, leading to clinical evidence of ischemia and congestive heart failure.
This chapter will illustrate the hemodynamic and angiographic findings seen in patients with valvular heart disease. Application of the general physiologic principles discussed above in the interpretation of catheterization data will enable the physician to unravel even the most complicated problems.
MITRAL STENOSIS
The orifice area of the normal mitral valve is about 4.5 cm
2. Most often, as a result of chronic rheumatic heart disease, the orifice becomes progressively smaller, and this leads to at least two distinct and important circulatory changes.
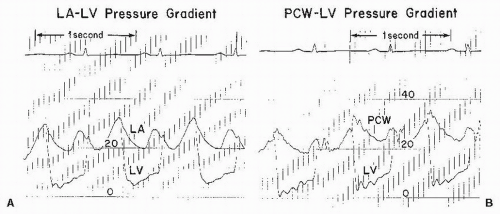
1 The first is the development of a pressure gradient across the mitral valve, the left ventricular mean diastolic pressure remaining at its normal level of about 5 mmHg and the left atrial mean pressure rising progressively, reaching about 15 to 25 mmHg when the orifice of the mitral valve is reduced to approximately 1.0 cm
2 (
Figure 40.1). The second major circulatory change is reduction of blood flow across the mitral valve, that is, reduction of cardiac output. The normal resting cardiac output of 3.0 L/minute per m
2 usually
falls to about 2.5 L/minute per m
2 when the valve size is 1.0 cm
2. A rise in left atrial pressure necessitates a similar rise in pressure in pulmonary veins and capillaries, and pulmonary edema occurs when the pulmonary capillary pressure exceeds the oncotic pressure of normal plasma, which is about 25 mmHg.
Reactive pulmonary hypertension practically never occurs in mitral stenosis until the mitral valve area approaches 1.0 cm2, that is, when the resting left atrial pressure approaches 25 mmHg. After this point, reactive changes in the pulmonary arteriolar bed develop frequently, resulting in progressive obstruction to blood flow through the lungs.
As pulmonary vascular obstruction becomes increasingly severe, the pulmonary arterial pressure rises and occasionally may exceed the systemic arterial pressure. In the extreme case, the pulmonary vascular resistance can rise to 25 or 30 times the normal. Despite substantial hypertrophy, the right ventricle cannot cope with the enormous pressure load imposed on it, and it dilates and fails.
The Second Stenosis
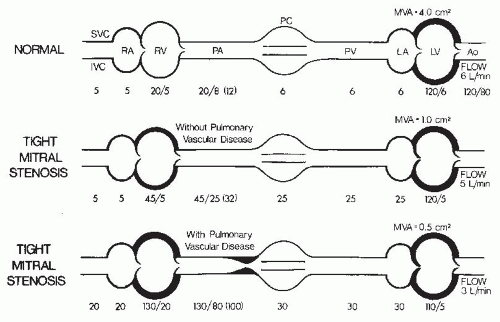
Thus, in mitral stenosis, two stenoses eventuate—the first at the mitral valve and the second in the arterioles of the lung. The hemodynamic findings in patients with tight mitral stenoses with and without major pulmonary vascular disease are illustrated in
Figure 40.2. As can be seen, the second stenosis (
Figure 40.2, bottom) has resulted in a 70-mmHg mean pressure gradient across the lungs, giving rise to a pulmonary vascular resistance of 1,866 dyn·second·cm
−5. Workup of the patient with mitral stenosis should include an assessment of both these obstructions.
Catheterization Protocol
The usual indication for cardiac catheterization in patients with mitral stenosis is that the patient is being considered for either balloon mitral valvuloplasty or corrective surgery. Catheterization should be a combined right and left heart procedure in which the following measurements and calculations are made:
1. Simultaneous left ventricular diastolic pressure, left atrial (or pulmonary capillary wedge) diastolic pressure, heart rate, diastolic filling period, and cardiac output. From these, the size of the mitral valve orifice may be calculated (see
Chapter 13 for details of orifice area calculation).
2. If the transmitral pressure gradient is <5 mmHg, the error in calculation of the mitral valve orifice area is appreciable. The circulatory measurements should be repeated under circumstances of stress (exercise, reversible increase in preload resulting from passive elevation of the patient’s legs, tachycardia induced by pacing) to increase the pressure gradient across the mitral valve.
3. Simultaneously, or in close succession, pulmonary arterial mean pressure, left atrial (or pulmonary capillary wedge) mean pressure, and cardiac output for the calculation of pulmonary vascular resistance.
4. Right ventricular systolic and diastolic pressures for assessment of right ventricular function.
5. If other lesions are suspected (e.g., mitral regurgitation, associated rheumatic tricuspid stenosis, aortic valve disease, and left atrial myxoma), they too must be evaluated. In this regard, it should be pointed out that certain lesions tend to occur in combination with mitral stenosis.
Many (if not most) patients with severe mitral stenosis have some degree of aortic regurgitation. Also, although it is very rare, tricuspid stenosis should always be looked for in the patient with severe mitral stenosis, because the former is seen only in association with the latter condition. Another condition that may be associated with mitral stenosis is atrial septal defect with left-to-right shunt. The combination of mitral stenosis and atrial septal defect is known as the Lutembacher syndrome. Thus, as with standard right heart catheterization, the operator should obtain screening blood samples from the superior vena cava and pulmonary artery for oximetry determination. This has taken on added importance in the present era when balloon mitral valvuloplasty (see
Chapter 33) has become a standard treatment for mitral stenosis. Balloon mitral valvuloplasty generally requires trans-septal catheterization and involves limited dilatation of the interatrial septum; thus the procedure may create an atrial septal defect, thereby producing iatrogenic Lutembacher syndrome.
2 A few patients who present with recurrent mitral stenosis after prior valvuloplasty will have such a persistent iatrogenic atrial septal defect.
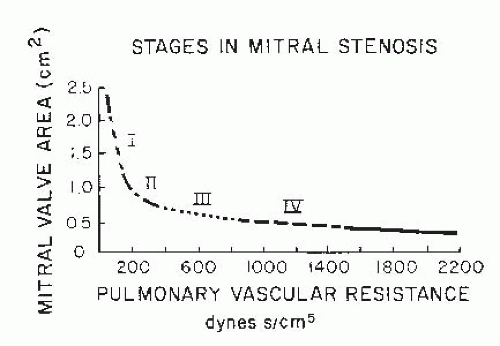
The following case studies illustrate the different clinical and hemodynamic syndromes seen in patients with mitral stenosis. The first is a typical example of a symptomatic patient with severe mitral stenosis, normal pulmonary vascular resistance, and a normal-sized heart (stage II,
Figure 40.3). The second is an example of a relatively asymptomatic patient with more severe mitral stenosis, a fivefold to tenfold increase of pulmonary vascular resistance, and an enlarged heart caused principally by enlargement of the right ventricle (stage III,
Figure 40.3). The third represents terminal mitral stenosis with an extreme degree of pulmonary vascular resistance, pulmonary hypertension, and right ventricular failure (stage IV,
Figure 40.3).
MITRAL REGURGITATION
Mitral incompetence, that is, failure of the valve to prevent regurgitation of blood from the left ventricle to the left atrium during ventricular systole, may be caused by functional or anatomic inadequacy of any one of the components of the mitral valve apparatus, which consists of two valve leaflets, two papillary muscles with their chordae tendineae, and the valve ring or annulus.
Mitral regurgitation may occur when there is destruction or deformation of the valve leaflets as a result of rheumatic fever or bacterial endocarditis. In patients with mitral regurgitation resulting from either of these conditions, mitral regurgitation begins during “isometric” ventricular contraction and continues throughout systole, thus giving rise to a holosystolic murmur. A fibromyxomatous process in the mitral valve leaflets and chordae tendineae may give rise to mitral prolapse and the floppy valve syndrome. In such patients, regurgitation usually does not begin until ventricular ejection has led to a reduction in left ventricular chamber size, so that the regurgitation and accompanying murmur occur in middle or late systole. There may or may not be evidence of Marfan syndrome in these patients. The papillary muscles are usually normal, but there is a marked redundancy of the valve leaflets and chordae with resulting prolapse into the left atrium during systole and accompanying regurgitation.
The papillary muscles are particularly vulnerable to ischemia from coronary artery disease as well as to damage from viral myocarditis. The posterior papillary muscle derives its blood supply from the right coronary and left circumflex arteries. Ischemic dysfunction of this muscle may occur in association with either an inferior or a posterolateral myocardial infarction. Less frequently, ischemic involvement of the anterior papillary muscle in an anterior or anterolateral infarction produces mitral regurgitation. Papillary-chordal integrity is maintained to the point when the left ventricle dilates. The common occurrence of a mitral regurgitant murmur in patients with large left ventricles, however, may reflect a simple anatomic loss of this integrity, an involvement of the papillary muscle with the same disease that causes the left ventricle to dilate, or an abnormality of contraction of the mitral annulus.
Physiology
Mitral regurgitation from whatever cause implies a double outlet to the left ventricle: During systole, blood exits the left ventricle through both aortic and mitral valves. Although total left ventricular output rises, forward output into the aorta may fall. The left ventricular “output” or regurgitant volume through the mitral valve depends on at least five factors: size of the regurgitant orifice, left atrial compliance, systolic mean pressure difference between the left ventricle and the left atrium, duration of systole, and resistance to forward ejection of blood through the aortic valve and into the aorta (e.g., aortic stenosis or peripheral vasoconstriction exacerbates mitral regurgitation). Although hypertension aggravates and lowering of systemic blood pressure lessens mitral regurgitation, the most important factor is probably the size of the regurgitant orifice. In normal subjects and in most other valve lesions, the left ventricular mass-to-volume ratio is >1.0. There is proportionately less left ventricular mass in mitral regurgitation with a mass-to-volume ratio of <1.0. Thus, the radiusto-thickness ratio is high and, despite the usual assumption that the left ventricle is unloaded into the left atrium, systolic wall stress and thus afterload are actually higher than normal.
In patients with mitral regurgitation, cardiac catheterization is important to provide a complete hemodynamic and angiographic assessment of the severity of the valvular lesion.
Hemodynamic Assessment
First, it is important to assess the hemodynamic consequences of the mitral regurgitation by measuring cardiac output and right and left heart pressures.
3,
4,
5,
6,
7,
8
Interpretation of v Waves in the Pulmonary Capillary Wedge Tracing
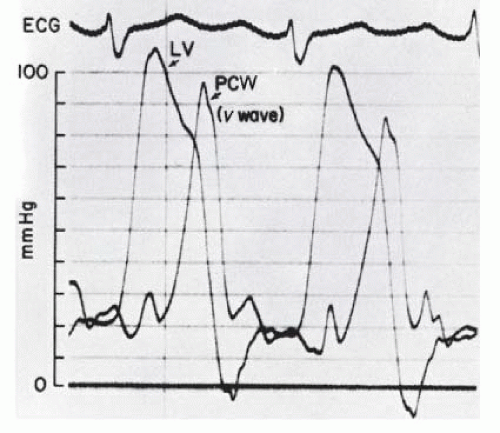
With acute mitral regurgitation (e.g., ruptured chordae tendineae), giant
v waves will be seen in the left atrial or pulmonary artery pressure tracing (
Figure 40.4). In this regard, our fellows and residents have often asked, “How large must a
v wave be to be diagnostic of severe mitral regurgitation?” In our experience,
v waves up to twice the mean left atrial pressure can be seen in the absence of any mitral regurgitation.
9 The patient with left ventricular failure from any cause may have a distended, noncompliant left atrium, and the normal
v wave (which is owing to left atrial filling from the pulmonary veins during left ventricular systole) will be prominent in such a setting.
7 When pulmonary blood flow is increased, the normal
v wave increases in prominence correspondingly; this is particularly striking in acute ventricular septal defect complicating myocardial infarction, wherein enormous
v waves (>50 mmHg) can be seen in the absence of any mitral regurgitation.
9A
v wave larger than twice the mean left atrial (or pulmonary capillary wedge) pressure is suggestive of severe mitral regurgitation, and when the height of the
v wave is three times the mean pulmonary capillary wedge or left atrial pressure, a diagnosis of severe mitral regurgitation is virtually certain (see
Figure 40.4). We hasten to point out, however, that the absence of a prominent
v wave by no means rules out severe mitral regurgitation. Slowly developing chronic mitral regurgitation commonly leads to marked left atrial enlargement, and the dilated left atrium can accept an enormous regurgitant volume per beat without any increase in mean pressure or height of the
v wave.
10 Also, the level of afterload, as determined by systemic vascular resistance, may affect to a great extent the height of the regurgitant wave, or
v wave, in patients with mitral regurgitation.
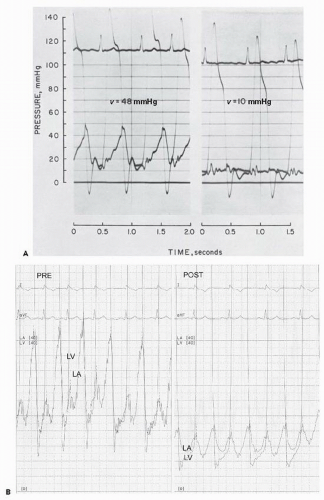
4 As seen in
Figure 40.5A, a patient with severe mitral regurgitation had a
v wave of 48 mmHg when left ventricular (LV) systolic pressure was approximately 140 mmHg. With sodium nitroprusside (right), the LV systolic pressure came down to 120 mmHg, and the
v wave was essentially abolished.
11 Although this patient’s regurgitant fraction was reduced with sodium nitroprusside (from 80% to 64%), it still remained in the range of severe mitral regurgitation (see below). As summarized in a study by Snyder et al.
12 and more recently by Syed,
9 prominent
v waves in the pulmonary capillary wedge (PCW) tracing are insensitive to and have a poor positive predictive value in identifying moderate or severe mitral regurgitation.
Exercise Hemodynamics
Another important hemodynamic parameter in the assessment of mitral regurgitation is the forward cardiac output. Low cardiac output is common in advanced mitral regurgitation and may account for much of the clinical picture. If resting cardiac output is near normal, and if the patient’s primary symptoms are related to exertion (i.e., easy fatigability and dyspnea on exertion), dynamic exercise during cardiac catheterization may be revealing. If the symptoms are cardiac in origin, the patient usually fails to increase cardiac output appropriately with exercise; that is, the increase in cardiac output will be <80% of predicted increase (see the formula for prediction of cardiac output increase with exercise in
Chapter 20). In addition, pulmonary capillary wedge or left atrial mean pressure will rise with exercise, commonly reaching levels of >35 mmHg by 4 to 5 minutes of supine bicycle exercise, even if the control value was nearly normal.
Angiographic Assessment
The second objective of cardiac catheterization in patients with mitral regurgitation is the angiographic assessment of the severity of the regurgitation by left ventriculography. The assessment is qualitative, by noting the degree of opacification of the left atrium owing to regurgitation back through the incompetent valve, using a scale of 1+ (mild), 2+ (moderate), 3+ (moderately severe), and 4+ (severe) regurgitation. Although these grades are subjective, certain criteria can be used to enhance consistency of their usage. Regurgitation classified as 1+ clears with each beat and never opacifies the entire left atrium. When regurgitation is 2+ (moderate), it does not clear with one beat and generally does opacify the entire left atrium (albeit faintly) after several beats; however, opacification of the left atrium does not equal that of the left ventricle. In 3+ regurgitation (moderately severe), the left atrium is completely opacified and achieves the same level of opacification as that of the left ventricle. In 4+ regurgitation (severe), opacification of the entire left atrium occurs within one beat, the opacification becomes progressively more dense with each beat, and contrast material can be seen refluxing into the pulmonary veins during left ventricular systole.
Regurgitant Fraction
Angiographic assessment of the severity of mitral regurgitation may be made more quantitative by calculation of the regurgitant fraction. This entails measurement of the total left ventricular stroke volume (TSV) from the left ventriculogram and the amount that goes forward by way of the aorta to the body (the forward stroke volume, FSV) by the Fick method or by the indicator-dilution technique. TSV is calculated as the difference between end-diastolic and end-systolic left ventricular volumes (EDV − ESV = TSV), as described in
Chapter 21. Regurgitant stroke volume (RSV, regurgitant volume per beat) is then calculated as RSV = TSV − FSV, and regurgitant fraction (RF) as RF = RSV/TSV.
The accuracy of these calculations depends on many factors. Because FSV is calculated by dividing cardiac output by heart rate at the time of the Fick (or other) cardiac output determination, it is an average stroke volume. The particular beat chosen from the left ventriculogram for volume determination must therefore be an average or representative beat; alternatively, volumes from multiple beats may be calculated and averaged. Thus, in patients with atrial fibrillation or extrasystoles during ventriculography, the regurgitant stroke volume and regurgitant fraction may be highly inaccurate and should not be calculated. It should also be obvious that the accuracy of the regurgitant fraction depends on a similar physiologic state prevailing between the cardiac output and the angiographic phases of the catheterization procedure. An increase in arterial blood pressure may substantially increase mitral regurgitation and decrease forward output. Therefore, if blood pressure or other hemodynamic variables change significantly between the time of cardiac output determination and that of left ventriculography, it is pointless to calculate regurgitant fraction. Finally, regurgitant fraction quantifies, at best, the total amount of regurgitation. Thus, if a patient has both mitral and aortic regurgitation, the regurgitant fraction gives an assessment of the regurgitation owing to both lesions combined.
A study from the Mayo Clinic used left ventricular cineangiography to calibrate Doppler echocardiographic techniques for quantification of mitral regurgitation in 180 patients with isolated, pure mitral regurgitation.
13 Patients underwent left ventricular cineangiography to quantify mitral regurgitation, using a grading scale of I to IV, much the same as just described above. They found that grade I angiographic mitral regurgitation corresponded to a Doppler measured regurgitant fraction of 28 ± 9%, grade II to 38 ± 9%, grade III to 44 ± 10%, and grade IV to 59 ± 12%. The finding that grade I angiographic mitral regurgitation corresponded to a regurgitant fraction of 28 ± 9% is surprising, and probably reflects the sensitivity of the Doppler technique in detecting mitral regurgitation. Using angiographic methods for quantifying left ventricular volumes and regurgitant fraction, grade I (mild) angiographic mitral regurgitation probably corresponds to a regurgitant fraction of <20%, grade II (moderate) to 21% to 40%, grade III (moderately severe) to 41% to 60%, and grade IV (severe) to >60%, although greater precision is limited by contrast injection technique, arrhythmia, and variations in left atrial size
14 (see
Chapter 17).
A third objective of cardiac catheterization in patients with mitral regurgitation is the assessment of left ventricular function by measuring the left ventricular diastolic pressure and, more importantly, by measuring the left ventricular ejection fraction and end-systolic volume. As others have emphasized, the nearer the preoperative ejection fraction is to normal, the higher is the degree of postoperative restoration to full activity. Specific parameters of left ventricular function are discussed in
Chapters 21 and
22.
Catheterization Protocol
1. Right heart catheterization for evaluation of right atrial pressure (to detect possible tricuspid valve disease or right ventricular failure), pulmonary artery pressure (degree of pulmonary hypertension), and wedge pressure (
v wave height). In severe, acute mitral regurgitation, a
v wave may actually be seen as a second or late systolic hump in the pulmonary artery pressure waveform.
8
2. Left heart catheterization for measurement of left ventricular end-diastolic pressure (LVEDP) and assessment of gradients (if any) across the mitral or aortic valve. A characteristic of severe mitral regurgitation is that the LVEDP is usually much lower than the left atrial (LA) or PCW mean pressure. In contrast, in LV failure owing to cardiomyopathy or coronary artery disease, LVEDP is usually close or equal to the PCW mean pressure, whereas in aortic regurgitation or LV aneurysm, LVEDP is usually much higher than PCW mean pressure.
3. Cardiac output by the Fick or indicator-dilution technique. This measures the fraction of blood going out by way of the aorta to the body and by itself yields no information about regurgitant flow. However, the response of forward cardiac output to dynamic exercise may provide useful information, because patients with severe mitral regurgitation are generally incapable of increasing forward output commensurate with the needs of the body, as estimated by the increased oxygen consumption (see
Chapter 20).
4. Left ventriculography is the definitive method for evaluating mitral regurgitation. By this procedure, it is possible to measure left ventricular volumes and regurgitant fraction, as discussed previously. Coronary angiography usually is carried out as well, to assess the need for revascularization at the time of valve repair/replacement surgery, should that prove necessary.
5. Pharmacologic intervention. Bolus injections of nitroglycerin or an infusion of sodium nitroprusside (see
Figure 40.5A) often has a dramatic and salutary effect on the hemodynamic abnormalities in mitral regurgitation and may have both diagnostic and therapeutic value. Although TSV may not change, RSV decreases and FSV increases, leading to increased cardiac output.